This pipeline uses various statistical tests to identify miRs whose expression levels correlated to selected clinical features.
Testing the association between 506 genes and 8 clinical features across 43 samples, statistically thresholded by Q value < 0.05, 3 clinical features related to at least one genes.
-
3 genes correlated to 'PATHOLOGY.T'.
-
HSA-MIR-1293 , HSA-MIR-224 , HSA-MIR-452
-
4 genes correlated to 'PATHOLOGICSPREAD(M)'.
-
HSA-MIR-224 , HSA-MIR-3940 , HSA-MIR-20B , HSA-MIR-452
-
2 genes correlated to 'TUMOR.STAGE'.
-
HSA-MIR-224 , HSA-MIR-452
-
No genes correlated to 'Time to Death', 'AGE', 'GENDER', 'KARNOFSKY.PERFORMANCE.SCORE', and 'PATHOLOGY.N'.
Complete statistical result table is provided in Supplement Table 1
Table 1. Get Full Table This table shows the clinical features, statistical methods used, and the number of genes that are significantly associated with each clinical feature at Q value < 0.05.
| Clinical feature | Statistical test | Significant genes | Associated with | Associated with | ||
|---|---|---|---|---|---|---|
| Time to Death | Cox regression test | N=0 | ||||
| AGE | Spearman correlation test | N=0 | ||||
| GENDER | t test | N=0 | ||||
| KARNOFSKY PERFORMANCE SCORE | Spearman correlation test | N=0 | ||||
| PATHOLOGY T | Spearman correlation test | N=3 | higher pT | N=3 | lower pT | N=0 |
| PATHOLOGY N | t test | N=0 | ||||
| PATHOLOGICSPREAD(M) | t test | N=4 | m1 | N=4 | m0 | N=0 |
| TUMOR STAGE | Spearman correlation test | N=2 | higher stage | N=2 | lower stage | N=0 |
Table S1. Basic characteristics of clinical feature: 'Time to Death'
| Time to Death | Duration (Months) | 0.5-86.7 (median=11.6) |
| censored | N = 35 | |
| death | N = 8 | |
| Significant markers | N = 0 |
Table S2. Basic characteristics of clinical feature: 'AGE'
| AGE | Mean (SD) | 60 (12) |
| Significant markers | N = 0 |
Table S3. Basic characteristics of clinical feature: 'GENDER'
| GENDER | Labels | N |
| FEMALE | 13 | |
| MALE | 30 | |
| Significant markers | N = 0 |
No gene related to 'KARNOFSKY.PERFORMANCE.SCORE'.
Table S4. Basic characteristics of clinical feature: 'KARNOFSKY.PERFORMANCE.SCORE'
| KARNOFSKY.PERFORMANCE.SCORE | Mean (SD) | 78.33 (39) |
| Score | N | |
| 0 | 1 | |
| 90 | 3 | |
| 100 | 2 | |
| Significant markers | N = 0 |
Table S5. Basic characteristics of clinical feature: 'PATHOLOGY.T'
| PATHOLOGY.T | Mean (SD) | 1.95 (0.92) |
| N | ||
| T1 | 19 | |
| T2 | 7 | |
| T3 | 17 | |
| Significant markers | N = 3 | |
| pos. correlated | 3 | |
| neg. correlated | 0 |
Table S6. Get Full Table List of 3 genes significantly correlated to 'PATHOLOGY.T' by Spearman correlation test
| SpearmanCorr | corrP | Q | |
|---|---|---|---|
| HSA-MIR-1293 | 0.7066 | 4.313e-06 | 0.00218 |
| HSA-MIR-224 | 0.6134 | 1.563e-05 | 0.00789 |
| HSA-MIR-452 | 0.5738 | 5.762e-05 | 0.029 |
Figure S1. Get High-res Image As an example, this figure shows the association of HSA-MIR-1293 to 'PATHOLOGY.T'. P value = 4.31e-06 with Spearman correlation analysis.
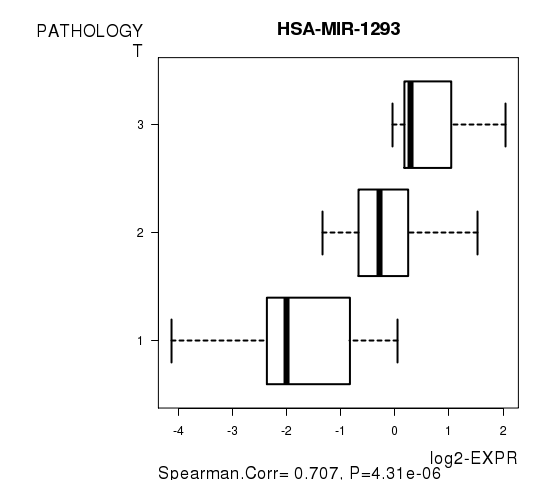
Table S7. Basic characteristics of clinical feature: 'PATHOLOGY.N'
| PATHOLOGY.N | Labels | N |
| N0 | 7 | |
| N1 | 9 | |
| Significant markers | N = 0 |
Table S8. Basic characteristics of clinical feature: 'PATHOLOGICSPREAD(M)'
| PATHOLOGICSPREAD(M) | Labels | N |
| M0 | 30 | |
| M1 | 5 | |
| Significant markers | N = 4 | |
| Higher in M1 | 4 | |
| Higher in M0 | 0 |
Table S9. Get Full Table List of 4 genes differentially expressed by 'PATHOLOGICSPREAD(M)'
| T(pos if higher in 'M1') | ttestP | Q | AUC | |
|---|---|---|---|---|
| HSA-MIR-224 | 5.85 | 4.846e-06 | 0.00225 | 0.8733 |
| HSA-MIR-3940 | 5.46 | 1.37e-05 | 0.00636 | 0.8889 |
| HSA-MIR-20B | 5.05 | 1.697e-05 | 0.00786 | 0.86 |
| HSA-MIR-452 | 4.66 | 8.577e-05 | 0.0396 | 0.8533 |
Figure S2. Get High-res Image As an example, this figure shows the association of HSA-MIR-224 to 'PATHOLOGICSPREAD(M)'. P value = 4.85e-06 with T-test analysis.
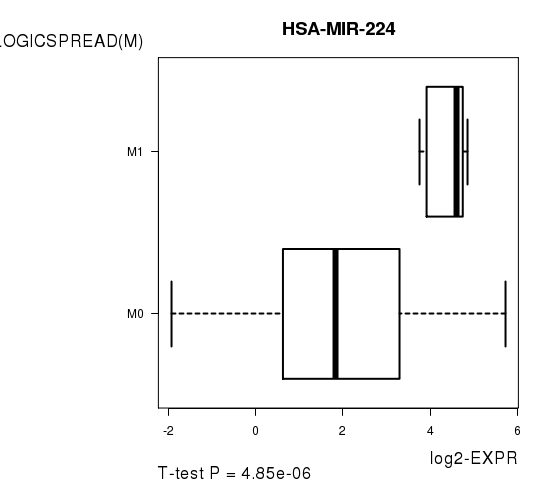
Table S10. Basic characteristics of clinical feature: 'TUMOR.STAGE'
| TUMOR.STAGE | Mean (SD) | 2.17 (1.2) |
| N | ||
| Stage 1 | 16 | |
| Stage 2 | 2 | |
| Stage 3 | 12 | |
| Stage 4 | 5 | |
| Significant markers | N = 2 | |
| pos. correlated | 2 | |
| neg. correlated | 0 |
Table S11. Get Full Table List of 2 genes significantly correlated to 'TUMOR.STAGE' by Spearman correlation test
| SpearmanCorr | corrP | Q | |
|---|---|---|---|
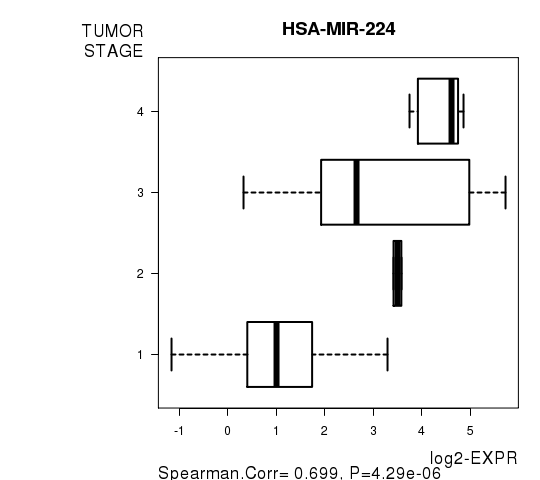
| HSA-MIR-224 | 0.6988 | 4.294e-06 | 0.00217 |
| HSA-MIR-452 | 0.6278 | 5.417e-05 | 0.0274 |
Figure S3. Get High-res Image As an example, this figure shows the association of HSA-MIR-224 to 'TUMOR.STAGE'. P value = 4.29e-06 with Spearman correlation analysis.
-
Expresson data file = KIRP.miRseq_RPKM_log2.txt
-
Clinical data file = KIRP.clin.merged.picked.txt
-
Number of patients = 43
-
Number of genes = 506
-
Number of clinical features = 8
For survival clinical features, Wald's test in univariate Cox regression analysis with proportional hazards model (Andersen and Gill 1982) was used to estimate the P values using the 'coxph' function in R. Kaplan-Meier survival curves were plot using the four quartile subgroups of patients based on expression levels
For continuous numerical clinical features, Spearman's rank correlation coefficients (Spearman 1904) and two-tailed P values were estimated using 'cor.test' function in R
For two-class clinical features, two-tailed Student's t test with unequal variance (Lehmann and Romano 2005) was applied to compare the log2-expression levels between the two clinical classes using 't.test' function in R
For multiple hypothesis correction, Q value is the False Discovery Rate (FDR) analogue of the P value (Benjamini and Hochberg 1995), defined as the minimum FDR at which the test may be called significant. We used the 'Benjamini and Hochberg' method of 'p.adjust' function in R to convert P values into Q values.
This is an experimental feature. The full results of the analysis summarized in this report can be downloaded from the TCGA Data Coordination Center.