This pipeline uses various statistical tests to identify mRNAs whose expression levels correlated to selected clinical features.
Testing the association between 17799 genes and 3 clinical features across 179 samples, statistically thresholded by Q value < 0.05, 3 clinical features related to at least one genes.
-
4 genes correlated to 'Time to Death'.
-
IL2RA|3559_CALCULATED , C2ORF67|151050_CALCULATED , TREML2|79865_CALCULATED , MYB|4602_CALCULATED
-
19 genes correlated to 'AGE'.
-
GBP2|2634_CALCULATED , PI4K2A|55361_CALCULATED , STK16|8576|2OF2_CALCULATED , SLC22A16|85413_CALCULATED , HK2|3099_CALCULATED , ...
-
26 genes correlated to 'GENDER'.
-
DDX3Y|8653_CALCULATED , XIST|7503_CALCULATED , TSIX|9383_CALCULATED , ZFY|7544_CALCULATED , EIF1AY|9086_CALCULATED , ...
Complete statistical result table is provided in Supplement Table 1
Table 1. Get Full Table This table shows the clinical features, statistical methods used, and the number of genes that are significantly associated with each clinical feature at Q value < 0.05.
| Clinical feature | Statistical test | Significant genes | Associated with | Associated with | ||
|---|---|---|---|---|---|---|
| Time to Death | Cox regression test | N=4 | shorter survival | N=2 | longer survival | N=2 |
| AGE | Spearman correlation test | N=19 | older | N=14 | younger | N=5 |
| GENDER | t test | N=26 | male | N=13 | female | N=13 |
Table S1. Basic characteristics of clinical feature: 'Time to Death'
| Time to Death | Duration (Months) | 0.9-94.1 (median=12) |
| censored | N = 60 | |
| death | N = 95 | |
| Significant markers | N = 4 | |
| associated with shorter survival | 2 | |
| associated with longer survival | 2 |
Table S2. Get Full Table List of 4 genes significantly associated with 'Time to Death' by Cox regression test
| HazardRatio | Wald_P | Q | C_index | |
|---|---|---|---|---|
| IL2RA|3559_CALCULATED | 1.25 | 1.685e-06 | 0.03 | 0.638 |
| C2ORF67|151050_CALCULATED | 0.46 | 1.739e-06 | 0.031 | 0.342 |
| TREML2|79865_CALCULATED | 1.56 | 2.37e-06 | 0.042 | 0.657 |
| MYB|4602_CALCULATED | 0.57 | 2.773e-06 | 0.049 | 0.35 |
Figure S1. Get High-res Image As an example, this figure shows the association of IL2RA|3559_CALCULATED to 'Time to Death'. four curves present the cumulative survival rates of 4 quartile subsets of patients. P value = 1.69e-06 with univariate Cox regression analysis using continuous log-2 expression values.
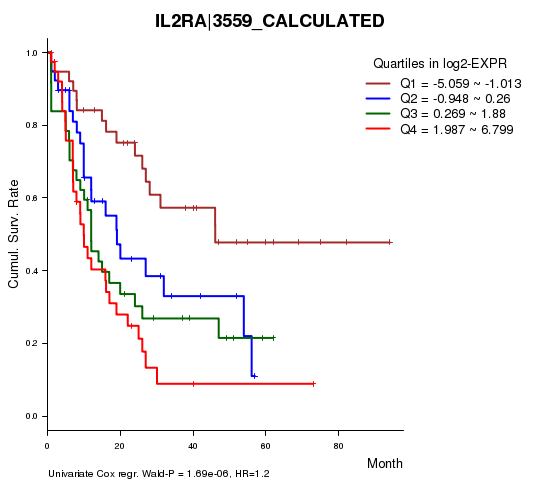
Table S3. Basic characteristics of clinical feature: 'AGE'
| AGE | Mean (SD) | 55.02 (16) |
| Significant markers | N = 19 | |
| pos. correlated | 14 | |
| neg. correlated | 5 |
Table S4. Get Full Table List of top 10 genes significantly correlated to 'AGE' by Spearman correlation test
| SpearmanCorr | corrP | Q | |
|---|---|---|---|
| GBP2|2634_CALCULATED | 0.4064 | 1.651e-08 | 0.000294 |
| PI4K2A|55361_CALCULATED | 0.39 | 6.801e-08 | 0.00121 |
| STK16|8576|2OF2_CALCULATED | 0.3766 | 2.034e-07 | 0.00362 |
| SLC22A16|85413_CALCULATED | -0.3601 | 7.399e-07 | 0.0132 |
| HK2|3099_CALCULATED | -0.3595 | 7.71e-07 | 0.0137 |
| ITPKA|3706_CALCULATED | -0.356 | 1.076e-06 | 0.0191 |
| C6ORF105|84830_CALCULATED | 0.3586 | 1.104e-06 | 0.0196 |
| C7ORF58|79974_CALCULATED | 0.3551 | 1.156e-06 | 0.0206 |
| PLXNA1|5361_CALCULATED | 0.3517 | 1.379e-06 | 0.0245 |
| BDH1|622_CALCULATED | -0.3503 | 1.537e-06 | 0.0273 |
Figure S2. Get High-res Image As an example, this figure shows the association of GBP2|2634_CALCULATED to 'AGE'. P value = 1.65e-08 with Spearman correlation analysis. The straight line presents the best linear regression.
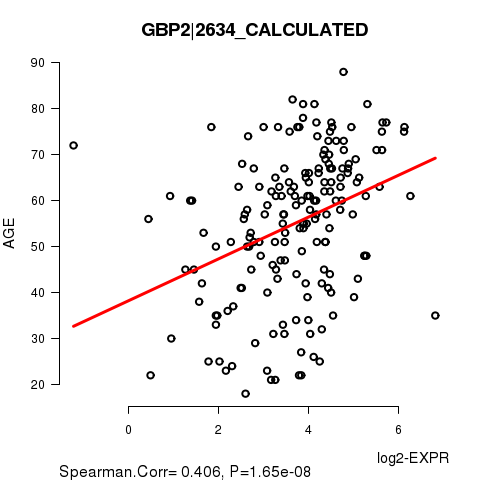
Table S5. Basic characteristics of clinical feature: 'GENDER'
| GENDER | Labels | N |
| FEMALE | 84 | |
| MALE | 95 | |
| Significant markers | N = 26 | |
| Higher in MALE | 13 | |
| Higher in FEMALE | 13 |
Table S6. Get Full Table List of top 10 genes differentially expressed by 'GENDER'
| T(pos if higher in 'MALE') | ttestP | Q | AUC | |
|---|---|---|---|---|
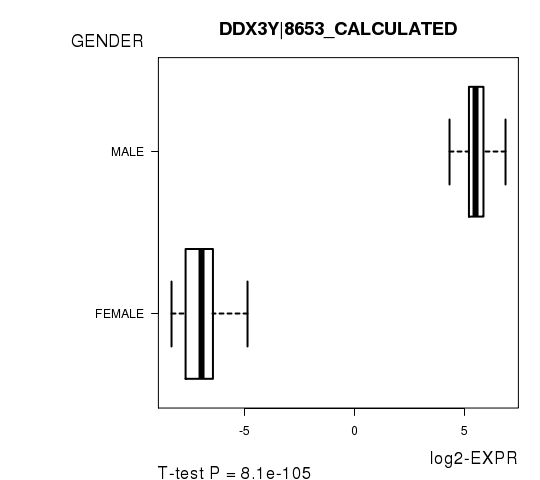
| DDX3Y|8653_CALCULATED | 79.24 | 8.103e-105 | 1.44e-100 | 1 |
| XIST|7503_CALCULATED | -47.03 | 1.56e-91 | 2.77e-87 | 0.9996 |
| TSIX|9383_CALCULATED | -45.22 | 1.205e-88 | 2.14e-84 | 0.9996 |
| ZFY|7544_CALCULATED | 49.96 | 3.073e-79 | 5.47e-75 | 1 |
| EIF1AY|9086_CALCULATED | 48.48 | 8.026e-62 | 1.43e-57 | 1 |
| PRKY|5616_CALCULATED | 37.28 | 9.451e-49 | 1.68e-44 | 1 |
| BCORP1|286554_CALCULATED | 36.82 | 2.503e-48 | 4.45e-44 | 1 |
| PRKX|5613_CALCULATED | -12.94 | 2.137e-27 | 3.8e-23 | 0.9145 |
| USP9Y|8287_CALCULATED | 43.12 | 3.196e-26 | 5.68e-22 | 1 |
| TMSB4Y|9087_CALCULATED | 28.93 | 1.063e-24 | 1.89e-20 | 0.9995 |
Figure S3. Get High-res Image As an example, this figure shows the association of DDX3Y|8653_CALCULATED to 'GENDER'. P value = 8.1e-105 with T-test analysis.
-
Expresson data file = LAML.mRNAseq_RPKM_log2.txt
-
Clinical data file = LAML.clin.merged.picked.txt
-
Number of patients = 179
-
Number of genes = 17799
-
Number of clinical features = 3
For survival clinical features, Wald's test in univariate Cox regression analysis with proportional hazards model (Andersen and Gill 1982) was used to estimate the P values using the 'coxph' function in R. Kaplan-Meier survival curves were plot using the four quartile subgroups of patients based on expression levels
For continuous numerical clinical features, Spearman's rank correlation coefficients (Spearman 1904) and two-tailed P values were estimated using 'cor.test' function in R
For two-class clinical features, two-tailed Student's t test with unequal variance (Lehmann and Romano 2005) was applied to compare the log2-expression levels between the two clinical classes using 't.test' function in R
For multiple hypothesis correction, Q value is the False Discovery Rate (FDR) analogue of the P value (Benjamini and Hochberg 1995), defined as the minimum FDR at which the test may be called significant. We used the 'Benjamini and Hochberg' method of 'p.adjust' function in R to convert P values into Q values.
This is an experimental feature. The full results of the analysis summarized in this report can be downloaded from the TCGA Data Coordination Center.