This pipeline uses various statistical tests to identify genes whose promoter methylation levels correlated to selected clinical features.
Testing the association between 20239 genes and 3 clinical features across 192 samples, statistically thresholded by Q value < 0.05, 2 clinical features related to at least one genes.
-
35 genes correlated to 'AGE'.
-
ETV1 , KIAA1377 , ANGPTL5 , AASS , TMEM20 , ...
-
7 genes correlated to 'GENDER'.
-
AP2B1 , KIF4B , DKFZP434L187 , MYO5A , DACH1 , ...
-
No genes correlated to 'Time to Death'
Complete statistical result table is provided in Supplement Table 1
Table 1. Get Full Table This table shows the clinical features, statistical methods used, and the number of genes that are significantly associated with each clinical feature at Q value < 0.05.
| Clinical feature | Statistical test | Significant genes | Associated with | Associated with | ||
|---|---|---|---|---|---|---|
| Time to Death | Cox regression test | N=0 | ||||
| AGE | Spearman correlation test | N=35 | older | N=3 | younger | N=32 |
| GENDER | t test | N=7 | male | N=3 | female | N=4 |
Table S1. Basic characteristics of clinical feature: 'Time to Death'
| Time to Death | Duration (Months) | 0.9-94.1 (median=12) |
| censored | N = 63 | |
| death | N = 103 | |
| Significant markers | N = 0 |
Table S2. Basic characteristics of clinical feature: 'AGE'
| AGE | Mean (SD) | 55.13 (16) |
| Significant markers | N = 35 | |
| pos. correlated | 3 | |
| neg. correlated | 32 |
Table S3. Get Full Table List of top 10 genes significantly correlated to 'AGE' by Spearman correlation test
| SpearmanCorr | corrP | Q | |
|---|---|---|---|
| ETV1 | -0.4366 | 2.447e-10 | 4.95e-06 |
| KIAA1377 | -0.4313 | 4.213e-10 | 8.53e-06 |
| ANGPTL5 | -0.4298 | 4.946e-10 | 1e-05 |
| AASS | -0.4264 | 6.957e-10 | 1.41e-05 |
| TMEM20 | -0.4239 | 8.951e-10 | 1.81e-05 |
| MYEF2 | -0.3908 | 2.089e-08 | 0.000423 |
| HCG4 | -0.3887 | 2.528e-08 | 0.000511 |
| HOOK1 | -0.3841 | 3.794e-08 | 0.000768 |
| TBC1D12 | -0.3797 | 5.58e-08 | 0.00113 |
| ENPP5 | -0.3673 | 1.598e-07 | 0.00323 |
Figure S1. Get High-res Image As an example, this figure shows the association of ETV1 to 'AGE'. P value = 2.45e-10 with Spearman correlation analysis. The straight line presents the best linear regression.
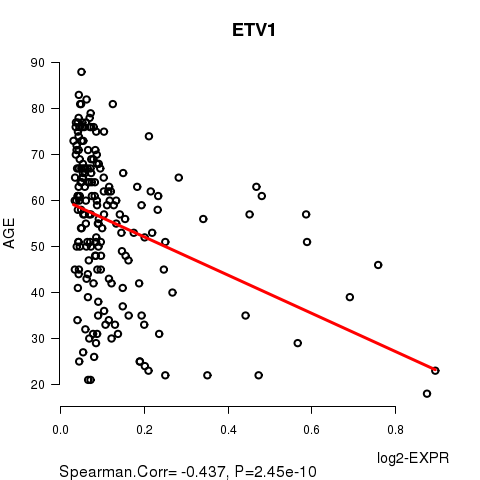
Table S4. Basic characteristics of clinical feature: 'GENDER'
| GENDER | Labels | N |
| FEMALE | 89 | |
| MALE | 103 | |
| Significant markers | N = 7 | |
| Higher in MALE | 3 | |
| Higher in FEMALE | 4 |
Table S5. Get Full Table List of 7 genes differentially expressed by 'GENDER'
| T(pos if higher in 'MALE') | ttestP | Q | AUC | |
|---|---|---|---|---|
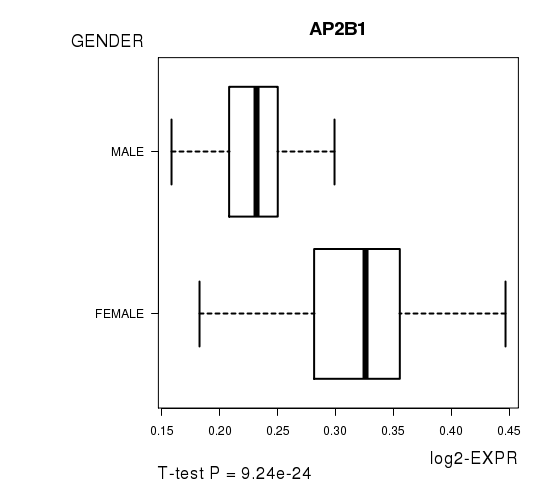
| AP2B1 | -11.96 | 9.237e-24 | 1.87e-19 | 0.9023 |
| KIF4B | -10.61 | 5.859e-21 | 1.19e-16 | 0.8587 |
| DKFZP434L187 | 9.15 | 1.114e-16 | 2.25e-12 | 0.86 |
| MYO5A | -6.88 | 1.117e-10 | 2.26e-06 | 0.8276 |
| DACH1 | 5.78 | 3.086e-08 | 0.000624 | 0.734 |
| RNASEH2C | 5.66 | 7.663e-08 | 0.00155 | 0.8014 |
| LOC100240735 | -5.17 | 5.978e-07 | 0.0121 | 0.7071 |
Figure S2. Get High-res Image As an example, this figure shows the association of AP2B1 to 'GENDER'. P value = 9.24e-24 with T-test analysis.
-
Expresson data file = LAML.meth.for_correlation.filtered_data.txt
-
Clinical data file = LAML.clin.merged.picked.txt
-
Number of patients = 192
-
Number of genes = 20239
-
Number of clinical features = 3
For survival clinical features, Wald's test in univariate Cox regression analysis with proportional hazards model (Andersen and Gill 1982) was used to estimate the P values using the 'coxph' function in R. Kaplan-Meier survival curves were plot using the four quartile subgroups of patients based on expression levels
For continuous numerical clinical features, Spearman's rank correlation coefficients (Spearman 1904) and two-tailed P values were estimated using 'cor.test' function in R
For two-class clinical features, two-tailed Student's t test with unequal variance (Lehmann and Romano 2005) was applied to compare the log2-expression levels between the two clinical classes using 't.test' function in R
For multiple hypothesis correction, Q value is the False Discovery Rate (FDR) analogue of the P value (Benjamini and Hochberg 1995), defined as the minimum FDR at which the test may be called significant. We used the 'Benjamini and Hochberg' method of 'p.adjust' function in R to convert P values into Q values.
This is an experimental feature. The full results of the analysis summarized in this report can be downloaded from the TCGA Data Coordination Center.