This pipeline computes the correlation between significantly recurrent gene mutations and selected clinical features.
Testing the association between mutation status of 48 genes and 3 clinical features across 199 patients, 6 significant findings detected with Q value < 0.25.
-
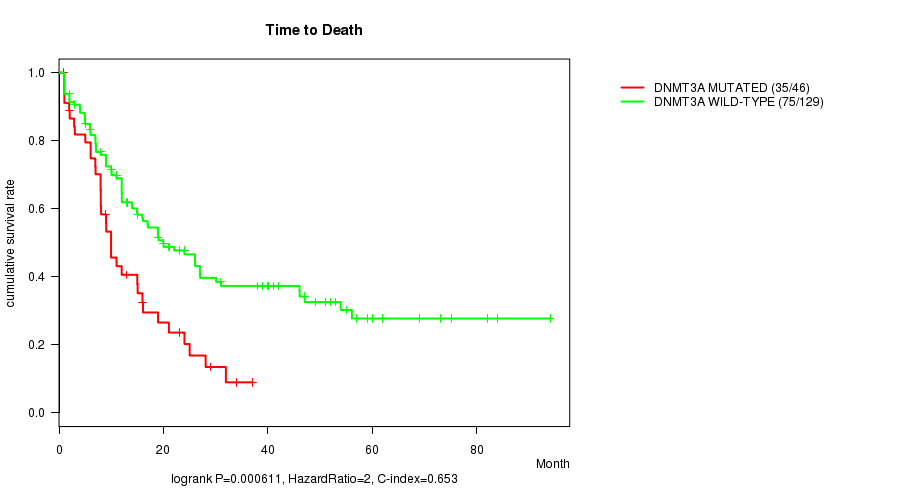
DNMT3A mutation correlated to 'Time to Death'.
-
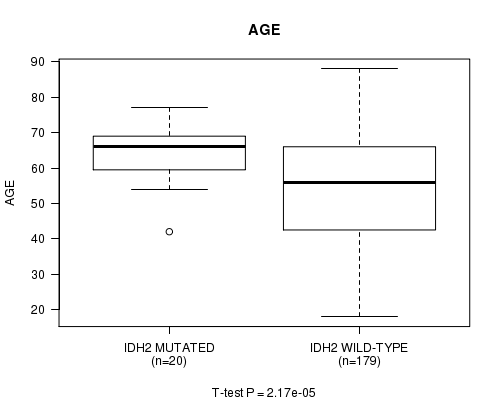
IDH2 mutation correlated to 'AGE'.
-
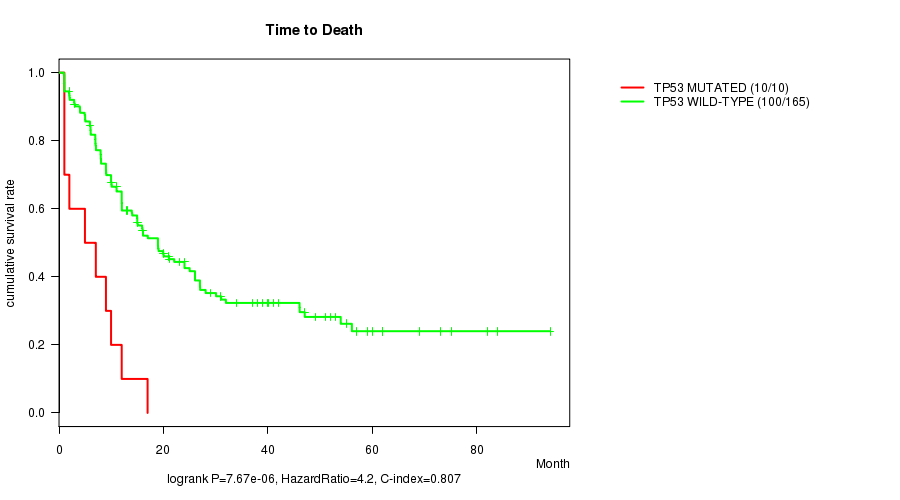
TP53 mutation correlated to 'Time to Death'.
-
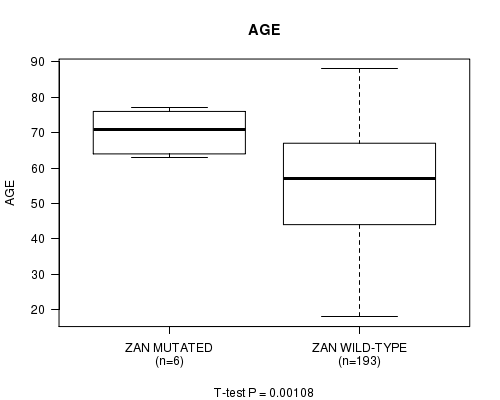
ZAN mutation correlated to 'AGE'.
-
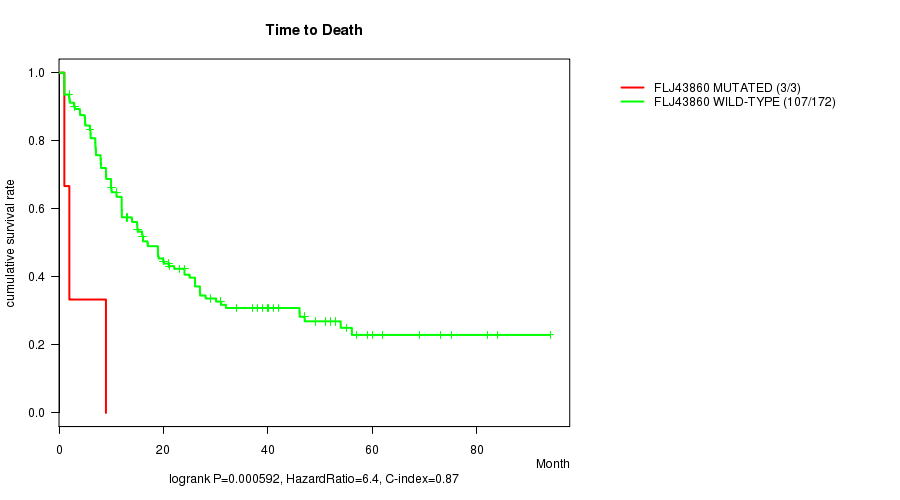
FLJ43860 mutation correlated to 'Time to Death'.
-
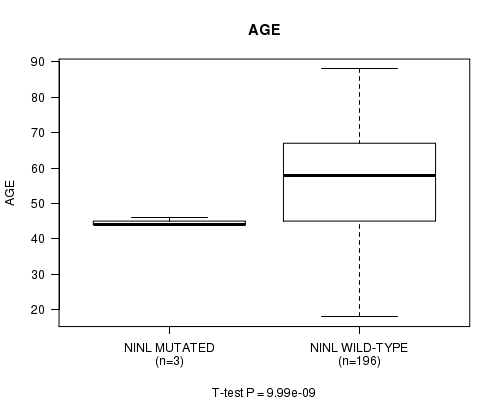
NINL mutation correlated to 'AGE'.
Table 1. Get Full Table Overview of the association between mutation status of 48 genes and 3 clinical features. Shown in the table are P values (Q values). Thresholded by Q value < 0.25, 6 significant findings detected.
|
Clinical Features |
Time to Death |
AGE | GENDER | ||
| nMutated (%) | nWild-Type | logrank test | t-test | Fisher's exact test | |
| DNMT3A | 50 (25%) | 149 |
0.000611 (0.0795) |
0.0569 (1.00) |
0.192 (1.00) |
| IDH2 | 20 (10%) | 179 |
0.629 (1.00) |
2.17e-05 (0.00287) |
0.814 (1.00) |
| TP53 | 11 (6%) | 188 |
7.67e-06 (0.00102) |
0.00316 (0.404) |
0.233 (1.00) |
| ZAN | 6 (3%) | 193 |
0.263 (1.00) |
0.00108 (0.139) |
0.0951 (1.00) |
| FLJ43860 | 3 (2%) | 196 |
0.000592 (0.0775) |
0.756 (1.00) |
0.252 (1.00) |
| NINL | 3 (2%) | 196 |
0.811 (1.00) |
9.99e-09 (1.34e-06) |
1 (1.00) |
| IDH1 | 20 (10%) | 179 |
0.932 (1.00) |
0.331 (1.00) |
0.479 (1.00) |
| U2AF1 | 10 (5%) | 189 |
0.459 (1.00) |
0.00364 (0.462) |
0.0228 (1.00) |
| KRAS | 9 (5%) | 190 |
0.587 (1.00) |
0.453 (1.00) |
0.306 (1.00) |
| TET2 | 15 (8%) | 184 |
0.865 (1.00) |
0.175 (1.00) |
0.289 (1.00) |
| FLT3 | 52 (26%) | 147 |
0.206 (1.00) |
0.352 (1.00) |
0.519 (1.00) |
| NPM1 | 47 (24%) | 152 |
0.222 (1.00) |
0.967 (1.00) |
0.136 (1.00) |
| NRAS | 18 (9%) | 181 |
0.875 (1.00) |
0.531 (1.00) |
0.625 (1.00) |
| OR5H6 | 4 (2%) | 195 |
0.0986 (1.00) |
0.334 (1.00) |
|
| RUNX1 | 17 (9%) | 182 |
0.233 (1.00) |
0.108 (1.00) |
0.802 (1.00) |
| WT1 | 13 (7%) | 186 |
0.672 (1.00) |
0.0301 (1.00) |
1 (1.00) |
| KIT | 7 (4%) | 192 |
0.901 (1.00) |
0.49 (1.00) |
0.705 (1.00) |
| PHF6 | 6 (3%) | 193 |
0.873 (1.00) |
0.232 (1.00) |
0.0323 (1.00) |
| AP3S1 | 3 (2%) | 196 |
0.74 (1.00) |
0.537 (1.00) |
0.594 (1.00) |
| SCRN3 | 3 (2%) | 196 |
0.0541 (1.00) |
0.594 (1.00) |
|
| MPRIP | 3 (2%) | 196 |
0.65 (1.00) |
1 (1.00) |
|
| CYP21A2 | 4 (2%) | 195 |
0.0181 (1.00) |
0.556 (1.00) |
1 (1.00) |
| PTPN11 | 7 (4%) | 192 |
0.37 (1.00) |
0.673 (1.00) |
1 (1.00) |
| ETV6 | 5 (3%) | 194 |
0.472 (1.00) |
0.276 (1.00) |
0.378 (1.00) |
| NFKBIZ | 3 (2%) | 196 |
0.0353 (1.00) |
0.0939 (1.00) |
|
| LILRA3 | 3 (2%) | 196 |
0.875 (1.00) |
0.594 (1.00) |
|
| C17ORF97 | 5 (3%) | 194 |
0.629 (1.00) |
0.406 (1.00) |
0.378 (1.00) |
| MUC4 | 7 (4%) | 192 |
0.149 (1.00) |
0.497 (1.00) |
1 (1.00) |
| SMC3 | 6 (3%) | 193 |
0.177 (1.00) |
0.589 (1.00) |
0.415 (1.00) |
| NOTCH2NL | 3 (2%) | 196 |
0.804 (1.00) |
0.252 (1.00) |
|
| FAM5C | 5 (3%) | 194 |
0.119 (1.00) |
0.045 (1.00) |
0.378 (1.00) |
| PRUNE2 | 6 (3%) | 193 |
0.418 (1.00) |
0.0919 (1.00) |
0.00834 (1.00) |
| SMC1A | 5 (3%) | 194 |
0.474 (1.00) |
0.0224 (1.00) |
0.378 (1.00) |
| ZNF275 | 3 (2%) | 196 |
0.0723 (1.00) |
0.594 (1.00) |
|
| C5ORF25 | 3 (2%) | 196 |
0.0889 (1.00) |
0.194 (1.00) |
0.0939 (1.00) |
| MAP3K4 | 4 (2%) | 195 |
0.236 (1.00) |
0.138 (1.00) |
0.334 (1.00) |
| CSPG4 | 3 (2%) | 196 |
0.179 (1.00) |
0.569 (1.00) |
0.594 (1.00) |
| TRIM48 | 3 (2%) | 196 |
0.204 (1.00) |
0.594 (1.00) |
|
| ASXL1 | 5 (3%) | 194 |
0.193 (1.00) |
0.0641 (1.00) |
0.662 (1.00) |
| CSMD1 | 6 (3%) | 193 |
0.384 (1.00) |
0.499 (1.00) |
1 (1.00) |
| CPAMD8 | 3 (2%) | 196 |
0.0723 (1.00) |
0.594 (1.00) |
|
| PKD1L2 | 4 (2%) | 195 |
0.00538 (0.678) |
0.851 (1.00) |
1 (1.00) |
| STAG2 | 4 (2%) | 195 |
0.396 (1.00) |
0.328 (1.00) |
0.334 (1.00) |
| EZH2 | 3 (2%) | 196 |
0.116 (1.00) |
1 (1.00) |
|
| OR11H12 | 3 (2%) | 196 |
0.531 (1.00) |
0.376 (1.00) |
0.594 (1.00) |
| ANKRD24 | 3 (2%) | 196 |
0.178 (1.00) |
0.757 (1.00) |
1 (1.00) |
| CCDC74A | 3 (2%) | 196 |
0.526 (1.00) |
0.349 (1.00) |
0.252 (1.00) |
| QRICH2 | 4 (2%) | 195 |
0.609 (1.00) |
0.0273 (1.00) |
1 (1.00) |
P value = 0.000611 (logrank test), Q value = 0.079
Table S1. Gene #5: 'DNMT3A MUTATION STATUS' versus Clinical Feature #1: 'Time to Death'
| nPatients | nDeath | Duration Range (Median), Month | |
|---|---|---|---|
| ALL | 175 | 110 | 0.9 - 94.1 (12.0) |
| DNMT3A MUTATED | 46 | 35 | 0.9 - 37.0 (9.0) |
| DNMT3A WILD-TYPE | 129 | 75 | 0.9 - 94.1 (15.0) |
Figure S1. Get High-res Image Gene #5: 'DNMT3A MUTATION STATUS' versus Clinical Feature #1: 'Time to Death'
P value = 2.17e-05 (t-test), Q value = 0.0029
Table S2. Gene #7: 'IDH2 MUTATION STATUS' versus Clinical Feature #2: 'AGE'
| nPatients | Mean (Std.Dev) | |
|---|---|---|
| ALL | 199 | 55.0 (16.1) |
| IDH2 MUTATED | 20 | 64.5 (8.0) |
| IDH2 WILD-TYPE | 179 | 54.0 (16.4) |
Figure S2. Get High-res Image Gene #7: 'IDH2 MUTATION STATUS' versus Clinical Feature #2: 'AGE'
P value = 7.67e-06 (logrank test), Q value = 0.001
Table S3. Gene #12: 'TP53 MUTATION STATUS' versus Clinical Feature #1: 'Time to Death'
| nPatients | nDeath | Duration Range (Median), Month | |
|---|---|---|---|
| ALL | 175 | 110 | 0.9 - 94.1 (12.0) |
| TP53 MUTATED | 10 | 10 | 1.0 - 17.0 (6.0) |
| TP53 WILD-TYPE | 165 | 100 | 0.9 - 94.1 (13.0) |
Figure S3. Get High-res Image Gene #12: 'TP53 MUTATION STATUS' versus Clinical Feature #1: 'Time to Death'
P value = 0.00108 (t-test), Q value = 0.14
Table S4. Gene #40: 'ZAN MUTATION STATUS' versus Clinical Feature #2: 'AGE'
| nPatients | Mean (Std.Dev) | |
|---|---|---|
| ALL | 199 | 55.0 (16.1) |
| ZAN MUTATED | 6 | 70.3 (6.7) |
| ZAN WILD-TYPE | 193 | 54.5 (16.1) |
Figure S4. Get High-res Image Gene #40: 'ZAN MUTATION STATUS' versus Clinical Feature #2: 'AGE'
P value = 0.000592 (logrank test), Q value = 0.078
Table S5. Gene #46: 'FLJ43860 MUTATION STATUS' versus Clinical Feature #1: 'Time to Death'
| nPatients | nDeath | Duration Range (Median), Month | |
|---|---|---|---|
| ALL | 175 | 110 | 0.9 - 94.1 (12.0) |
| FLJ43860 MUTATED | 3 | 3 | 1.0 - 9.0 (2.0) |
| FLJ43860 WILD-TYPE | 172 | 107 | 0.9 - 94.1 (12.5) |
Figure S5. Get High-res Image Gene #46: 'FLJ43860 MUTATION STATUS' versus Clinical Feature #1: 'Time to Death'
P value = 9.99e-09 (t-test), Q value = 1.3e-06
Table S6. Gene #48: 'NINL MUTATION STATUS' versus Clinical Feature #2: 'AGE'
| nPatients | Mean (Std.Dev) | |
|---|---|---|
| ALL | 199 | 55.0 (16.1) |
| NINL MUTATED | 3 | 44.7 (1.2) |
| NINL WILD-TYPE | 196 | 55.2 (16.2) |
Figure S6. Get High-res Image Gene #48: 'NINL MUTATION STATUS' versus Clinical Feature #2: 'AGE'
-
Mutation data file = LAML.mutsig.cluster.txt
-
Clinical data file = LAML.clin.merged.picked.txt
-
Number of patients = 199
-
Number of significantly mutated genes = 48
-
Number of selected clinical features = 3
-
Exclude genes that fewer than K tumors have mutations, K = 3
For survival clinical features, the Kaplan-Meier survival curves of tumors with and without gene mutations were plotted and the statistical significance P values were estimated by logrank test (Bland and Altman 2004) using the 'survdiff' function in R
For continuous numerical clinical features, two-tailed Student's t test with unequal variance (Lehmann and Romano 2005) was applied to compare the clinical values between tumors with and without gene mutations using 't.test' function in R
For binary or multi-class clinical features (nominal or ordinal), two-tailed Fisher's exact tests (Fisher 1922) were used to estimate the P values using the 'fisher.test' function in R
For multiple hypothesis correction, Q value is the False Discovery Rate (FDR) analogue of the P value (Benjamini and Hochberg 1995), defined as the minimum FDR at which the test may be called significant. We used the 'Benjamini and Hochberg' method of 'p.adjust' function in R to convert P values into Q values.
This is an experimental feature. The full results of the analysis summarized in this report can be downloaded from the TCGA Data Coordination Center.