This pipeline computes the correlation between significant arm-level copy number variations (cnvs) and selected clinical features.
Testing the association between copy number variation 45 arm-level results and 7 clinical features across 144 patients, 15 significant findings detected with Q value < 0.25.
-
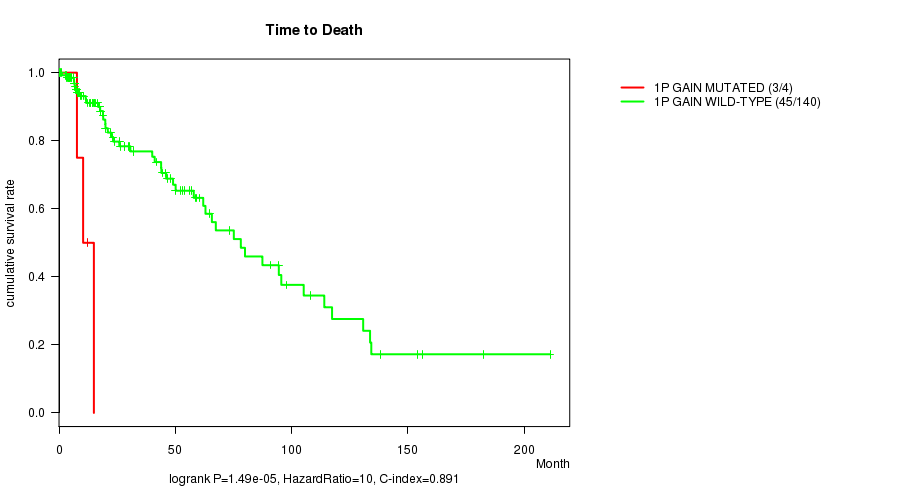
1p gain cnv correlated to 'Time to Death'.
-
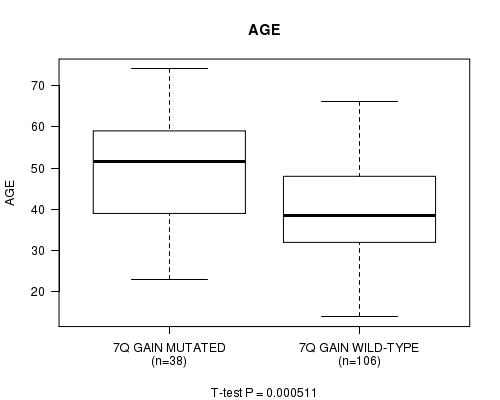
7q gain cnv correlated to 'AGE'.
-
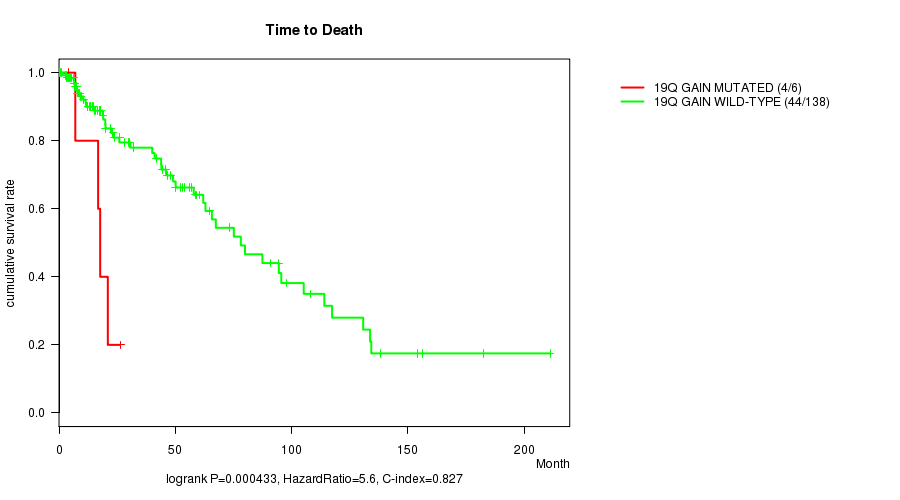
19q gain cnv correlated to 'Time to Death'.
-
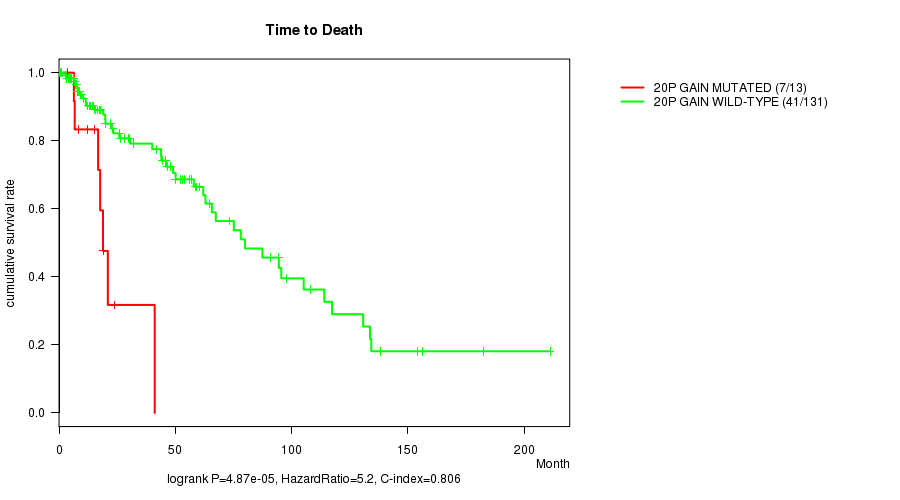
20p gain cnv correlated to 'Time to Death'.
-
20q gain cnv correlated to 'Time to Death'.
-
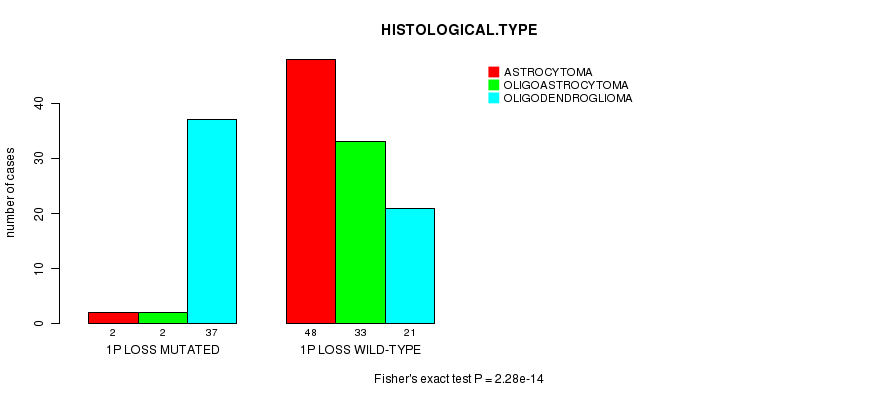
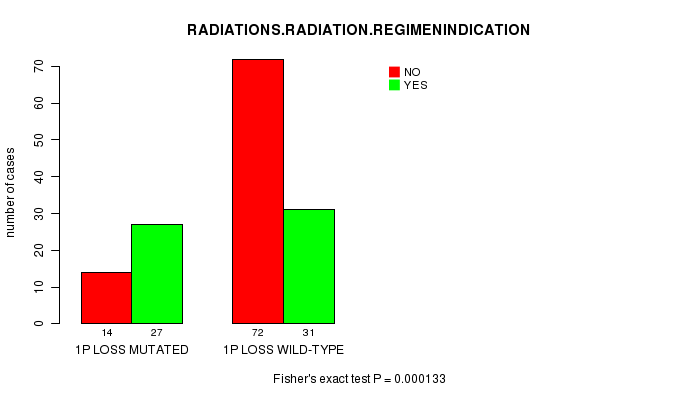
1p loss cnv correlated to 'HISTOLOGICAL.TYPE' and 'RADIATIONS.RADIATION.REGIMENINDICATION'.
-
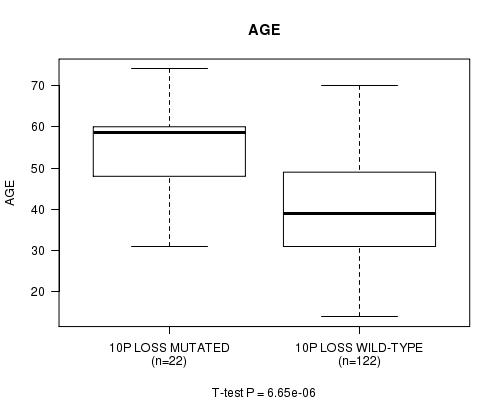
10p loss cnv correlated to 'Time to Death' and 'AGE'.
-
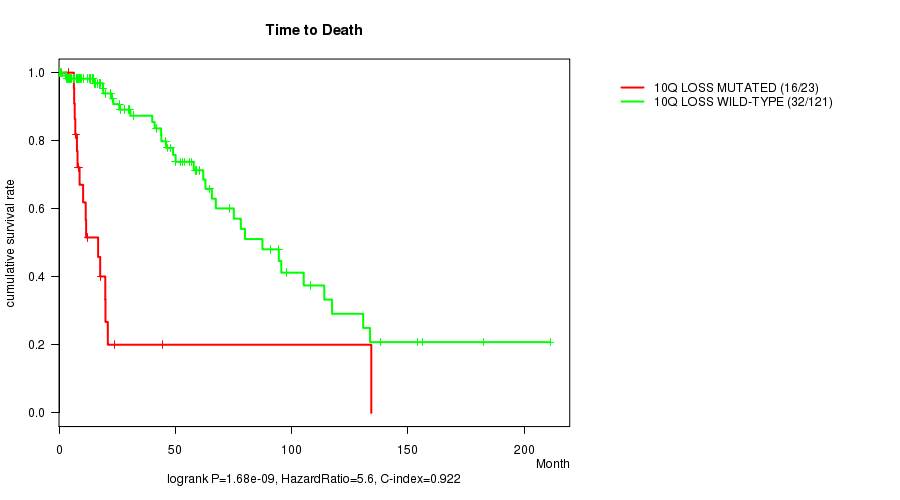
10q loss cnv correlated to 'Time to Death' and 'AGE'.
-
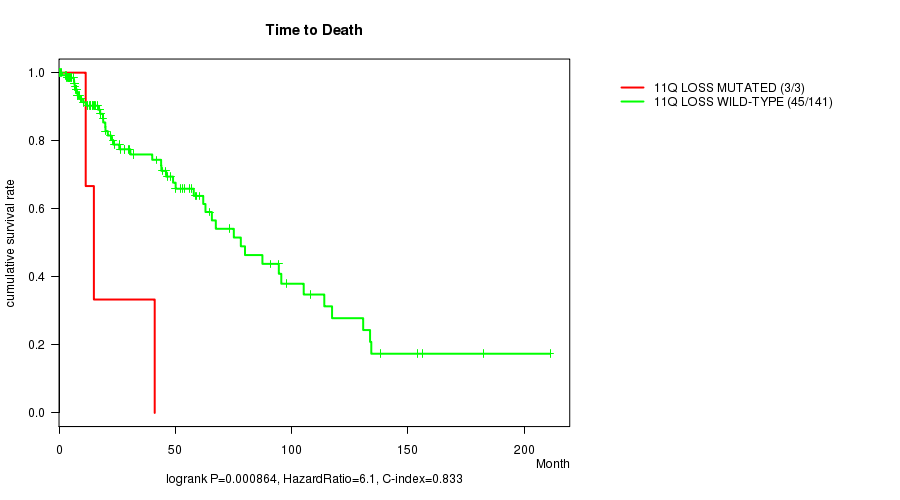
11q loss cnv correlated to 'Time to Death'.
-
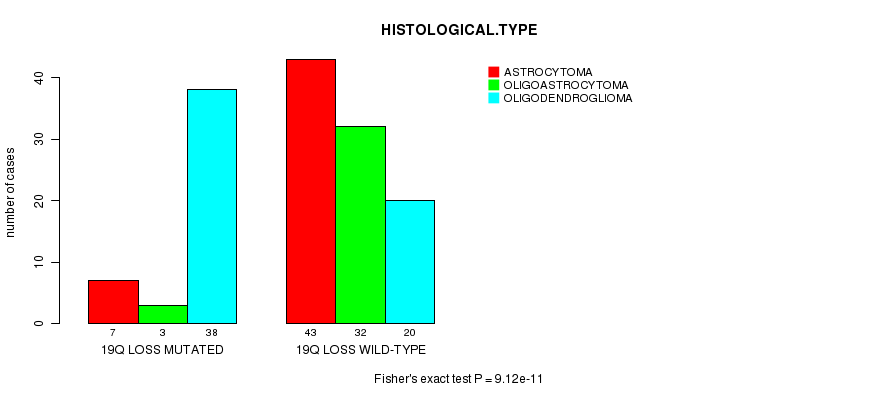
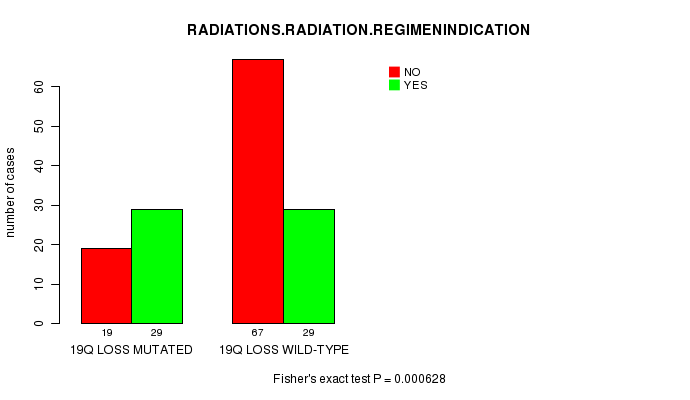
19q loss cnv correlated to 'HISTOLOGICAL.TYPE' and 'RADIATIONS.RADIATION.REGIMENINDICATION'.
-
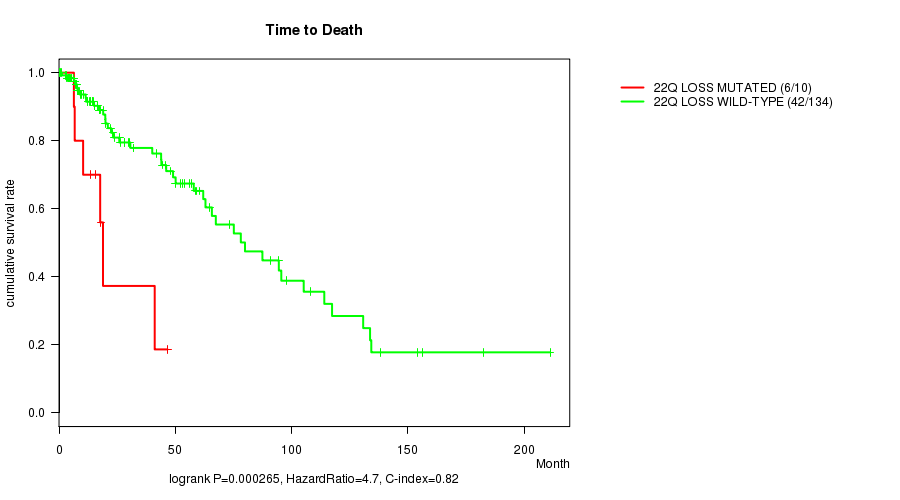
22q loss cnv correlated to 'Time to Death'.
Table 1. Get Full Table Overview of the association between significant copy number variation of 45 arm-level results and 7 clinical features. Shown in the table are P values (Q values). Thresholded by Q value < 0.25, 15 significant findings detected.
|
Clinical Features |
Time to Death |
AGE | GENDER |
KARNOFSKY PERFORMANCE SCORE |
HISTOLOGICAL TYPE |
RADIATIONS RADIATION REGIMENINDICATION |
NEOADJUVANT THERAPY |
||
| nCNV (%) | nWild-Type | logrank test | t-test | Fisher's exact test | t-test | Fisher's exact test | Fisher's exact test | Fisher's exact test | |
| 1p loss | 41 (28%) | 103 |
0.113 (1.00) |
0.0555 (1.00) |
0.71 (1.00) |
0.941 (1.00) |
2.28e-14 (6.83e-12) |
0.000133 (0.0385) |
1 (1.00) |
| 10p loss | 22 (15%) | 122 |
7.96e-10 (2.36e-07) |
6.65e-06 (0.00196) |
0.252 (1.00) |
0.441 (1.00) |
0.0238 (1.00) |
0.481 (1.00) |
0.648 (1.00) |
| 10q loss | 23 (16%) | 121 |
1.68e-09 (4.96e-07) |
3.26e-06 (0.000962) |
0.174 (1.00) |
0.473 (1.00) |
0.0119 (1.00) |
0.358 (1.00) |
0.501 (1.00) |
| 19q loss | 48 (33%) | 96 |
0.118 (1.00) |
0.154 (1.00) |
1 (1.00) |
0.985 (1.00) |
9.12e-11 (2.72e-08) |
0.000628 (0.179) |
0.48 (1.00) |
| 1p gain | 4 (3%) | 140 |
1.49e-05 (0.00436) |
0.0686 (1.00) |
0.315 (1.00) |
0.0169 (1.00) |
1 (1.00) |
0.363 (1.00) |
|
| 7q gain | 38 (26%) | 106 |
0.0137 (1.00) |
0.000511 (0.147) |
0.57 (1.00) |
0.649 (1.00) |
0.288 (1.00) |
0.249 (1.00) |
0.573 (1.00) |
| 19q gain | 6 (4%) | 138 |
0.000433 (0.125) |
0.0488 (1.00) |
0.236 (1.00) |
0.315 (1.00) |
0.382 (1.00) |
0.402 (1.00) |
0.681 (1.00) |
| 20p gain | 13 (9%) | 131 |
4.87e-05 (0.0142) |
0.0574 (1.00) |
0.559 (1.00) |
0.607 (1.00) |
0.12 (1.00) |
0.562 (1.00) |
0.778 (1.00) |
| 20q gain | 11 (8%) | 133 |
0.000109 (0.0317) |
0.111 (1.00) |
0.531 (1.00) |
0.458 (1.00) |
0.222 (1.00) |
1 (1.00) |
1 (1.00) |
| 11q loss | 3 (2%) | 141 |
0.000864 (0.246) |
0.193 (1.00) |
0.578 (1.00) |
0.0548 (1.00) |
0.273 (1.00) |
0.617 (1.00) |
|
| 22q loss | 10 (7%) | 134 |
0.000265 (0.0764) |
0.886 (1.00) |
0.745 (1.00) |
0.21 (1.00) |
0.00569 (1.00) |
0.524 (1.00) |
0.53 (1.00) |
| 1q gain | 6 (4%) | 138 |
0.142 (1.00) |
0.0366 (1.00) |
0.403 (1.00) |
0.457 (1.00) |
0.282 (1.00) |
1 (1.00) |
0.438 (1.00) |
| 7p gain | 28 (19%) | 116 |
0.01 (1.00) |
0.0289 (1.00) |
0.136 (1.00) |
0.745 (1.00) |
0.205 (1.00) |
0.0861 (1.00) |
0.834 (1.00) |
| 8p gain | 12 (8%) | 132 |
0.701 (1.00) |
0.935 (1.00) |
0.555 (1.00) |
0.511 (1.00) |
0.473 (1.00) |
0.123 (1.00) |
0.241 (1.00) |
| 8q gain | 15 (10%) | 129 |
0.933 (1.00) |
0.496 (1.00) |
1 (1.00) |
0.75 (1.00) |
0.193 (1.00) |
0.405 (1.00) |
0.181 (1.00) |
| 9p gain | 3 (2%) | 141 |
0.125 (1.00) |
0.0178 (1.00) |
0.578 (1.00) |
0.344 (1.00) |
1 (1.00) |
0.617 (1.00) |
|
| 9q gain | 3 (2%) | 141 |
0.0527 (1.00) |
0.23 (1.00) |
0.578 (1.00) |
0.0548 (1.00) |
0.273 (1.00) |
0.617 (1.00) |
|
| 10p gain | 17 (12%) | 127 |
0.513 (1.00) |
0.0081 (1.00) |
0.3 (1.00) |
0.179 (1.00) |
0.292 (1.00) |
0.433 (1.00) |
1 (1.00) |
| 11p gain | 7 (5%) | 137 |
0.575 (1.00) |
0.526 (1.00) |
1 (1.00) |
0.102 (1.00) |
0.485 (1.00) |
0.702 (1.00) |
0.272 (1.00) |
| 11q gain | 11 (8%) | 133 |
0.689 (1.00) |
0.32 (1.00) |
0.531 (1.00) |
0.479 (1.00) |
0.853 (1.00) |
1 (1.00) |
0.763 (1.00) |
| 12p gain | 7 (5%) | 137 |
0.49 (1.00) |
0.019 (1.00) |
0.0195 (1.00) |
0.791 (1.00) |
1 (1.00) |
0.442 (1.00) |
|
| 12q gain | 3 (2%) | 141 |
0.387 (1.00) |
0.00117 (0.332) |
0.259 (1.00) |
1 (1.00) |
0.565 (1.00) |
0.245 (1.00) |
|
| 18p gain | 3 (2%) | 141 |
0.522 (1.00) |
0.858 (1.00) |
0.578 (1.00) |
0.0548 (1.00) |
0.565 (1.00) |
0.617 (1.00) |
|
| 19p gain | 8 (6%) | 136 |
0.182 (1.00) |
0.00941 (1.00) |
0.466 (1.00) |
0.0931 (1.00) |
0.299 (1.00) |
0.144 (1.00) |
0.491 (1.00) |
| 21q gain | 4 (3%) | 140 |
0.298 (1.00) |
0.996 (1.00) |
0.634 (1.00) |
0.453 (1.00) |
0.648 (1.00) |
0.62 (1.00) |
|
| 1q loss | 7 (5%) | 137 |
0.495 (1.00) |
0.0302 (1.00) |
0.464 (1.00) |
0.128 (1.00) |
0.00279 (0.783) |
1 (1.00) |
1 (1.00) |
| 3q loss | 7 (5%) | 137 |
0.598 (1.00) |
0.954 (1.00) |
0.699 (1.00) |
0.513 (1.00) |
0.298 (1.00) |
1 (1.00) |
0.717 (1.00) |
| 4p loss | 13 (9%) | 131 |
0.119 (1.00) |
0.155 (1.00) |
0.152 (1.00) |
0.359 (1.00) |
0.0438 (1.00) |
0.139 (1.00) |
0.397 (1.00) |
| 4q loss | 21 (15%) | 123 |
0.0918 (1.00) |
0.914 (1.00) |
0.354 (1.00) |
0.36 (1.00) |
0.268 (1.00) |
0.0979 (1.00) |
0.244 (1.00) |
| 5p loss | 10 (7%) | 134 |
0.241 (1.00) |
0.915 (1.00) |
0.515 (1.00) |
0.181 (1.00) |
0.00665 (1.00) |
0.74 (1.00) |
0.53 (1.00) |
| 5q loss | 7 (5%) | 137 |
0.0143 (1.00) |
0.912 (1.00) |
0.464 (1.00) |
0.44 (1.00) |
0.612 (1.00) |
0.242 (1.00) |
1 (1.00) |
| 6q loss | 14 (10%) | 130 |
0.0087 (1.00) |
0.237 (1.00) |
0.274 (1.00) |
0.236 (1.00) |
0.00103 (0.293) |
0.00832 (1.00) |
0.272 (1.00) |
| 9p loss | 29 (20%) | 115 |
0.00682 (1.00) |
0.0728 (1.00) |
0.675 (1.00) |
0.9 (1.00) |
0.055 (1.00) |
0.00543 (1.00) |
0.148 (1.00) |
| 9q loss | 3 (2%) | 141 |
0.891 (1.00) |
0.0899 (1.00) |
0.578 (1.00) |
0.787 (1.00) |
0.565 (1.00) |
1 (1.00) |
|
| 11p loss | 15 (10%) | 129 |
0.0807 (1.00) |
0.139 (1.00) |
1 (1.00) |
0.939 (1.00) |
0.00672 (1.00) |
0.405 (1.00) |
0.79 (1.00) |
| 12q loss | 6 (4%) | 138 |
0.552 (1.00) |
0.618 (1.00) |
0.699 (1.00) |
0.195 (1.00) |
1 (1.00) |
0.681 (1.00) |
|
| 13q loss | 17 (12%) | 127 |
0.306 (1.00) |
0.672 (1.00) |
1 (1.00) |
0.428 (1.00) |
0.899 (1.00) |
0.189 (1.00) |
0.448 (1.00) |
| 14q loss | 16 (11%) | 128 |
0.00152 (0.43) |
0.194 (1.00) |
0.0339 (1.00) |
0.664 (1.00) |
0.123 (1.00) |
0.186 (1.00) |
0.792 (1.00) |
| 15q loss | 9 (6%) | 135 |
0.952 (1.00) |
0.865 (1.00) |
0.3 (1.00) |
0.047 (1.00) |
0.158 (1.00) |
0.743 (1.00) |
|
| 16q loss | 4 (3%) | 140 |
0.949 (1.00) |
0.176 (1.00) |
1 (1.00) |
0.827 (1.00) |
0.148 (1.00) |
1 (1.00) |
|
| 18p loss | 10 (7%) | 134 |
0.662 (1.00) |
0.657 (1.00) |
0.745 (1.00) |
0.399 (1.00) |
0.12 (1.00) |
1 (1.00) |
0.53 (1.00) |
| 18q loss | 12 (8%) | 132 |
0.248 (1.00) |
0.872 (1.00) |
0.363 (1.00) |
0.467 (1.00) |
0.0384 (1.00) |
0.762 (1.00) |
0.56 (1.00) |
| 19p loss | 5 (3%) | 139 |
0.677 (1.00) |
0.673 (1.00) |
1 (1.00) |
0.448 (1.00) |
0.392 (1.00) |
0.679 (1.00) |
|
| 21q loss | 5 (3%) | 139 |
0.955 (1.00) |
0.735 (1.00) |
1 (1.00) |
0.534 (1.00) |
1 (1.00) |
0.679 (1.00) |
|
| Xq loss | 3 (2%) | 141 |
0.294 (1.00) |
0.192 (1.00) |
1 (1.00) |
0.273 (1.00) |
0.617 (1.00) |
P value = 1.49e-05 (logrank test), Q value = 0.0044
Table S1. Gene #1: '1p gain mutation analysis' versus Clinical Feature #1: 'Time to Death'
| nPatients | nDeath | Duration Range (Median), Month | |
|---|---|---|---|
| ALL | 144 | 48 | 0.0 - 211.2 (18.0) |
| 1P GAIN MUTATED | 4 | 3 | 7.7 - 15.0 (11.4) |
| 1P GAIN WILD-TYPE | 140 | 45 | 0.0 - 211.2 (18.9) |
Figure S1. Get High-res Image Gene #1: '1p gain mutation analysis' versus Clinical Feature #1: 'Time to Death'
P value = 0.000511 (t-test), Q value = 0.15
Table S2. Gene #4: '7q gain mutation analysis' versus Clinical Feature #2: 'AGE'
| nPatients | Mean (Std.Dev) | |
|---|---|---|
| ALL | 144 | 42.7 (13.0) |
| 7Q GAIN MUTATED | 38 | 49.6 (14.0) |
| 7Q GAIN WILD-TYPE | 106 | 40.2 (11.7) |
Figure S2. Get High-res Image Gene #4: '7q gain mutation analysis' versus Clinical Feature #2: 'AGE'
P value = 0.000433 (logrank test), Q value = 0.12
Table S3. Gene #16: '19q gain mutation analysis' versus Clinical Feature #1: 'Time to Death'
| nPatients | nDeath | Duration Range (Median), Month | |
|---|---|---|---|
| ALL | 144 | 48 | 0.0 - 211.2 (18.0) |
| 19Q GAIN MUTATED | 6 | 4 | 4.1 - 26.3 (17.2) |
| 19Q GAIN WILD-TYPE | 138 | 44 | 0.0 - 211.2 (18.4) |
Figure S3. Get High-res Image Gene #16: '19q gain mutation analysis' versus Clinical Feature #1: 'Time to Death'
P value = 4.87e-05 (logrank test), Q value = 0.014
Table S4. Gene #17: '20p gain mutation analysis' versus Clinical Feature #1: 'Time to Death'
| nPatients | nDeath | Duration Range (Median), Month | |
|---|---|---|---|
| ALL | 144 | 48 | 0.0 - 211.2 (18.0) |
| 20P GAIN MUTATED | 13 | 7 | 3.8 - 41.1 (16.8) |
| 20P GAIN WILD-TYPE | 131 | 41 | 0.0 - 211.2 (19.0) |
Figure S4. Get High-res Image Gene #17: '20p gain mutation analysis' versus Clinical Feature #1: 'Time to Death'
P value = 0.000109 (logrank test), Q value = 0.032
Table S5. Gene #18: '20q gain mutation analysis' versus Clinical Feature #1: 'Time to Death'
| nPatients | nDeath | Duration Range (Median), Month | |
|---|---|---|---|
| ALL | 144 | 48 | 0.0 - 211.2 (18.0) |
| 20Q GAIN MUTATED | 11 | 6 | 4.7 - 41.1 (15.3) |
| 20Q GAIN WILD-TYPE | 133 | 42 | 0.0 - 211.2 (18.9) |
Figure S5. Get High-res Image Gene #18: '20q gain mutation analysis' versus Clinical Feature #1: 'Time to Death'

P value = 2.28e-14 (Fisher's exact test), Q value = 6.8e-12
Table S6. Gene #20: '1p loss mutation analysis' versus Clinical Feature #5: 'HISTOLOGICAL.TYPE'
| nPatients | ASTROCYTOMA | OLIGOASTROCYTOMA | OLIGODENDROGLIOMA |
|---|---|---|---|
| ALL | 50 | 35 | 58 |
| 1P LOSS MUTATED | 2 | 2 | 37 |
| 1P LOSS WILD-TYPE | 48 | 33 | 21 |
Figure S6. Get High-res Image Gene #20: '1p loss mutation analysis' versus Clinical Feature #5: 'HISTOLOGICAL.TYPE'
P value = 0.000133 (Fisher's exact test), Q value = 0.038
Table S7. Gene #20: '1p loss mutation analysis' versus Clinical Feature #6: 'RADIATIONS.RADIATION.REGIMENINDICATION'
| nPatients | NO | YES |
|---|---|---|
| ALL | 86 | 58 |
| 1P LOSS MUTATED | 14 | 27 |
| 1P LOSS WILD-TYPE | 72 | 31 |
Figure S7. Get High-res Image Gene #20: '1p loss mutation analysis' versus Clinical Feature #6: 'RADIATIONS.RADIATION.REGIMENINDICATION'
P value = 7.96e-10 (logrank test), Q value = 2.4e-07
Table S8. Gene #30: '10p loss mutation analysis' versus Clinical Feature #1: 'Time to Death'
| nPatients | nDeath | Duration Range (Median), Month | |
|---|---|---|---|
| ALL | 144 | 48 | 0.0 - 211.2 (18.0) |
| 10P LOSS MUTATED | 22 | 16 | 4.1 - 134.3 (10.9) |
| 10P LOSS WILD-TYPE | 122 | 32 | 0.0 - 211.2 (21.0) |
Figure S8. Get High-res Image Gene #30: '10p loss mutation analysis' versus Clinical Feature #1: 'Time to Death'

P value = 6.65e-06 (t-test), Q value = 0.002
Table S9. Gene #30: '10p loss mutation analysis' versus Clinical Feature #2: 'AGE'
| nPatients | Mean (Std.Dev) | |
|---|---|---|
| ALL | 144 | 42.7 (13.0) |
| 10P LOSS MUTATED | 22 | 54.6 (11.0) |
| 10P LOSS WILD-TYPE | 122 | 40.6 (12.2) |
Figure S9. Get High-res Image Gene #30: '10p loss mutation analysis' versus Clinical Feature #2: 'AGE'
P value = 1.68e-09 (logrank test), Q value = 5e-07
Table S10. Gene #31: '10q loss mutation analysis' versus Clinical Feature #1: 'Time to Death'
| nPatients | nDeath | Duration Range (Median), Month | |
|---|---|---|---|
| ALL | 144 | 48 | 0.0 - 211.2 (18.0) |
| 10Q LOSS MUTATED | 23 | 16 | 4.1 - 134.3 (11.5) |
| 10Q LOSS WILD-TYPE | 121 | 32 | 0.0 - 211.2 (22.1) |
Figure S10. Get High-res Image Gene #31: '10q loss mutation analysis' versus Clinical Feature #1: 'Time to Death'
P value = 3.26e-06 (t-test), Q value = 0.00096
Table S11. Gene #31: '10q loss mutation analysis' versus Clinical Feature #2: 'AGE'
| nPatients | Mean (Std.Dev) | |
|---|---|---|
| ALL | 144 | 42.7 (13.0) |
| 10Q LOSS MUTATED | 23 | 54.4 (10.8) |
| 10Q LOSS WILD-TYPE | 121 | 40.5 (12.2) |
Figure S11. Get High-res Image Gene #31: '10q loss mutation analysis' versus Clinical Feature #2: 'AGE'

P value = 0.000864 (logrank test), Q value = 0.25
Table S12. Gene #33: '11q loss mutation analysis' versus Clinical Feature #1: 'Time to Death'
| nPatients | nDeath | Duration Range (Median), Month | |
|---|---|---|---|
| ALL | 144 | 48 | 0.0 - 211.2 (18.0) |
| 11Q LOSS MUTATED | 3 | 3 | 11.5 - 41.1 (15.0) |
| 11Q LOSS WILD-TYPE | 141 | 45 | 0.0 - 211.2 (18.0) |
Figure S12. Get High-res Image Gene #33: '11q loss mutation analysis' versus Clinical Feature #1: 'Time to Death'
P value = 9.12e-11 (Fisher's exact test), Q value = 2.7e-08
Table S13. Gene #42: '19q loss mutation analysis' versus Clinical Feature #5: 'HISTOLOGICAL.TYPE'
| nPatients | ASTROCYTOMA | OLIGOASTROCYTOMA | OLIGODENDROGLIOMA |
|---|---|---|---|
| ALL | 50 | 35 | 58 |
| 19Q LOSS MUTATED | 7 | 3 | 38 |
| 19Q LOSS WILD-TYPE | 43 | 32 | 20 |
Figure S13. Get High-res Image Gene #42: '19q loss mutation analysis' versus Clinical Feature #5: 'HISTOLOGICAL.TYPE'
P value = 0.000628 (Fisher's exact test), Q value = 0.18
Table S14. Gene #42: '19q loss mutation analysis' versus Clinical Feature #6: 'RADIATIONS.RADIATION.REGIMENINDICATION'
| nPatients | NO | YES |
|---|---|---|
| ALL | 86 | 58 |
| 19Q LOSS MUTATED | 19 | 29 |
| 19Q LOSS WILD-TYPE | 67 | 29 |
Figure S14. Get High-res Image Gene #42: '19q loss mutation analysis' versus Clinical Feature #6: 'RADIATIONS.RADIATION.REGIMENINDICATION'
P value = 0.000265 (logrank test), Q value = 0.076
Table S15. Gene #44: '22q loss mutation analysis' versus Clinical Feature #1: 'Time to Death'
| nPatients | nDeath | Duration Range (Median), Month | |
|---|---|---|---|
| ALL | 144 | 48 | 0.0 - 211.2 (18.0) |
| 22Q LOSS MUTATED | 10 | 6 | 6.4 - 46.6 (16.8) |
| 22Q LOSS WILD-TYPE | 134 | 42 | 0.0 - 211.2 (19.0) |
Figure S15. Get High-res Image Gene #44: '22q loss mutation analysis' versus Clinical Feature #1: 'Time to Death'
-
Mutation data file = broad_values_by_arm.mutsig.cluster.txt
-
Clinical data file = LGG.clin.merged.picked.txt
-
Number of patients = 144
-
Number of significantly arm-level cnvs = 45
-
Number of selected clinical features = 7
-
Exclude genes that fewer than K tumors have mutations, K = 3
For survival clinical features, the Kaplan-Meier survival curves of tumors with and without gene mutations were plotted and the statistical significance P values were estimated by logrank test (Bland and Altman 2004) using the 'survdiff' function in R
For continuous numerical clinical features, two-tailed Student's t test with unequal variance (Lehmann and Romano 2005) was applied to compare the clinical values between tumors with and without gene mutations using 't.test' function in R
For binary or multi-class clinical features (nominal or ordinal), two-tailed Fisher's exact tests (Fisher 1922) were used to estimate the P values using the 'fisher.test' function in R
For multiple hypothesis correction, Q value is the False Discovery Rate (FDR) analogue of the P value (Benjamini and Hochberg 1995), defined as the minimum FDR at which the test may be called significant. We used the 'Benjamini and Hochberg' method of 'p.adjust' function in R to convert P values into Q values.
This is an experimental feature. The full results of the analysis summarized in this report can be downloaded from the TCGA Data Coordination Center.