This pipeline uses various statistical tests to identify mRNAs whose expression levels correlated to selected clinical features.
Testing the association between 18344 genes and 7 clinical features across 47 samples, statistically thresholded by Q value < 0.05, 3 clinical features related to at least one genes.
-
1 gene correlated to 'AGE'.
-
CDC42BPA|8476
-
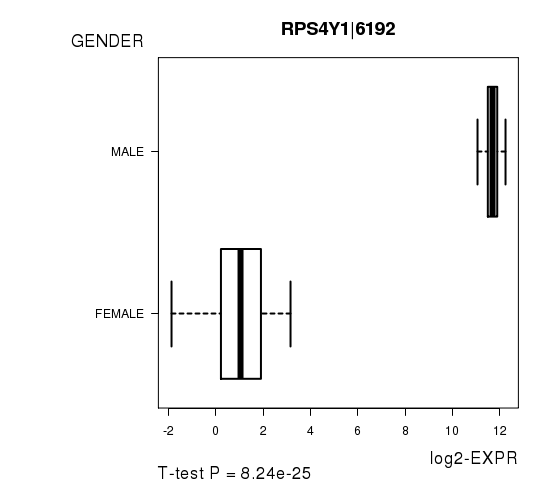
16 genes correlated to 'GENDER'.
-
RPS4Y1|6192 , ZFY|7544 , XIST|7503 , KDM5D|8284 , DDX3Y|8653 , ...
-
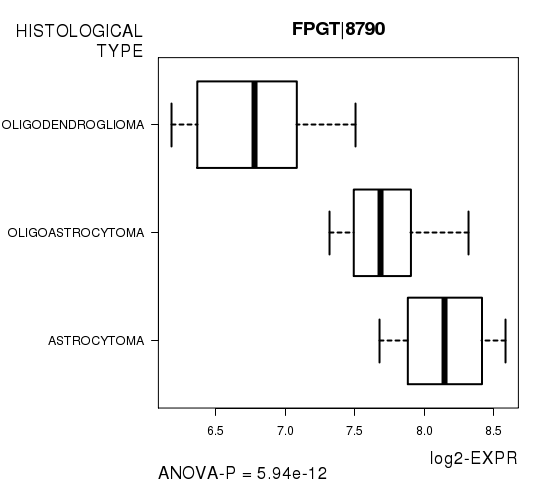
163 genes correlated to 'HISTOLOGICAL.TYPE'.
-
FPGT|8790 , ADPRHL2|54936 , MED8|112950 , ATG4C|84938 , PTP4A2|8073 , ...
-
No genes correlated to 'Time to Death', 'KARNOFSKY.PERFORMANCE.SCORE', 'RADIATIONS.RADIATION.REGIMENINDICATION', and 'NEOADJUVANT.THERAPY'.
Complete statistical result table is provided in Supplement Table 1
Table 1. Get Full Table This table shows the clinical features, statistical methods used, and the number of genes that are significantly associated with each clinical feature at Q value < 0.05.
| Clinical feature | Statistical test | Significant genes | Associated with | Associated with | ||
|---|---|---|---|---|---|---|
| Time to Death | Cox regression test | N=0 | ||||
| AGE | Spearman correlation test | N=1 | older | N=1 | younger | N=0 |
| GENDER | t test | N=16 | male | N=13 | female | N=3 |
| KARNOFSKY PERFORMANCE SCORE | Spearman correlation test | N=0 | ||||
| HISTOLOGICAL TYPE | ANOVA test | N=163 | ||||
| RADIATIONS RADIATION REGIMENINDICATION | t test | N=0 | ||||
| NEOADJUVANT THERAPY | t test | N=0 |
Table S1. Basic characteristics of clinical feature: 'Time to Death'
| Time to Death | Duration (Months) | 1.2-211.2 (median=31.8) |
| censored | N = 23 | |
| death | N = 24 | |
| Significant markers | N = 0 |
Table S2. Basic characteristics of clinical feature: 'AGE'
| AGE | Mean (SD) | 43.98 (12) |
| Significant markers | N = 1 | |
| pos. correlated | 1 | |
| neg. correlated | 0 |
Table S3. Get Full Table List of one gene significantly correlated to 'AGE' by Spearman correlation test
| SpearmanCorr | corrP | Q | |
|---|---|---|---|
| CDC42BPA|8476 | 0.6407 | 1.229e-06 | 0.0225 |
Figure S1. Get High-res Image As an example, this figure shows the association of CDC42BPA|8476 to 'AGE'. P value = 1.23e-06 with Spearman correlation analysis. The straight line presents the best linear regression.
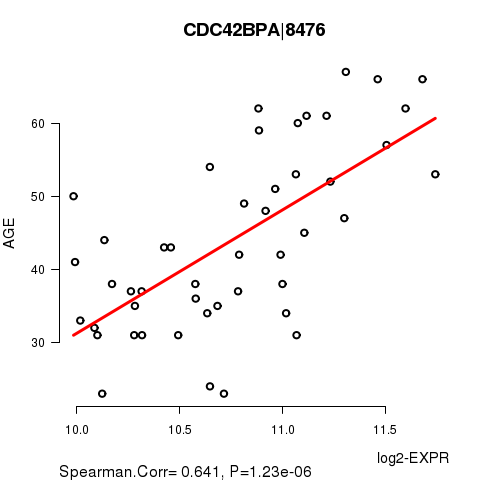
Table S4. Basic characteristics of clinical feature: 'GENDER'
| GENDER | Labels | N |
| FEMALE | 25 | |
| MALE | 22 | |
| Significant markers | N = 16 | |
| Higher in MALE | 13 | |
| Higher in FEMALE | 3 |
Table S5. Get Full Table List of top 10 genes differentially expressed by 'GENDER'
| T(pos if higher in 'MALE') | ttestP | Q | AUC | |
|---|---|---|---|---|
| RPS4Y1|6192 | 30.92 | 8.237e-25 | 1.51e-20 | 1 |
| ZFY|7544 | 37.26 | 1.634e-24 | 2.99e-20 | 1 |
| XIST|7503 | -21.86 | 9.377e-24 | 1.72e-19 | 1 |
| KDM5D|8284 | 46.31 | 1.118e-22 | 2.05e-18 | 1 |
| DDX3Y|8653 | 39 | 1.249e-20 | 2.29e-16 | 1 |
| PRKY|5616 | 17.52 | 1.55e-20 | 2.84e-16 | 1 |
| USP9Y|8287 | 36.25 | 3.803e-18 | 6.97e-14 | 1 |
| NLGN4Y|22829 | 18.19 | 3.656e-17 | 6.7e-13 | 1 |
| TSIX|9383 | -12.69 | 1.777e-15 | 3.26e-11 | 1 |
| TTTY15|64595 | 38.53 | 1.154e-12 | 2.12e-08 | 1 |
Figure S2. Get High-res Image As an example, this figure shows the association of RPS4Y1|6192 to 'GENDER'. P value = 8.24e-25 with T-test analysis.
No gene related to 'KARNOFSKY.PERFORMANCE.SCORE'.
Table S6. Basic characteristics of clinical feature: 'KARNOFSKY.PERFORMANCE.SCORE'
| KARNOFSKY.PERFORMANCE.SCORE | Mean (SD) | 89.63 (11) |
| Score | N | |
| 50 | 1 | |
| 70 | 1 | |
| 80 | 3 | |
| 90 | 14 | |
| 100 | 8 | |
| Significant markers | N = 0 |
Table S7. Basic characteristics of clinical feature: 'HISTOLOGICAL.TYPE'
| HISTOLOGICAL.TYPE | Labels | N |
| ASTROCYTOMA | 15 | |
| OLIGOASTROCYTOMA | 14 | |
| OLIGODENDROGLIOMA | 18 | |
| Significant markers | N = 163 |
Table S8. Get Full Table List of top 10 genes differentially expressed by 'HISTOLOGICAL.TYPE'
| ANOVA_P | Q | |
|---|---|---|
| FPGT|8790 | 5.938e-12 | 1.09e-07 |
| ADPRHL2|54936 | 1.402e-10 | 2.57e-06 |
| MED8|112950 | 1.71e-10 | 3.14e-06 |
| ATG4C|84938 | 1.072e-09 | 1.97e-05 |
| PTP4A2|8073 | 1.238e-09 | 2.27e-05 |
| MRPS15|64960 | 1.406e-09 | 2.58e-05 |
| C20ORF30|29058 | 2.397e-09 | 4.4e-05 |
| AK2|204 | 2.639e-09 | 4.84e-05 |
| C2ORF29|55571 | 2.856e-09 | 5.24e-05 |
| SDHAF1|644096 | 4.32e-09 | 7.92e-05 |
Figure S3. Get High-res Image As an example, this figure shows the association of FPGT|8790 to 'HISTOLOGICAL.TYPE'. P value = 5.94e-12 with ANOVA analysis.
No gene related to 'RADIATIONS.RADIATION.REGIMENINDICATION'.
Table S9. Basic characteristics of clinical feature: 'RADIATIONS.RADIATION.REGIMENINDICATION'
| RADIATIONS.RADIATION.REGIMENINDICATION | Labels | N |
| NO | 33 | |
| YES | 14 | |
| Significant markers | N = 0 |
-
Expresson data file = LGG.uncv2.mRNAseq_RSEM_normalized_log2.txt
-
Clinical data file = LGG.clin.merged.picked.txt
-
Number of patients = 47
-
Number of genes = 18344
-
Number of clinical features = 7
For survival clinical features, Wald's test in univariate Cox regression analysis with proportional hazards model (Andersen and Gill 1982) was used to estimate the P values using the 'coxph' function in R. Kaplan-Meier survival curves were plot using the four quartile subgroups of patients based on expression levels
For continuous numerical clinical features, Spearman's rank correlation coefficients (Spearman 1904) and two-tailed P values were estimated using 'cor.test' function in R
For two-class clinical features, two-tailed Student's t test with unequal variance (Lehmann and Romano 2005) was applied to compare the log2-expression levels between the two clinical classes using 't.test' function in R
For multi-class clinical features (ordinal or nominal), one-way analysis of variance (Howell 2002) was applied to compare the log2-expression levels between different clinical classes using 'anova' function in R
For multiple hypothesis correction, Q value is the False Discovery Rate (FDR) analogue of the P value (Benjamini and Hochberg 1995), defined as the minimum FDR at which the test may be called significant. We used the 'Benjamini and Hochberg' method of 'p.adjust' function in R to convert P values into Q values.
This is an experimental feature. The full results of the analysis summarized in this report can be downloaded from the TCGA Data Coordination Center.