This pipeline computes the correlation between significant arm-level copy number variations (cnvs) and selected clinical features.
Testing the association between copy number variation 61 arm-level results and 3 clinical features across 58 patients, 2 significant findings detected with Q value < 0.25.
-
18p loss cnv correlated to 'AGE'.
-
18q loss cnv correlated to 'AGE'.
Table 1. Get Full Table Overview of the association between significant copy number variation of 61 arm-level results and 3 clinical features. Shown in the table are P values (Q values). Thresholded by Q value < 0.25, 2 significant findings detected.
|
Clinical Features |
Time to Death |
AGE | GENDER | ||
| nCNV (%) | nWild-Type | logrank test | t-test | Fisher's exact test | |
| 18p loss | 7 (12%) | 51 |
0.0228 (1.00) |
0.000543 (0.0971) |
0.696 (1.00) |
| 18q loss | 9 (16%) | 49 |
0.207 (1.00) |
0.00106 (0.189) |
0.71 (1.00) |
| 1p gain | 9 (16%) | 49 |
0.816 (1.00) |
0.135 (1.00) |
1 (1.00) |
| 1q gain | 32 (55%) | 26 |
0.733 (1.00) |
0.709 (1.00) |
0.18 (1.00) |
| 2p gain | 8 (14%) | 50 |
0.749 (1.00) |
0.113 (1.00) |
0.124 (1.00) |
| 2q gain | 7 (12%) | 51 |
0.877 (1.00) |
0.223 (1.00) |
0.0864 (1.00) |
| 4p gain | 4 (7%) | 54 |
0.939 (1.00) |
0.456 (1.00) |
0.13 (1.00) |
| 5p gain | 18 (31%) | 40 |
0.295 (1.00) |
0.22 (1.00) |
1 (1.00) |
| 5q gain | 13 (22%) | 45 |
0.193 (1.00) |
0.195 (1.00) |
1 (1.00) |
| 6p gain | 13 (22%) | 45 |
0.186 (1.00) |
0.575 (1.00) |
0.751 (1.00) |
| 6q gain | 8 (14%) | 50 |
0.00649 (1.00) |
0.51 (1.00) |
0.698 (1.00) |
| 7p gain | 18 (31%) | 40 |
0.83 (1.00) |
0.545 (1.00) |
0.237 (1.00) |
| 7q gain | 19 (33%) | 39 |
0.843 (1.00) |
0.532 (1.00) |
0.254 (1.00) |
| 8p gain | 11 (19%) | 47 |
0.11 (1.00) |
0.581 (1.00) |
0.296 (1.00) |
| 8q gain | 29 (50%) | 29 |
0.26 (1.00) |
0.729 (1.00) |
0.585 (1.00) |
| 9p gain | 3 (5%) | 55 |
0.826 (1.00) |
0.547 (1.00) |
|
| 9q gain | 3 (5%) | 55 |
0.826 (1.00) |
0.547 (1.00) |
|
| 10p gain | 5 (9%) | 53 |
0.17 (1.00) |
0.385 (1.00) |
0.341 (1.00) |
| 12q gain | 3 (5%) | 55 |
0.898 (1.00) |
0.547 (1.00) |
|
| 15q gain | 5 (9%) | 53 |
0.822 (1.00) |
0.324 (1.00) |
0.341 (1.00) |
| 16p gain | 3 (5%) | 55 |
0.00854 (1.00) |
0.147 (1.00) |
1 (1.00) |
| 17p gain | 3 (5%) | 55 |
0.473 (1.00) |
0.708 (1.00) |
0.547 (1.00) |
| 17q gain | 16 (28%) | 42 |
0.0885 (1.00) |
0.864 (1.00) |
0.546 (1.00) |
| 18q gain | 3 (5%) | 55 |
0.931 (1.00) |
0.621 (1.00) |
1 (1.00) |
| 19p gain | 5 (9%) | 53 |
0.751 (1.00) |
0.622 (1.00) |
0.0528 (1.00) |
| 19q gain | 7 (12%) | 51 |
0.786 (1.00) |
0.826 (1.00) |
0.0864 (1.00) |
| 20p gain | 12 (21%) | 46 |
0.244 (1.00) |
0.0839 (1.00) |
0.32 (1.00) |
| 20q gain | 13 (22%) | 45 |
0.369 (1.00) |
0.0571 (1.00) |
0.515 (1.00) |
| 21q gain | 4 (7%) | 54 |
0.69 (1.00) |
0.616 (1.00) |
0.13 (1.00) |
| 22q gain | 6 (10%) | 52 |
0.165 (1.00) |
0.0665 (1.00) |
0.657 (1.00) |
| Xq gain | 4 (7%) | 54 |
0.233 (1.00) |
0.222 (1.00) |
1 (1.00) |
| 1p loss | 10 (17%) | 48 |
0.672 (1.00) |
0.54 (1.00) |
0.471 (1.00) |
| 1q loss | 3 (5%) | 55 |
0.857 (1.00) |
0.132 (1.00) |
1 (1.00) |
| 2q loss | 3 (5%) | 55 |
0.0103 (1.00) |
1 (1.00) |
|
| 3p loss | 5 (9%) | 53 |
0.731 (1.00) |
0.766 (1.00) |
0.341 (1.00) |
| 3q loss | 3 (5%) | 55 |
0.638 (1.00) |
0.235 (1.00) |
0.547 (1.00) |
| 4p loss | 9 (16%) | 49 |
0.517 (1.00) |
0.87 (1.00) |
1 (1.00) |
| 4q loss | 14 (24%) | 44 |
0.526 (1.00) |
0.768 (1.00) |
0.544 (1.00) |
| 5q loss | 4 (7%) | 54 |
0.00996 (1.00) |
0.956 (1.00) |
1 (1.00) |
| 6q loss | 9 (16%) | 49 |
0.253 (1.00) |
0.775 (1.00) |
0.262 (1.00) |
| 7p loss | 4 (7%) | 54 |
0.486 (1.00) |
0.665 (1.00) |
0.13 (1.00) |
| 7q loss | 7 (12%) | 51 |
0.944 (1.00) |
0.43 (1.00) |
0.241 (1.00) |
| 8p loss | 25 (43%) | 33 |
0.407 (1.00) |
0.544 (1.00) |
0.783 (1.00) |
| 8q loss | 7 (12%) | 51 |
0.652 (1.00) |
0.655 (1.00) |
0.696 (1.00) |
| 9p loss | 13 (22%) | 45 |
0.761 (1.00) |
0.391 (1.00) |
0.751 (1.00) |
| 9q loss | 11 (19%) | 47 |
0.621 (1.00) |
0.408 (1.00) |
0.729 (1.00) |
| 10p loss | 3 (5%) | 55 |
0.71 (1.00) |
0.029 (1.00) |
0.547 (1.00) |
| 10q loss | 12 (21%) | 46 |
0.525 (1.00) |
0.581 (1.00) |
0.741 (1.00) |
| 11p loss | 5 (9%) | 53 |
0.685 (1.00) |
0.276 (1.00) |
0.341 (1.00) |
| 11q loss | 8 (14%) | 50 |
0.252 (1.00) |
0.369 (1.00) |
1 (1.00) |
| 12p loss | 4 (7%) | 54 |
0.345 (1.00) |
0.547 (1.00) |
0.615 (1.00) |
| 12q loss | 3 (5%) | 55 |
0.365 (1.00) |
0.556 (1.00) |
0.547 (1.00) |
| 13q loss | 20 (34%) | 38 |
0.225 (1.00) |
0.157 (1.00) |
0.776 (1.00) |
| 14q loss | 19 (33%) | 39 |
0.672 (1.00) |
0.564 (1.00) |
0.569 (1.00) |
| 15q loss | 7 (12%) | 51 |
0.916 (1.00) |
0.365 (1.00) |
1 (1.00) |
| 16p loss | 11 (19%) | 47 |
0.397 (1.00) |
0.882 (1.00) |
1 (1.00) |
| 16q loss | 18 (31%) | 40 |
0.866 (1.00) |
0.896 (1.00) |
0.395 (1.00) |
| 17p loss | 24 (41%) | 34 |
0.23 (1.00) |
0.479 (1.00) |
0.786 (1.00) |
| 19p loss | 3 (5%) | 55 |
0.0697 (1.00) |
0.805 (1.00) |
0.547 (1.00) |
| 21q loss | 8 (14%) | 50 |
0.0767 (1.00) |
0.943 (1.00) |
0.0413 (1.00) |
| 22q loss | 9 (16%) | 49 |
0.617 (1.00) |
0.688 (1.00) |
0.0593 (1.00) |
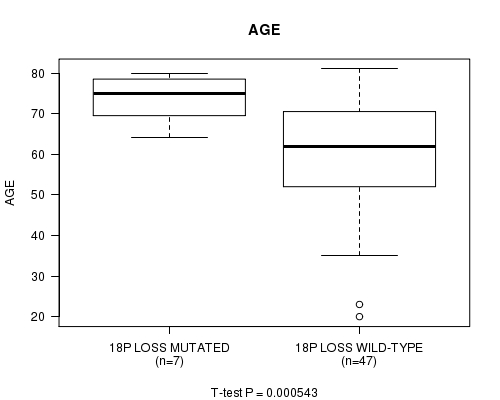
P value = 0.000543 (t-test), Q value = 0.097
Table S1. Gene #57: '18p loss mutation analysis' versus Clinical Feature #2: 'AGE'
| nPatients | Mean (Std.Dev) | |
|---|---|---|
| ALL | 54 | 61.8 (14.1) |
| 18P LOSS MUTATED | 7 | 73.6 (6.4) |
| 18P LOSS WILD-TYPE | 47 | 60.0 (14.2) |
Figure S1. Get High-res Image Gene #57: '18p loss mutation analysis' versus Clinical Feature #2: 'AGE'
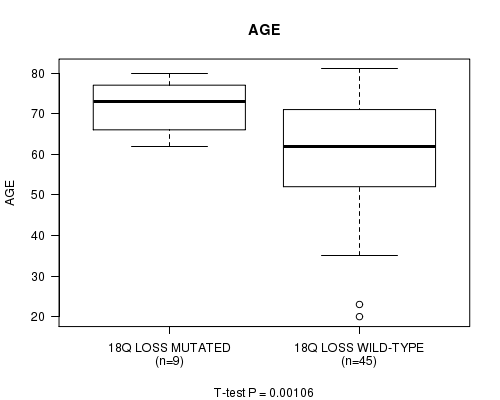
P value = 0.00106 (t-test), Q value = 0.19
Table S2. Gene #58: '18q loss mutation analysis' versus Clinical Feature #2: 'AGE'
| nPatients | Mean (Std.Dev) | |
|---|---|---|
| ALL | 54 | 61.8 (14.1) |
| 18Q LOSS MUTATED | 9 | 71.6 (6.9) |
| 18Q LOSS WILD-TYPE | 45 | 59.8 (14.4) |
Figure S2. Get High-res Image Gene #58: '18q loss mutation analysis' versus Clinical Feature #2: 'AGE'
-
Mutation data file = broad_values_by_arm.mutsig.cluster.txt
-
Clinical data file = LIHC.clin.merged.picked.txt
-
Number of patients = 58
-
Number of significantly arm-level cnvs = 61
-
Number of selected clinical features = 3
-
Exclude genes that fewer than K tumors have mutations, K = 3
For survival clinical features, the Kaplan-Meier survival curves of tumors with and without gene mutations were plotted and the statistical significance P values were estimated by logrank test (Bland and Altman 2004) using the 'survdiff' function in R
For continuous numerical clinical features, two-tailed Student's t test with unequal variance (Lehmann and Romano 2005) was applied to compare the clinical values between tumors with and without gene mutations using 't.test' function in R
For binary or multi-class clinical features (nominal or ordinal), two-tailed Fisher's exact tests (Fisher 1922) were used to estimate the P values using the 'fisher.test' function in R
For multiple hypothesis correction, Q value is the False Discovery Rate (FDR) analogue of the P value (Benjamini and Hochberg 1995), defined as the minimum FDR at which the test may be called significant. We used the 'Benjamini and Hochberg' method of 'p.adjust' function in R to convert P values into Q values.
This is an experimental feature. The full results of the analysis summarized in this report can be downloaded from the TCGA Data Coordination Center.