This report serves to describe the mutational landscape and properties of a given individual set, as well as rank genes and genesets according to mutational significance. MutSig v2.0 was used to generate the results found in this report.
Working with individual set: LUAD.
Number of patients in set: 229
The input for this pipeline is a set of individuals with the following files associated for each:
1. An annotated .maf file describing the mutations called for the respective individual, and their properties.
2. A .wig file that contains information about the coverage of the sample.
MAF used for this analysis: LUAD.final_analysis_set.maf
Significantly mutated genes (q ≤ 0.1): 251
Mutations seen in COSMIC: 515
Significantly mutated genes in COSMIC territory: 24
Genes with clustered mutations (≤ 3 aa apart): 0
Significantly mutated genesets: 16
Significantly mutated genesets: (excluding sig. mutated genes): 0
Read 229 MAFs of type "Broad"
Total number of mutations in input MAFs: 251233
After removing 79 mutations outside chr1-24: 251154
After removing 145352 noncoding mutations: 105802
After collapsing adjacent/redundant mutations: 94321
Number of mutations before filtering: 94321
After removing 1304 mutations outside gene set: 93017
After removing 401 mutations outside category set: 92616
Table 1. Get Full Table Table representing breakdown of mutations by type.
| type | count |
|---|---|
| Frame_Shift_Del | 1341 |
| Frame_Shift_Ins | 558 |
| In_Frame_Del | 200 |
| In_Frame_Ins | 27 |
| Missense_Mutation | 60650 |
| Nonsense_Mutation | 4843 |
| Nonstop_Mutation | 58 |
| Silent | 22937 |
| Splice_Site | 1868 |
| Translation_Start_Site | 134 |
| Total | 92616 |
Table 2. Get Full Table A breakdown of mutation rates per category discovered for this individual set.
| category | n | N | rate | rate_per_mb | relative_rate | exp_ns_s_ratio |
|---|---|---|---|---|---|---|
| *CpG->A | 8889 | 379287204 | 0.000023 | 23 | 2.3 | 2.1 |
| *Cp(A/C/T)->A | 22064 | 3108508517 | 7.1e-06 | 7.1 | 0.7 | 5 |
| C->(T/G) | 19000 | 3487795721 | 5.4e-06 | 5.4 | 0.53 | 2.8 |
| A->mut | 10782 | 3354933814 | 3.2e-06 | 3.2 | 0.32 | 3.9 |
| indel+null | 8797 | 6842729535 | 1.3e-06 | 1.3 | 0.13 | NaN |
| double_null | 147 | 6842729535 | 2.1e-08 | 0.021 | 0.0021 | NaN |
| Total | 69679 | 6842729535 | 1e-05 | 10 | 1 | 3.5 |
The x axis represents the samples. The y axis represents the exons, one row per exon, and they are sorted by average coverage across samples. For exons with exactly the same average coverage, they are sorted next by the %GC of the exon. (The secondary sort is especially useful for the zero-coverage exons at the bottom).
Figure 1.
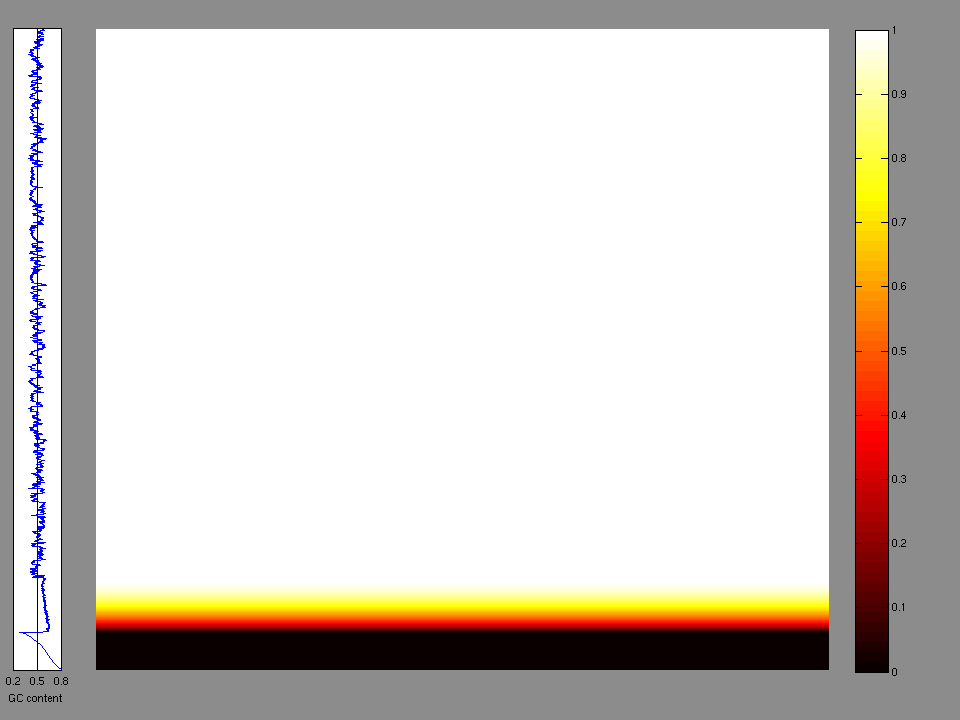
Figure 2. Patients counts and rates file used to generate this plot: LUAD.patients.counts_and_rates.txt
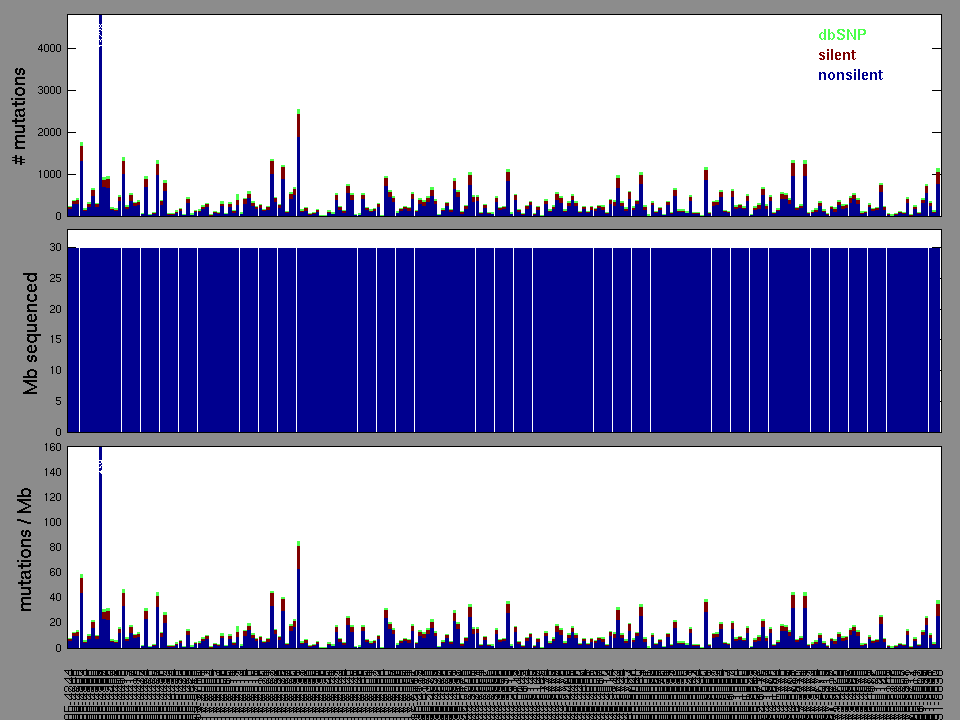
Figure 3. Get High-res Image The matrix in the center of the figure represents individual mutations in patient samples, color-coded by type of mutation, for the significantly mutated genes. The rate of synonymous and non-synonymous mutations is displayed at the top of the matrix. The barplot on the left of the matrix shows the number of mutations in each gene. The percentages represent the fraction of tumors with at least one mutation in the specified gene. The barplot to the right of the matrix displays the q-values for the most significantly mutated genes. The purple boxplots below the matrix (only displayed if required columns are present in the provided MAF) represent the distributions of allelic fractions observed in each sample. The plot at the bottom represents the base substitution distribution of individual samples, using the same categories that were used to calculate significance.
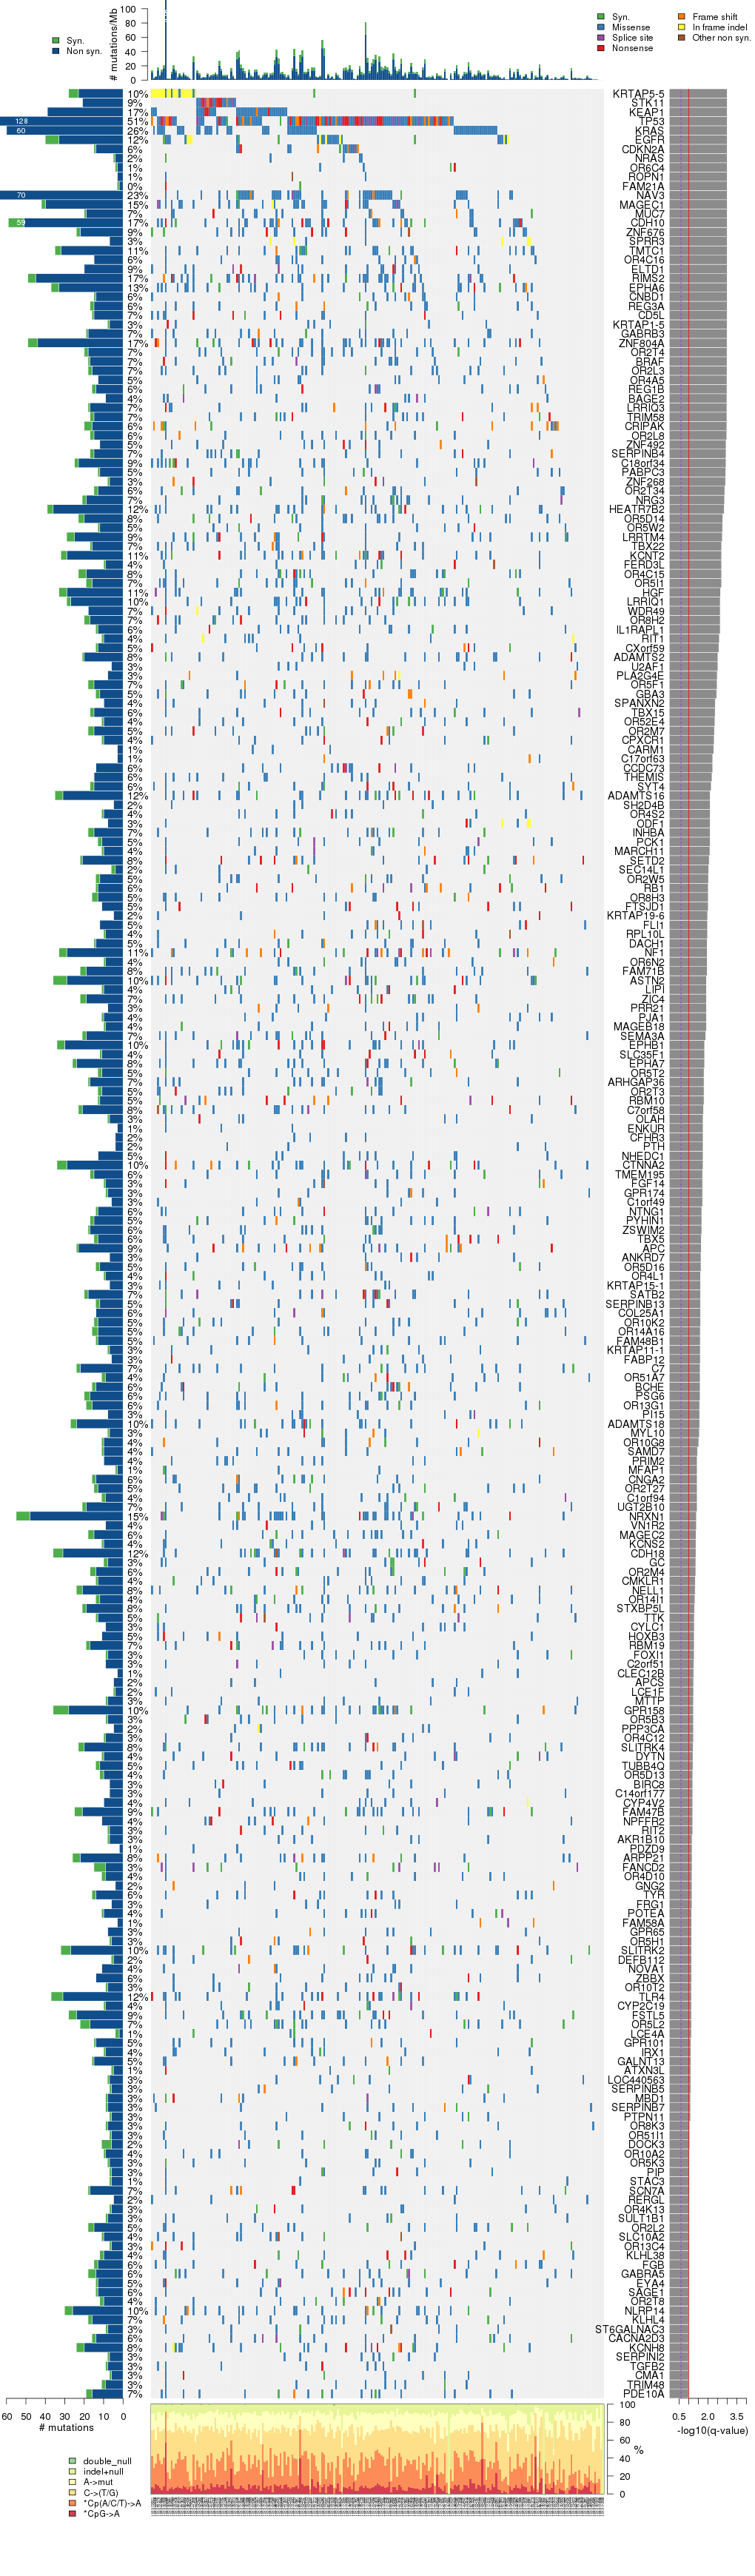
Table 3. Get Full Table A Ranked List of Significantly Mutated Genes. Number of significant genes found: 251. Number of genes displayed: 35. Click on a gene name to display its stick figure depicting the distribution of mutations and mutation types across the chosen gene (this feature may not be available for all significant genes).
| rank | gene | description | N | n | npat | nsite | nsil | n1 | n2 | n3 | n4 | n5 | n6 | p_classic | p_ns_s | p_ks | p_cons | p_joint | p | q |
|---|---|---|---|---|---|---|---|---|---|---|---|---|---|---|---|---|---|---|---|---|
| 1 | KRTAP5-5 | keratin associated protein 5-5 | 155262 | 23 | 23 | 6 | 5 | 1 | 3 | 0 | 0 | 19 | 0 | <1.00e-15 | 0.99 | 2e-07 | 1 | 0.000024 | <0.00 | <0.00 |
| 2 | STK11 | serine/threonine kinase 11 | 199230 | 21 | 20 | 20 | 0 | 0 | 4 | 2 | 4 | 11 | 0 | <1.00e-15 | 0.01 | 0.0013 | 0.012 | 0.0004 | <0.00 | <0.00 |
| 3 | KEAP1 | kelch-like ECH-associated protein 1 | 418841 | 39 | 39 | 37 | 0 | 4 | 8 | 13 | 10 | 4 | 0 | <1.00e-15 | 0.000026 | 0.05 | 0.0072 | 0.0057 | <2.22e-16 | <1.34e-12 |
| 4 | TP53 | tumor protein p53 | 288082 | 126 | 117 | 104 | 2 | 8 | 22 | 31 | 18 | 47 | 0 | <1.00e-15 | 1.2e-10 | 2e-07 | 2e-07 | 0 | <1.00e-15 | <1.64e-12 |
| 5 | KRAS | v-Ki-ras2 Kirsten rat sarcoma viral oncogene homolog | 161903 | 60 | 60 | 6 | 0 | 0 | 47 | 10 | 3 | 0 | 0 | <1.00e-15 | 0.002 | 2e-07 | 2e-07 | 0 | <1.00e-15 | <1.64e-12 |
| 6 | EGFR | epidermal growth factor receptor (erythroblastic leukemia viral (v-erb-b) oncogene homolog, avian) | 918061 | 33 | 27 | 19 | 7 | 2 | 5 | 4 | 13 | 9 | 0 | 3.60e-06 | 0.65 | 2e-07 | 0.0012 | 0 | <1.00e-15 | <1.64e-12 |
| 7 | CDKN2A | cyclin-dependent kinase inhibitor 2A (melanoma, p16, inhibits CDK4) | 226023 | 14 | 14 | 14 | 1 | 0 | 1 | 4 | 4 | 5 | 0 | 1.25e-09 | 0.26 | 9.6e-06 | 2e-07 | 0 | <1.00e-15 | <1.64e-12 |
| 8 | NRAS | neuroblastoma RAS viral (v-ras) oncogene homolog | 134194 | 4 | 4 | 2 | 1 | 0 | 1 | 0 | 3 | 0 | 0 | 0.0099 | 0.71 | 2e-07 | 0.19 | 0 | <1.00e-15 | <1.64e-12 |
| 9 | OR6C4 | olfactory receptor, family 6, subfamily C, member 4 | 213428 | 3 | 3 | 3 | 1 | 0 | 0 | 2 | 0 | 1 | 0 | 0.079 | 0.64 | 0.0028 | 0.00053 | 0 | <1.00e-15 | <1.64e-12 |
| 10 | ROPN1 | ropporin, rhophilin associated protein 1 | 139461 | 3 | 3 | 3 | 0 | 1 | 0 | 2 | 0 | 0 | 0 | 0.20 | 0.29 | 0.098 | 0.011 | 0 | <1.00e-15 | <1.64e-12 |
| 11 | FAM21A | family with sequence similarity 21, member A | 378995 | 2 | 1 | 2 | 1 | 1 | 0 | 0 | 0 | 1 | 0 | 0.91 | 0.73 | 0.013 | 0.38 | 0 | <1.00e-15 | <1.64e-12 |
| 12 | NAV3 | neuron navigator 3 | 1659792 | 66 | 52 | 66 | 4 | 4 | 36 | 16 | 6 | 3 | 1 | <1.00e-15 | 0.0026 | 0.32 | 0.48 | 0.4 | <1.47e-14 | <2.21e-11 |
| 13 | MAGEC1 | melanoma antigen family C, 1 | 774020 | 40 | 34 | 39 | 2 | 2 | 14 | 13 | 7 | 4 | 0 | 1.11e-15 | 0.0051 | 0.68 | 0.35 | 0.57 | 2.28e-14 | 3.17e-11 |
| 14 | MUC7 | mucin 7, secreted | 261518 | 19 | 17 | 19 | 1 | 0 | 8 | 3 | 5 | 3 | 0 | 5.82e-12 | 0.091 | 0.037 | 0.55 | 0.074 | 1.27e-11 | 1.64e-08 |
| 15 | CDH10 | cadherin 10, type 2 (T2-cadherin) | 552119 | 51 | 40 | 51 | 8 | 4 | 27 | 12 | 1 | 7 | 0 | 7.74e-13 | 0.27 | 0.82 | 0.44 | 0.77 | 1.75e-11 | 2.11e-08 |
| 16 | ZNF676 | zinc finger protein 676 | 407391 | 22 | 21 | 21 | 2 | 0 | 10 | 9 | 0 | 3 | 0 | 4.06e-10 | 0.25 | 0.0039 | 0.23 | 0.007 | 7.86e-11 | 8.89e-08 |
| 17 | SPRR3 | small proline-rich protein 3 | 117706 | 7 | 7 | 4 | 0 | 0 | 1 | 0 | 1 | 5 | 0 | 3.07e-09 | 0.62 | 0.0022 | 0.055 | 0.002 | 1.66e-10 | 1.69e-07 |
| 18 | TMTC1 | transmembrane and tetratricopeptide repeat containing 1 | 543417 | 32 | 26 | 30 | 3 | 3 | 17 | 7 | 3 | 2 | 0 | 1.55e-11 | 0.055 | 0.91 | 0.11 | 0.4 | 1.68e-10 | 1.69e-07 |
| 19 | OR4C16 | olfactory receptor, family 4, subfamily C, member 16 | 214115 | 15 | 14 | 14 | 0 | 0 | 9 | 2 | 3 | 1 | 0 | 2.63e-09 | 0.035 | 0.0019 | 0.17 | 0.0034 | 2.38e-10 | 2.27e-07 |
| 20 | ELTD1 | EGF, latrophilin and seven transmembrane domain containing 1 | 482503 | 20 | 20 | 20 | 0 | 0 | 4 | 4 | 8 | 4 | 0 | 2.78e-11 | 0.015 | 0.65 | 0.57 | 0.8 | 5.70e-10 | 5.16e-07 |
| 21 | RIMS2 | regulating synaptic membrane exocytosis 2 | 994318 | 45 | 39 | 45 | 4 | 4 | 16 | 10 | 8 | 7 | 0 | 4.13e-10 | 0.051 | 0.14 | 0.14 | 0.095 | 9.83e-10 | 8.47e-07 |
| 22 | EPHA6 | EPH receptor A6 | 755242 | 33 | 30 | 33 | 4 | 3 | 17 | 7 | 3 | 3 | 0 | 3.53e-09 | 0.17 | 0.27 | 0.0083 | 0.029 | 2.45e-09 | 2.01e-06 |
| 23 | CNBD1 | cyclic nucleotide binding domain containing 1 | 238160 | 14 | 14 | 14 | 1 | 0 | 5 | 3 | 4 | 2 | 0 | 1.70e-09 | 0.32 | 0.59 | 0.039 | 0.094 | 3.78e-09 | 2.97e-06 |
| 24 | REG3A | regenerating islet-derived 3 alpha | 125492 | 15 | 14 | 14 | 2 | 0 | 4 | 7 | 2 | 2 | 0 | 5.00e-10 | 0.25 | 0.31 | 0.54 | 0.48 | 5.56e-09 | 4.19e-06 |
| 25 | CD5L | CD5 molecule-like | 244572 | 15 | 15 | 15 | 1 | 3 | 3 | 0 | 5 | 4 | 0 | 5.46e-09 | 0.1 | 0.25 | 0.067 | 0.11 | 1.33e-08 | 9.50e-06 |
| 26 | KRTAP1-5 | keratin associated protein 1-5 | 121141 | 7 | 7 | 2 | 1 | 0 | 0 | 0 | 6 | 1 | 0 | 1.31e-06 | 0.64 | 0.0001 | 0.98 | 0.00047 | 1.37e-08 | 9.50e-06 |
| 27 | GABRB3 | gamma-aminobutyric acid (GABA) A receptor, beta 3 | 314646 | 18 | 17 | 18 | 1 | 3 | 6 | 4 | 4 | 1 | 0 | 7.80e-09 | 0.037 | 0.062 | 0.69 | 0.11 | 1.82e-08 | 0.000012 |
| 28 | ZNF804A | zinc finger protein 804A | 834934 | 44 | 38 | 44 | 5 | 0 | 26 | 8 | 4 | 6 | 0 | 1.09e-09 | 0.31 | 0.87 | 0.53 | 0.93 | 2.19e-08 | 0.000014 |
| 29 | OR2T4 | olfactory receptor, family 2, subfamily T, member 4 | 240679 | 18 | 17 | 18 | 2 | 1 | 7 | 8 | 2 | 0 | 0 | 8.15e-09 | 0.071 | 0.12 | 0.87 | 0.19 | 3.32e-08 | 0.000021 |
| 30 | BRAF | v-raf murine sarcoma viral oncogene homolog B1 | 510899 | 17 | 17 | 12 | 1 | 1 | 7 | 2 | 5 | 2 | 0 | 3.63e-08 | 0.096 | 0.023 | 0.34 | 0.049 | 3.73e-08 | 0.000022 |
| 31 | OR2L3 | olfactory receptor, family 2, subfamily L, member 3 | 215947 | 16 | 15 | 16 | 2 | 1 | 9 | 2 | 4 | 0 | 0 | 3.05e-09 | 0.19 | 0.33 | 0.68 | 0.59 | 3.79e-08 | 0.000022 |
| 32 | OR4A5 | olfactory receptor, family 4, subfamily A, member 5 | 218008 | 13 | 12 | 13 | 0 | 1 | 4 | 3 | 4 | 1 | 0 | 3.29e-09 | 0.035 | 0.28 | 0.64 | 0.63 | 4.37e-08 | 0.000025 |
| 33 | REG1B | regenerating islet-derived 1 beta (pancreatic stone protein, pancreatic thread protein) | 119309 | 14 | 13 | 14 | 2 | 1 | 7 | 1 | 3 | 2 | 0 | 2.00e-08 | 0.39 | 0.5 | 0.04 | 0.11 | 4.69e-08 | 0.000026 |
| 34 | BAGE2 | B melanoma antigen family, member 2 | 79234 | 9 | 9 | 9 | 0 | 0 | 4 | 2 | 1 | 2 | 0 | 4.26e-09 | 0.12 | 0.86 | 0.44 | 0.73 | 6.38e-08 | 0.000034 |
| 35 | LRRIQ3 | 435787 | 17 | 15 | 16 | 1 | 1 | 3 | 3 | 5 | 5 | 0 | 3.38e-09 | 0.26 | 0.82 | 0.85 | 0.96 | 6.66e-08 | 0.000034 |
Note:
N - number of sequenced bases in this gene across the individual set.
n - number of (nonsilent) mutations in this gene across the individual set.
npat - number of patients (individuals) with at least one nonsilent mutation.
nsite - number of unique sites having a non-silent mutation.
nsil - number of silent mutations in this gene across the individual set.
n1 - number of nonsilent mutations of type: *CpG->A .
n2 - number of nonsilent mutations of type: *Cp(A/C/T)->A .
n3 - number of nonsilent mutations of type: C->(T/G) .
n4 - number of nonsilent mutations of type: A->mut .
n5 - number of nonsilent mutations of type: indel+null .
null - mutation category that includes nonsense, frameshift, splice-site mutations
p_classic = p-value for the observed amount of nonsilent mutations being elevated in this gene
p_ns_s = p-value for the observed nonsilent/silent ratio being elevated in this gene
p = p-value (overall)
q = q-value, False Discovery Rate (Benjamini-Hochberg procedure)
In this analysis, COSMIC is used as a filter to increase power by restricting the territory of each gene. Cosmic version: v48.
Table 4. Get Full Table Significantly mutated genes (COSMIC territory only). To access the database please go to: COSMIC. Number of significant genes found: 24. Number of genes displayed: 10
| rank | gene | description | n | cos | n_cos | N_cos | cos_ev | p | q |
|---|---|---|---|---|---|---|---|---|---|
| 1 | LRP1B | low density lipoprotein-related protein 1B (deleted in tumors) | 149 | 18 | 8 | 4122 | 8 | 3.9e-14 | 1.8e-10 |
| 2 | KRAS | v-Ki-ras2 Kirsten rat sarcoma viral oncogene homolog | 60 | 51 | 60 | 11679 | 797017 | 1e-13 | 2.3e-10 |
| 3 | BRAF | v-raf murine sarcoma viral oncogene homolog B1 | 17 | 88 | 12 | 20152 | 21212 | 1.6e-13 | 2.4e-10 |
| 4 | STK11 | serine/threonine kinase 11 | 21 | 130 | 14 | 29770 | 27 | 2.2e-13 | 2.5e-10 |
| 5 | EGFR | epidermal growth factor receptor (erythroblastic leukemia viral (v-erb-b) oncogene homolog, avian) | 33 | 218 | 29 | 49922 | 10294 | 3e-13 | 2.6e-10 |
| 6 | TP53 | tumor protein p53 | 126 | 308 | 121 | 70532 | 18205 | 3.4e-13 | 2.6e-10 |
| 7 | CDKN2A | cyclin-dependent kinase inhibitor 2A (melanoma, p16, inhibits CDK4) | 14 | 315 | 14 | 72135 | 259 | 4.2e-13 | 2.7e-10 |
| 8 | MET | met proto-oncogene (hepatocyte growth factor receptor) | 12 | 33 | 6 | 7557 | 64 | 2.7e-10 | 1.5e-07 |
| 9 | PIK3CA | phosphoinositide-3-kinase, catalytic, alpha polypeptide | 11 | 184 | 9 | 42136 | 3946 | 9.2e-10 | 4.6e-07 |
| 10 | NF1 | neurofibromin 1 (neurofibromatosis, von Recklinghausen disease, Watson disease) | 29 | 285 | 9 | 65265 | 13 | 3.8e-08 | 0.000017 |
Note:
n - number of (nonsilent) mutations in this gene across the individual set.
cos = number of unique mutated sites in this gene in COSMIC
n_cos = overlap between n and cos.
N_cos = number of individuals times cos.
cos_ev = total evidence: number of reports in COSMIC for mutations seen in this gene.
p = p-value for seeing the observed amount of overlap in this gene)
q = q-value, False Discovery Rate (Benjamini-Hochberg procedure)
There were no clustered mutations discovered.
Table 5. Get Full Table A Ranked List of Significantly Mutated Genesets. (Source: MSigDB GSEA Cannonical Pathway Set).Number of significant genesets found: 16. Number of genesets displayed: 10
| rank | geneset | description | genes | N_genes | mut_tally | N | n | npat | nsite | nsil | n1 | n2 | n3 | n4 | n5 | n6 | p_ns_s | p | q |
|---|---|---|---|---|---|---|---|---|---|---|---|---|---|---|---|---|---|---|---|
| 1 | G2PATHWAY | Activated Cdc2-cyclin B kinase regulates the G2/M transition; DNA damage stimulates the DNA-PK/ATM/ATR kinases, which inactivate Cdc2. | ATM, ATR, BRCA1, CCNB1, CDC2, CDC25A, CDC25B, CDC25C, CDC34, CDKN1A, CDKN2D, CHEK1, CHEK2, EP300, GADD45A, MDM2, MYT1, PLK, PRKDC, RPS6KA1, TP53, WEE1, YWHAH, YWHAQ | 22 | ATM(22), ATR(17), BRCA1(9), CCNB1(1), CDC25A(4), CDC25B(1), CDC25C(3), CDC34(1), CDKN1A(1), CDKN2D(1), CHEK1(6), CHEK2(2), EP300(2), GADD45A(1), MDM2(2), MYT1(6), PRKDC(23), RPS6KA1(1), TP53(126), WEE1(3) | 14627375 | 232 | 149 | 209 | 23 | 16 | 52 | 61 | 35 | 68 | 0 | 5.8e-06 | <1.00e-15 | <5.60e-14 |
| 2 | P53PATHWAY | p53 induces cell cycle arrest or apoptosis under conditions of DNA damage. | APAF1, ATM, BAX, BCL2, CCND1, CCNE1, CDK2, CDK4, CDKN1A, E2F1, GADD45A, MDM2, PCNA, RB1, TIMP3, TP53 | 16 | APAF1(8), ATM(22), BAX(1), BCL2(1), CCND1(2), CCNE1(3), CDK2(4), CDK4(2), CDKN1A(1), E2F1(3), GADD45A(1), MDM2(2), PCNA(1), RB1(13), TP53(126) | 6266585 | 190 | 141 | 167 | 16 | 16 | 37 | 42 | 29 | 66 | 0 | 1.9e-06 | <1.00e-15 | <5.60e-14 |
| 3 | ATMPATHWAY | The tumor-suppressing protein kinase ATM responds to radiation-induced DNA damage by blocking cell-cycle progression and activating DNA repair. | ABL1, ATM, BRCA1, CDKN1A, CHEK1, CHEK2, GADD45A, JUN, MAPK8, MDM2, MRE11A, NBS1, NFKB1, NFKBIA, RAD50, RAD51, RBBP8, RELA, TP53, TP73 | 19 | ABL1(2), ATM(22), BRCA1(9), CDKN1A(1), CHEK1(6), CHEK2(2), GADD45A(1), MAPK8(3), MDM2(2), MRE11A(6), NFKB1(3), NFKBIA(1), RAD50(3), RAD51(1), RBBP8(3), TP53(126), TP73(4) | 10278207 | 195 | 138 | 172 | 16 | 15 | 41 | 53 | 28 | 58 | 0 | 1.7e-06 | <1.00e-15 | <5.60e-14 |
| 4 | RBPATHWAY | The ATM protein kinase recognizes DNA damage and blocks cell cycle progression by phosphorylating chk1 and p53, which normally inhibits Rb to allow G1/S transitions. | ATM, CDC2, CDC25A, CDC25B, CDC25C, CDK2, CDK4, CHEK1, MYT1, RB1, TP53, WEE1, YWHAH | 12 | ATM(22), CDC25A(4), CDC25B(1), CDC25C(3), CDK2(4), CDK4(2), CHEK1(6), MYT1(6), RB1(13), TP53(126), WEE1(3) | 6070332 | 190 | 138 | 167 | 13 | 15 | 37 | 43 | 29 | 66 | 0 | 1.6e-07 | <1.00e-15 | <5.60e-14 |
| 5 | P53HYPOXIAPATHWAY | Hypoxia induces p53 accumulation and consequent apoptosis with p53-mediated cell cycle arrest, which is present under conditions of DNA damage. | ABCB1, AKT1, ATM, BAX, CDKN1A, CPB2, CSNK1A1, CSNK1D, FHL2, GADD45A, HIC1, HIF1A, HSPA1A, HSPCA, IGFBP3, MAPK8, MDM2, NFKBIB, NQO1, TP53 | 19 | ABCB1(20), ATM(22), BAX(1), CDKN1A(1), CPB2(4), CSNK1A1(1), CSNK1D(2), GADD45A(1), HIF1A(1), IGFBP3(2), MAPK8(3), MDM2(2), NQO1(3), TP53(126) | 7172280 | 189 | 136 | 165 | 18 | 17 | 40 | 45 | 27 | 60 | 0 | 0.000012 | <1.00e-15 | <5.60e-14 |
| 6 | PLK3PATHWAY | Active Plk3 phosphorylates CDC25c, blocking the G2/M transition, and phosphorylates p53 to induce apoptosis. | ATM, ATR, CDC25C, CHEK1, CHEK2, CNK, TP53, YWHAH | 7 | ATM(22), ATR(17), CDC25C(3), CHEK1(6), CHEK2(2), TP53(126) | 5517526 | 176 | 134 | 153 | 7 | 10 | 35 | 48 | 28 | 55 | 0 | 1e-08 | <1.00e-15 | <5.60e-14 |
| 7 | ARFPATHWAY | Cyclin-dependent kinase inhibitor 2A is a tumor suppressor that induces G1 arrest and can activate the p53 pathway, leading to G2/M arrest. | ABL1, CDKN2A, E2F1, MDM2, MYC, PIK3CA, PIK3R1, POLR1A, POLR1B, POLR1C, POLR1D, RAC1, RB1, TBX2, TP53, TWIST1 | 16 | ABL1(2), CDKN2A(14), E2F1(3), MDM2(2), PIK3CA(11), PIK3R1(3), POLR1A(8), POLR1B(10), POLR1D(2), RB1(13), TBX2(1), TP53(126), TWIST1(1) | 7038773 | 196 | 131 | 170 | 15 | 16 | 33 | 53 | 29 | 65 | 0 | 2.8e-08 | <1.00e-15 | <5.60e-14 |
| 8 | TIDPATHWAY | On ligand binding, interferon gamma receptors stimulate JAK2 kinase to phosphorylate STAT transcription factors, which promote expression of interferon responsive genes. | DNAJA3, HSPA1A, IFNG, IFNGR1, IFNGR2, IKBKB, JAK2, LIN7A, NFKB1, NFKBIA, RB1, RELA, TIP-1, TNF, TNFRSF1A, TNFRSF1B, TP53, USH1C, WT1 | 18 | IFNG(4), IFNGR1(3), IFNGR2(3), IKBKB(3), JAK2(4), LIN7A(2), NFKB1(3), NFKBIA(1), RB1(13), TNFRSF1B(1), TP53(126), USH1C(4), WT1(8) | 6332308 | 175 | 131 | 153 | 16 | 15 | 35 | 41 | 21 | 63 | 0 | 1.8e-06 | <1.00e-15 | <5.60e-14 |
| 9 | PMLPATHWAY | Ring-shaped PML nuclear bodies regulate transcription and are required co-activators in p53- and DAXX-mediated apoptosis. | CREBBP, DAXX, HRAS, PAX3, PML, PRAM-1, RARA, RB1, SIRT1, SP100, TNF, TNFRSF1A, TNFRSF1B, TNFRSF6, TNFSF6, TP53, UBL1 | 13 | CREBBP(4), DAXX(6), HRAS(1), PAX3(6), PML(7), RARA(3), RB1(13), SIRT1(1), SP100(9), TNFRSF1B(1), TP53(126) | 6622222 | 177 | 129 | 155 | 15 | 14 | 30 | 47 | 25 | 61 | 0 | 3.8e-07 | <1.00e-15 | <5.60e-14 |
| 10 | SA_G1_AND_S_PHASES | Cdk2, 4, and 6 bind cyclin D in G1, while cdk2/cyclin E promotes the G1/S transition. | ARF1, ARF3, CCND1, CDK2, CDK4, CDKN1A, CDKN1B, CDKN2A, CFL1, E2F1, E2F2, MDM2, NXT1, PRB1, TP53 | 15 | ARF3(1), CCND1(2), CDK2(4), CDK4(2), CDKN1A(1), CDKN1B(3), CDKN2A(14), E2F1(3), MDM2(2), NXT1(1), PRB1(3), TP53(126) | 2958909 | 162 | 124 | 140 | 8 | 15 | 29 | 38 | 24 | 56 | 0 | 1.1e-09 | <1.00e-15 | <5.60e-14 |
Table 6. Get Full Table A Ranked List of Significantly Mutated Genesets (Excluding Significantly Mutated Genes). Number of significant genesets found: 0. Number of genesets displayed: 10
| rank | geneset | description | genes | N_genes | mut_tally | N | n | npat | nsite | nsil | n1 | n2 | n3 | n4 | n5 | n6 | p_ns_s | p | q |
|---|---|---|---|---|---|---|---|---|---|---|---|---|---|---|---|---|---|---|---|
| 1 | IL18PATHWAY | Pro-inflammatory IL-18 is activated in macrophages by caspase-1 cleavage and, in conjunction with IL-12, stimulates Th1 cell differentiation. | CASP1, IFNG, IL12A, IL12B, IL18, IL2 | 6 | CASP1(2), IFNG(4), IL12A(3), IL2(5) | 1033019 | 14 | 12 | 13 | 1 | 2 | 7 | 2 | 2 | 1 | 0 | 0.15 | 0.15 | 1 |
| 2 | P27PATHWAY | p27 blocks the G1/S transition by inhibiting the checkpoint kinase cdk2/cyclin E and is inhibited by cdk2-mediated ubiquitination. | CCNE1, CDK2, CDKN1B, CKS1B, CUL1, E2F1, NEDD8, RB1, RBX1, SKP1A, SKP2, TFDP1, UBE2M | 11 | CCNE1(3), CDK2(4), CDKN1B(3), CUL1(6), E2F1(3), NEDD8(2), SKP2(4), TFDP1(3), UBE2M(1) | 2352746 | 29 | 22 | 29 | 4 | 5 | 6 | 10 | 6 | 2 | 0 | 0.082 | 0.19 | 1 |
| 3 | HSA00730_THIAMINE_METABOLISM | Genes involved in thiamine metabolism | LHPP, MTMR1, MTMR2, MTMR6, NFS1, PHPT1, THTPA, TPK1 | 8 | LHPP(2), MTMR1(5), MTMR2(2), MTMR6(6), NFS1(4), PHPT1(1), TPK1(5) | 2218323 | 25 | 20 | 25 | 3 | 1 | 9 | 6 | 7 | 1 | 1 | 0.15 | 0.26 | 1 |
| 4 | HSA00830_RETINOL_METABOLISM | Genes involved in retinol metabolism | ALDH1A1, ALDH1A2, BCMO1, RDH5 | 4 | ALDH1A1(3), ALDH1A2(8), BCMO1(4) | 1334612 | 15 | 13 | 15 | 3 | 2 | 4 | 5 | 1 | 3 | 0 | 0.33 | 0.27 | 1 |
| 5 | HSA00130_UBIQUINONE_BIOSYNTHESIS | Genes involved in ubiquinone biosynthesis | COQ2, COQ3, COQ5, COQ6, COQ7, ND1, ND2, ND3, ND4, ND4L, ND5, ND6, NDUFA12, NDUFA13, NDUFB11 | 8 | COQ3(4), COQ5(5), COQ6(3), COQ7(1), NDUFA12(2), NDUFA13(4), NDUFB11(1) | 1380412 | 20 | 14 | 20 | 2 | 5 | 5 | 5 | 1 | 4 | 0 | 0.082 | 0.28 | 1 |
| 6 | FBW7PATHWAY | Cyclin E interacts with cell cycle checkpoint kinase cdk2 to allow transcription of genes required for S phase, including transcription of additional cyclin E. | CCNE1, CDC34, CDK2, CUL1, E2F1, FBXW7, RB1, SKP1A, TFDP1 | 7 | CCNE1(3), CDC34(1), CDK2(4), CUL1(6), E2F1(3), FBXW7(4), TFDP1(3) | 2268932 | 24 | 18 | 24 | 2 | 5 | 6 | 8 | 5 | 0 | 0 | 0.035 | 0.4 | 1 |
| 7 | BOTULINPATHWAY | Blockade of Neurotransmitter Relase by Botulinum Toxin | CHRM1, CHRNA1, SNAP25, STX1A, VAMP2 | 5 | CHRM1(2), CHRNA1(7), SNAP25(4), STX1A(3) | 1118665 | 16 | 13 | 16 | 3 | 5 | 3 | 5 | 1 | 2 | 0 | 0.2 | 0.42 | 1 |
| 8 | RECKPATHWAY | RECK is a membrane-anchored inhibitor of matrix metalloproteinases, which are expressed by tumor cells and promote metastasis. | HRAS, MMP14, MMP2, MMP9, RECK, TIMP1, TIMP2, TIMP3, TIMP4 | 9 | HRAS(1), MMP14(3), MMP2(13), MMP9(10), RECK(7), TIMP1(1), TIMP4(1) | 2582662 | 36 | 27 | 36 | 6 | 3 | 6 | 15 | 6 | 6 | 0 | 0.11 | 0.5 | 1 |
| 9 | PLK3PATHWAY | Active Plk3 phosphorylates CDC25c, blocking the G2/M transition, and phosphorylates p53 to induce apoptosis. | ATM, ATR, CDC25C, CHEK1, CHEK2, CNK, TP53, YWHAH | 6 | ATM(22), ATR(17), CDC25C(3), CHEK1(6), CHEK2(2) | 5229444 | 50 | 39 | 49 | 5 | 2 | 13 | 17 | 10 | 8 | 0 | 0.055 | 0.52 | 1 |
| 10 | HSA00031_INOSITOL_METABOLISM | Genes involved in inositol metabolism | ALDH6A1, TPI1 | 2 | TPI1(6) | 566088 | 6 | 5 | 6 | 0 | 0 | 3 | 2 | 1 | 0 | 0 | 0.24 | 0.55 | 1 |
In brief, we tabulate the number of mutations and the number of covered bases for each gene. The counts are broken down by mutation context category: four context categories that are discovered by MutSig, and one for indel and 'null' mutations, which include indels, nonsense mutations, splice-site mutations, and non-stop (read-through) mutations. For each gene, we calculate the probability of seeing the observed constellation of mutations, i.e. the product P1 x P2 x ... x Pm, or a more extreme one, given the background mutation rates calculated across the dataset. [1]
This is an experimental feature. The full results of the analysis summarized in this report can be downloaded from the TCGA Data Coordination Center.