This pipeline uses various statistical tests to identify mRNAs whose expression levels correlated to selected clinical features.
Testing the association between 18632 genes and 7 clinical features across 564 samples, statistically thresholded by Q value < 0.05, 6 clinical features related to at least one genes.
-
1 gene correlated to 'Time to Death'.
-
ZFHX4
-
181 genes correlated to 'AGE'.
-
STS , DEPDC6 , GREB1 , GNPNAT1 , SLCO1A2 , ...
-
3 genes correlated to 'PRIMARY.SITE.OF.DISEASE'.
-
SPINK8 , PTBP1 , EBI3
-
1 gene correlated to 'KARNOFSKY.PERFORMANCE.SCORE'.
-
WDR60
-
28 genes correlated to 'TUMOR.STAGE'.
-
BACE1 , PTRF , FREQ , PRRG1 , GAS1 , ...
-
25 genes correlated to 'RADIATIONS.RADIATION.REGIMENINDICATION'.
-
RAPGEF1 , SNX9 , EIF4G2 , PRRX1 , ZNF507 , ...
-
No genes correlated to 'NEOADJUVANT.THERAPY'
Complete statistical result table is provided in Supplement Table 1
Table 1. Get Full Table This table shows the clinical features, statistical methods used, and the number of genes that are significantly associated with each clinical feature at Q value < 0.05.
| Clinical feature | Statistical test | Significant genes | Associated with | Associated with | ||
|---|---|---|---|---|---|---|
| Time to Death | Cox regression test | N=1 | shorter survival | N=1 | longer survival | N=0 |
| AGE | Spearman correlation test | N=181 | older | N=72 | younger | N=109 |
| PRIMARY SITE OF DISEASE | ANOVA test | N=3 | ||||
| KARNOFSKY PERFORMANCE SCORE | Spearman correlation test | N=1 | higher score | N=1 | lower score | N=0 |
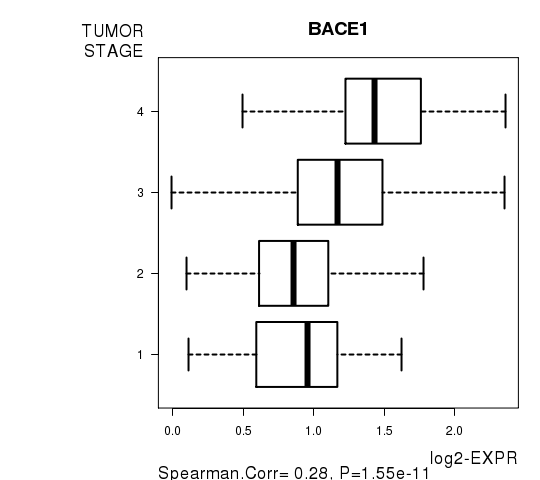
| TUMOR STAGE | Spearman correlation test | N=28 | higher stage | N=25 | lower stage | N=3 |
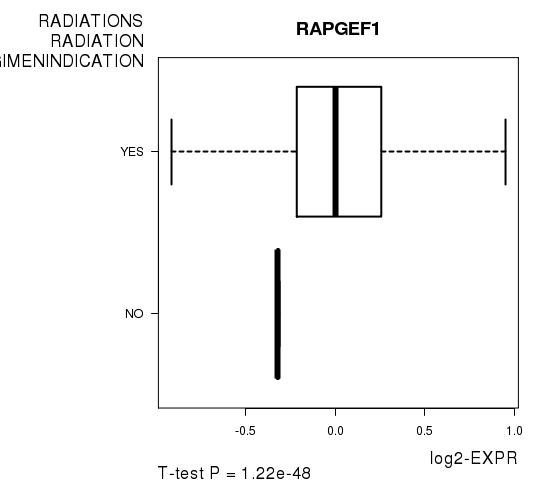
| RADIATIONS RADIATION REGIMENINDICATION | t test | N=25 | yes | N=18 | no | N=7 |
| NEOADJUVANT THERAPY | t test | N=0 |
Table S1. Basic characteristics of clinical feature: 'Time to Death'
| Time to Death | Duration (Months) | 0.3-180.2 (median=28.3) |
| censored | N = 267 | |
| death | N = 292 | |
| Significant markers | N = 1 | |
| associated with shorter survival | 1 | |
| associated with longer survival | 0 |
Table S2. Get Full Table List of one gene significantly associated with 'Time to Death' by Cox regression test
| HazardRatio | Wald_P | Q | C_index | |
|---|---|---|---|---|
| ZFHX4 | 1.64 | 1.152e-06 | 0.021 | 0.574 |
Figure S1. Get High-res Image As an example, this figure shows the association of ZFHX4 to 'Time to Death'. four curves present the cumulative survival rates of 4 quartile subsets of patients. P value = 1.15e-06 with univariate Cox regression analysis using continuous log-2 expression values.
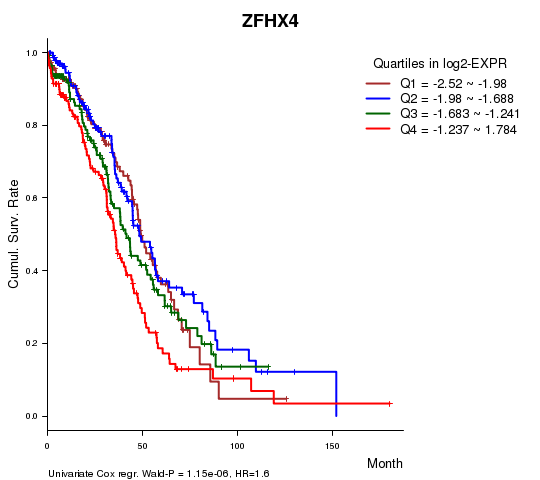
Table S3. Basic characteristics of clinical feature: 'AGE'
| AGE | Mean (SD) | 59.69 (12) |
| Significant markers | N = 181 | |
| pos. correlated | 72 | |
| neg. correlated | 109 |
Table S4. Get Full Table List of top 10 genes significantly correlated to 'AGE' by Spearman correlation test
| SpearmanCorr | corrP | Q | |
|---|---|---|---|
| STS | -0.3038 | 2.868e-13 | 5.34e-09 |
| DEPDC6 | -0.2939 | 1.748e-12 | 3.26e-08 |
| GREB1 | -0.2936 | 1.852e-12 | 3.45e-08 |
| GNPNAT1 | -0.2935 | 1.886e-12 | 3.51e-08 |
| SLCO1A2 | 0.2873 | 5.741e-12 | 1.07e-07 |
| EIF4E3 | -0.2849 | 8.668e-12 | 1.61e-07 |
| GEMIN8 | -0.2738 | 5.787e-11 | 1.08e-06 |
| NPAL2 | -0.2711 | 8.957e-11 | 1.67e-06 |
| C9ORF103 | -0.2685 | 1.385e-10 | 2.58e-06 |
| PRPS2 | -0.268 | 1.495e-10 | 2.78e-06 |
Figure S2. Get High-res Image As an example, this figure shows the association of STS to 'AGE'. P value = 2.87e-13 with Spearman correlation analysis. The straight line presents the best linear regression.
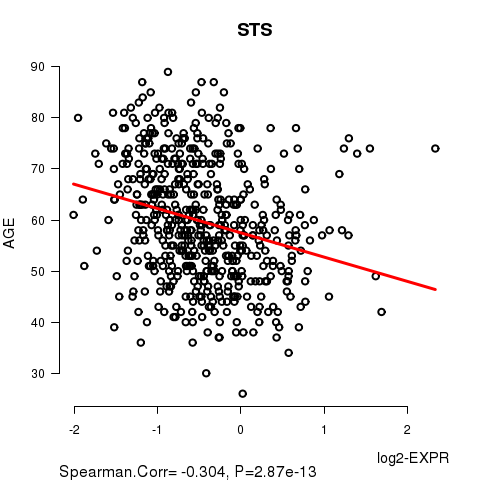
Table S5. Basic characteristics of clinical feature: 'PRIMARY.SITE.OF.DISEASE'
| PRIMARY.SITE.OF.DISEASE | Labels | N |
| OMENTUM | 2 | |
| OVARY | 560 | |
| PERITONEUM (OVARY) | 2 | |
| Significant markers | N = 3 |
Table S6. Get Full Table List of 3 genes differentially expressed by 'PRIMARY.SITE.OF.DISEASE'
| ANOVA_P | Q | |
|---|---|---|
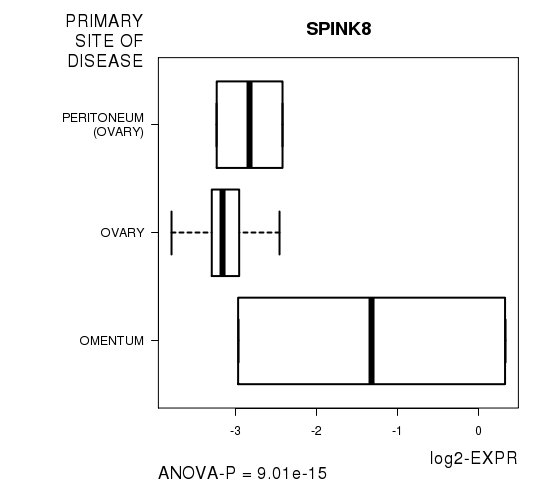
| SPINK8 | 9.011e-15 | 1.68e-10 |
| PTBP1 | 1.596e-08 | 0.000297 |
| EBI3 | 4.439e-07 | 0.00827 |
Figure S3. Get High-res Image As an example, this figure shows the association of SPINK8 to 'PRIMARY.SITE.OF.DISEASE'. P value = 9.01e-15 with ANOVA analysis.
One gene related to 'KARNOFSKY.PERFORMANCE.SCORE'.
Table S7. Basic characteristics of clinical feature: 'KARNOFSKY.PERFORMANCE.SCORE'
| KARNOFSKY.PERFORMANCE.SCORE | Mean (SD) | 75.64 (13) |
| Score | N | |
| 40 | 2 | |
| 60 | 20 | |
| 80 | 49 | |
| 100 | 7 | |
| Significant markers | N = 1 | |
| pos. correlated | 1 | |
| neg. correlated | 0 |
Table S8. Get Full Table List of one gene significantly correlated to 'KARNOFSKY.PERFORMANCE.SCORE' by Spearman correlation test
| SpearmanCorr | corrP | Q | |
|---|---|---|---|
| WDR60 | 0.5131 | 1.561e-06 | 0.0291 |
Figure S4. Get High-res Image As an example, this figure shows the association of WDR60 to 'KARNOFSKY.PERFORMANCE.SCORE'. P value = 1.56e-06 with Spearman correlation analysis.
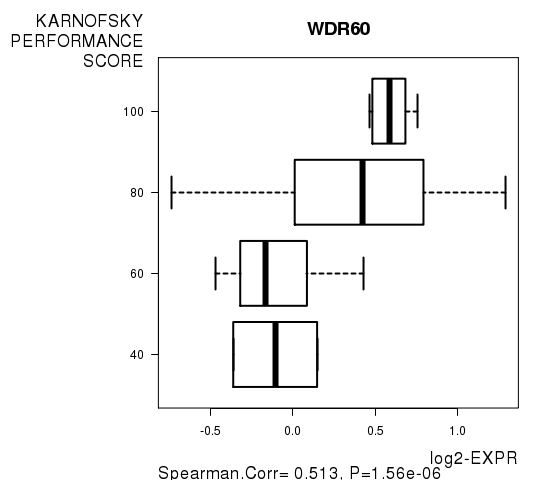
Table S9. Basic characteristics of clinical feature: 'TUMOR.STAGE'
| TUMOR.STAGE | Mean (SD) | 3.05 (0.56) |
| N | ||
| Stage 1 | 16 | |
| Stage 2 | 26 | |
| Stage 3 | 433 | |
| Stage 4 | 85 | |
| Significant markers | N = 28 | |
| pos. correlated | 25 | |
| neg. correlated | 3 |
Table S10. Get Full Table List of top 10 genes significantly correlated to 'TUMOR.STAGE' by Spearman correlation test
| SpearmanCorr | corrP | Q | |
|---|---|---|---|
| BACE1 | 0.2799 | 1.548e-11 | 2.88e-07 |
| PTRF | 0.2443 | 4.694e-09 | 8.75e-05 |
| FREQ | 0.2303 | 3.568e-08 | 0.000665 |
| PRRG1 | 0.2295 | 3.966e-08 | 0.000739 |
| GAS1 | 0.2208 | 1.293e-07 | 0.00241 |
| PDK1 | -0.2178 | 1.927e-07 | 0.00359 |
| PLCD3 | 0.2174 | 2.048e-07 | 0.00382 |
| CELSR2 | 0.2135 | 3.413e-07 | 0.00636 |
| NBL1 | 0.21 | 5.291e-07 | 0.00985 |
| CIZ1 | 0.2086 | 6.351e-07 | 0.0118 |
Figure S5. Get High-res Image As an example, this figure shows the association of BACE1 to 'TUMOR.STAGE'. P value = 1.55e-11 with Spearman correlation analysis.
25 genes related to 'RADIATIONS.RADIATION.REGIMENINDICATION'.
Table S11. Basic characteristics of clinical feature: 'RADIATIONS.RADIATION.REGIMENINDICATION'
| RADIATIONS.RADIATION.REGIMENINDICATION | Labels | N |
| NO | 3 | |
| YES | 561 | |
| Significant markers | N = 25 | |
| Higher in YES | 18 | |
| Higher in NO | 7 |
Table S12. Get Full Table List of top 10 genes differentially expressed by 'RADIATIONS.RADIATION.REGIMENINDICATION'
| T(pos if higher in 'YES') | ttestP | Q | AUC | |
|---|---|---|---|---|
| RAPGEF1 | 21.42 | 1.217e-48 | 2.27e-44 | 0.836 |
| SNX9 | -15.68 | 3.049e-33 | 5.68e-29 | 0.7641 |
| EIF4G2 | 14.33 | 1.465e-23 | 2.73e-19 | 0.7629 |
| PRRX1 | 13.61 | 8.621e-20 | 1.61e-15 | 0.6542 |
| ZNF507 | -23.26 | 5.022e-15 | 9.36e-11 | 0.9002 |
| ACTL7B | -11.4 | 8.997e-15 | 1.68e-10 | 0.7094 |
| CNKSR2 | -8.75 | 1.286e-14 | 2.4e-10 | 0.7249 |
| AKAP9 | 16.72 | 2.49e-14 | 4.64e-10 | 0.7885 |
| CRIP2 | 9.77 | 3.78e-14 | 7.04e-10 | 0.694 |
| NF2 | 17.14 | 3.427e-13 | 6.38e-09 | 0.8491 |
Figure S6. Get High-res Image As an example, this figure shows the association of RAPGEF1 to 'RADIATIONS.RADIATION.REGIMENINDICATION'. P value = 1.22e-48 with T-test analysis.
-
Expresson data file = OV.medianexp.txt
-
Clinical data file = OV.clin.merged.picked.txt
-
Number of patients = 564
-
Number of genes = 18632
-
Number of clinical features = 7
For survival clinical features, Wald's test in univariate Cox regression analysis with proportional hazards model (Andersen and Gill 1982) was used to estimate the P values using the 'coxph' function in R. Kaplan-Meier survival curves were plot using the four quartile subgroups of patients based on expression levels
For continuous numerical clinical features, Spearman's rank correlation coefficients (Spearman 1904) and two-tailed P values were estimated using 'cor.test' function in R
For multi-class clinical features (ordinal or nominal), one-way analysis of variance (Howell 2002) was applied to compare the log2-expression levels between different clinical classes using 'anova' function in R
For two-class clinical features, two-tailed Student's t test with unequal variance (Lehmann and Romano 2005) was applied to compare the log2-expression levels between the two clinical classes using 't.test' function in R
For multiple hypothesis correction, Q value is the False Discovery Rate (FDR) analogue of the P value (Benjamini and Hochberg 1995), defined as the minimum FDR at which the test may be called significant. We used the 'Benjamini and Hochberg' method of 'p.adjust' function in R to convert P values into Q values.
This is an experimental feature. The full results of the analysis summarized in this report can be downloaded from the TCGA Data Coordination Center.