This pipeline uses various statistical tests to identify genes whose promoter methylation levels correlated to selected clinical features.
Testing the association between 12742 genes and 7 clinical features across 549 samples, statistically thresholded by Q value < 0.05, 5 clinical features related to at least one genes.
-
144 genes correlated to 'AGE'.
-
LPA , GRIK2 , FLJ44881 , PCDHGB7 , CNTD1 , ...
-
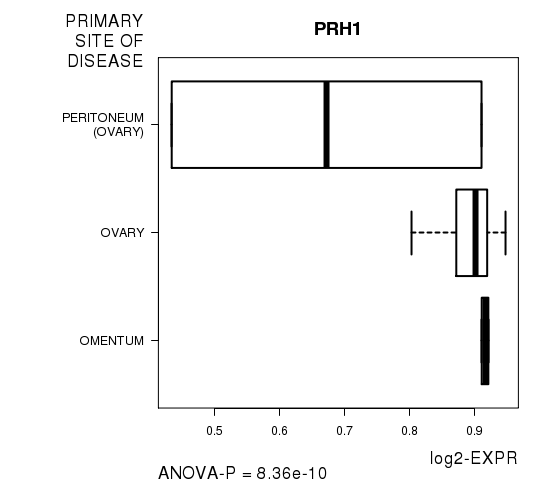
4 genes correlated to 'PRIMARY.SITE.OF.DISEASE'.
-
PRH1 , BMPR1B , TAS2R50 , DBN1
-
1 gene correlated to 'KARNOFSKY.PERFORMANCE.SCORE'.
-
OLFML1
-
2144 genes correlated to 'RADIATIONS.RADIATION.REGIMENINDICATION'.
-
NID2 , CHRNA9 , MLL3 , FXR2 , EXOC5 , ...
-
19 genes correlated to 'NEOADJUVANT.THERAPY'.
-
NF1 , TM7SF3 , CCR4 , CDCA2 , CASP3 , ...
-
No genes correlated to 'Time to Death', and 'TUMOR.STAGE'.
Complete statistical result table is provided in Supplement Table 1
Table 1. Get Full Table This table shows the clinical features, statistical methods used, and the number of genes that are significantly associated with each clinical feature at Q value < 0.05.
| Clinical feature | Statistical test | Significant genes | Associated with | Associated with | ||
|---|---|---|---|---|---|---|
| Time to Death | Cox regression test | N=0 | ||||
| AGE | Spearman correlation test | N=144 | older | N=18 | younger | N=126 |
| PRIMARY SITE OF DISEASE | ANOVA test | N=4 | ||||
| KARNOFSKY PERFORMANCE SCORE | Spearman correlation test | N=1 | higher score | N=1 | lower score | N=0 |
| TUMOR STAGE | Spearman correlation test | N=0 | ||||
| RADIATIONS RADIATION REGIMENINDICATION | t test | N=2144 | yes | N=2096 | no | N=48 |
| NEOADJUVANT THERAPY | t test | N=19 | yes | N=7 | no | N=12 |
Table S1. Basic characteristics of clinical feature: 'Time to Death'
| Time to Death | Duration (Months) | 0.3-180.2 (median=29) |
| censored | N = 253 | |
| death | N = 290 | |
| Significant markers | N = 0 |
Table S2. Basic characteristics of clinical feature: 'AGE'
| AGE | Mean (SD) | 59.73 (12) |
| Significant markers | N = 144 | |
| pos. correlated | 18 | |
| neg. correlated | 126 |
Table S3. Get Full Table List of top 10 genes significantly correlated to 'AGE' by Spearman correlation test
| SpearmanCorr | corrP | Q | |
|---|---|---|---|
| LPA | 0.3052 | 4.421e-13 | 5.63e-09 |
| GRIK2 | 0.2992 | 1.308e-12 | 1.67e-08 |
| FLJ44881 | -0.2933 | 5.384e-12 | 6.86e-08 |
| PCDHGB7 | 0.2849 | 1.604e-11 | 2.04e-07 |
| CNTD1 | -0.27 | 1.853e-10 | 2.36e-06 |
| INHBE | -0.2667 | 3.131e-10 | 3.99e-06 |
| TTLL7 | -0.2626 | 5.995e-10 | 7.64e-06 |
| SDR16C5 | -0.261 | 7.639e-10 | 9.73e-06 |
| PRLH | -0.2602 | 8.662e-10 | 1.1e-05 |
| GPR12 | -0.2554 | 2.297e-09 | 2.92e-05 |
Figure S1. Get High-res Image As an example, this figure shows the association of LPA to 'AGE'. P value = 4.42e-13 with Spearman correlation analysis. The straight line presents the best linear regression.
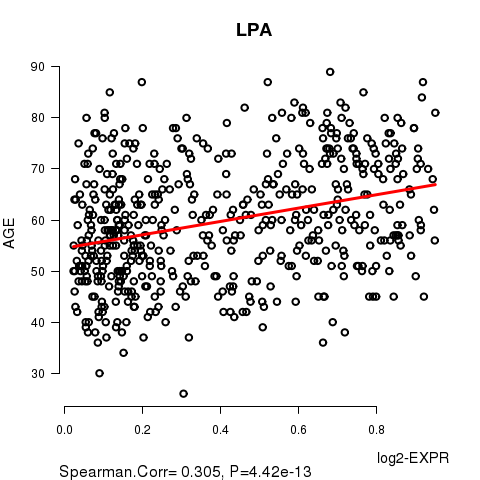
Table S4. Basic characteristics of clinical feature: 'PRIMARY.SITE.OF.DISEASE'
| PRIMARY.SITE.OF.DISEASE | Labels | N |
| OMENTUM | 2 | |
| OVARY | 545 | |
| PERITONEUM (OVARY) | 2 | |
| Significant markers | N = 4 |
Table S5. Get Full Table List of 4 genes differentially expressed by 'PRIMARY.SITE.OF.DISEASE'
| ANOVA_P | Q | |
|---|---|---|
| PRH1 | 8.359e-10 | 1.07e-05 |
| BMPR1B | 2.951e-08 | 0.000376 |
| TAS2R50 | 8.842e-07 | 0.0113 |
| DBN1 | 1.046e-06 | 0.0133 |
Figure S2. Get High-res Image As an example, this figure shows the association of PRH1 to 'PRIMARY.SITE.OF.DISEASE'. P value = 8.36e-10 with ANOVA analysis.
One gene related to 'KARNOFSKY.PERFORMANCE.SCORE'.
Table S6. Basic characteristics of clinical feature: 'KARNOFSKY.PERFORMANCE.SCORE'
| KARNOFSKY.PERFORMANCE.SCORE | Mean (SD) | 75.64 (13) |
| Score | N | |
| 40 | 2 | |
| 60 | 20 | |
| 80 | 49 | |
| 100 | 7 | |
| Significant markers | N = 1 | |
| pos. correlated | 1 | |
| neg. correlated | 0 |
Table S7. Get Full Table List of one gene significantly correlated to 'KARNOFSKY.PERFORMANCE.SCORE' by Spearman correlation test
| SpearmanCorr | corrP | Q | |
|---|---|---|---|
| OLFML1 | 0.5794 | 3.38e-08 | 0.000431 |
Figure S3. Get High-res Image As an example, this figure shows the association of OLFML1 to 'KARNOFSKY.PERFORMANCE.SCORE'. P value = 3.38e-08 with Spearman correlation analysis.
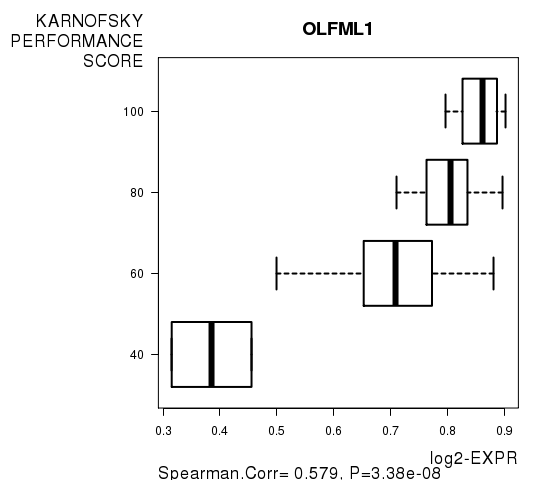
Table S8. Basic characteristics of clinical feature: 'TUMOR.STAGE'
| TUMOR.STAGE | Mean (SD) | 3.05 (0.56) |
| N | ||
| Stage 1 | 16 | |
| Stage 2 | 24 | |
| Stage 3 | 421 | |
| Stage 4 | 83 | |
| Significant markers | N = 0 |
2144 genes related to 'RADIATIONS.RADIATION.REGIMENINDICATION'.
Table S9. Basic characteristics of clinical feature: 'RADIATIONS.RADIATION.REGIMENINDICATION'
| RADIATIONS.RADIATION.REGIMENINDICATION | Labels | N |
| NO | 3 | |
| YES | 546 | |
| Significant markers | N = 2144 | |
| Higher in YES | 2096 | |
| Higher in NO | 48 |
Table S10. Get Full Table List of top 10 genes differentially expressed by 'RADIATIONS.RADIATION.REGIMENINDICATION'
| T(pos if higher in 'YES') | ttestP | Q | AUC | |
|---|---|---|---|---|
| NID2 | 27.3 | 2.31e-100 | 2.94e-96 | 0.9829 |
| CHRNA9 | 28.28 | 3.239e-94 | 4.13e-90 | 0.8765 |
| MLL3 | 22.58 | 1.441e-73 | 1.84e-69 | 0.8767 |
| FXR2 | 21.37 | 6.892e-69 | 8.78e-65 | 0.9609 |
| EXOC5 | 21.03 | 8.412e-67 | 1.07e-62 | 0.9104 |
| DVL2 | 19.75 | 6.859e-66 | 8.74e-62 | 0.8657 |
| RNF130 | 19.16 | 8.573e-63 | 1.09e-58 | 0.8663 |
| NPPB | 18.98 | 4.221e-62 | 5.37e-58 | 0.8541 |
| FKBP3 | 18.83 | 3.703e-61 | 4.72e-57 | 0.8712 |
| CDCA7 | 18.61 | 1.143e-59 | 1.46e-55 | 0.8773 |
Figure S4. Get High-res Image As an example, this figure shows the association of NID2 to 'RADIATIONS.RADIATION.REGIMENINDICATION'. P value = 2.31e-100 with T-test analysis.
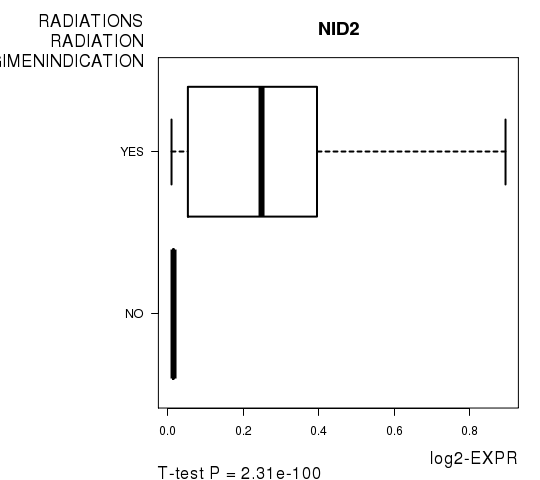
Table S11. Basic characteristics of clinical feature: 'NEOADJUVANT.THERAPY'
| NEOADJUVANT.THERAPY | Labels | N |
| NO | 441 | |
| YES | 108 | |
| Significant markers | N = 19 | |
| Higher in YES | 7 | |
| Higher in NO | 12 |
Table S12. Get Full Table List of top 10 genes differentially expressed by 'NEOADJUVANT.THERAPY'
| T(pos if higher in 'YES') | ttestP | Q | AUC | |
|---|---|---|---|---|
| NF1 | -5.36 | 1.883e-07 | 0.0024 | 0.6315 |
| TM7SF3 | -5.25 | 2.783e-07 | 0.00355 | 0.5927 |
| CCR4 | 5.14 | 4.881e-07 | 0.00622 | 0.6277 |
| CDCA2 | -5.11 | 5.377e-07 | 0.00685 | 0.6028 |
| CASP3 | 5.1 | 7.371e-07 | 0.00939 | 0.6306 |
| KLRA1 | 5.07 | 8.368e-07 | 0.0107 | 0.6241 |
| DZIP3 | -5.01 | 8.808e-07 | 0.0112 | 0.5866 |
| ZEB1 | -4.98 | 1.138e-06 | 0.0145 | 0.6002 |
| TLL1 | -4.98 | 1.155e-06 | 0.0147 | 0.6037 |
| TFCP2L1 | -4.87 | 1.713e-06 | 0.0218 | 0.6147 |
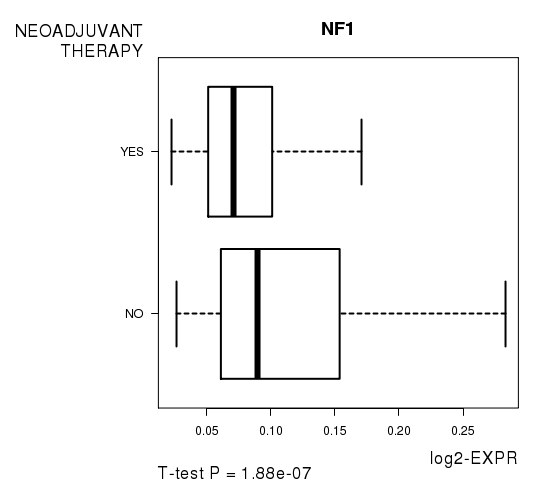
Figure S5. Get High-res Image As an example, this figure shows the association of NF1 to 'NEOADJUVANT.THERAPY'. P value = 1.88e-07 with T-test analysis.
-
Expresson data file = OV.meth.for_correlation.filtered_data.txt
-
Clinical data file = OV.clin.merged.picked.txt
-
Number of patients = 549
-
Number of genes = 12742
-
Number of clinical features = 7
For survival clinical features, Wald's test in univariate Cox regression analysis with proportional hazards model (Andersen and Gill 1982) was used to estimate the P values using the 'coxph' function in R. Kaplan-Meier survival curves were plot using the four quartile subgroups of patients based on expression levels
For continuous numerical clinical features, Spearman's rank correlation coefficients (Spearman 1904) and two-tailed P values were estimated using 'cor.test' function in R
For multi-class clinical features (ordinal or nominal), one-way analysis of variance (Howell 2002) was applied to compare the log2-expression levels between different clinical classes using 'anova' function in R
For two-class clinical features, two-tailed Student's t test with unequal variance (Lehmann and Romano 2005) was applied to compare the log2-expression levels between the two clinical classes using 't.test' function in R
For multiple hypothesis correction, Q value is the False Discovery Rate (FDR) analogue of the P value (Benjamini and Hochberg 1995), defined as the minimum FDR at which the test may be called significant. We used the 'Benjamini and Hochberg' method of 'p.adjust' function in R to convert P values into Q values.
This is an experimental feature. The full results of the analysis summarized in this report can be downloaded from the TCGA Data Coordination Center.