This pipeline uses various statistical tests to identify genes whose promoter methylation levels correlated to selected clinical features.
Testing the association between 20229 genes and 9 clinical features across 68 samples, statistically thresholded by Q value < 0.05, 4 clinical features related to at least one genes.
-
1 gene correlated to 'GENDER'.
-
KIF4B
-
34 genes correlated to 'HISTOLOGICAL.TYPE'.
-
LOC255025 , VENTXP7 , LRRC7 , NAALADL2 , RBM12B , ...
-
8 genes correlated to 'PATHOLOGY.T'.
-
SPINT2 , C17ORF55 , LY75 , DHRS3 , IQGAP3 , ...
-
66 genes correlated to 'PATHOLOGICSPREAD(M)'.
-
KDM3A , ZNF846 , C7ORF31 , ZMYM5 , UBE2Q2P2 , ...
-
No genes correlated to 'Time to Death', 'AGE', 'PATHOLOGY.N', 'TUMOR.STAGE', and 'NEOADJUVANT.THERAPY'.
Complete statistical result table is provided in Supplement Table 1
Table 1. Get Full Table This table shows the clinical features, statistical methods used, and the number of genes that are significantly associated with each clinical feature at Q value < 0.05.
| Clinical feature | Statistical test | Significant genes | Associated with | Associated with | ||
|---|---|---|---|---|---|---|
| Time to Death | Cox regression test | N=0 | ||||
| AGE | Spearman correlation test | N=0 | ||||
| GENDER | t test | N=1 | male | N=0 | female | N=1 |
| HISTOLOGICAL TYPE | ANOVA test | N=34 | ||||
| PATHOLOGY T | Spearman correlation test | N=8 | higher pT | N=8 | lower pT | N=0 |
| PATHOLOGY N | Spearman correlation test | N=0 | ||||
| PATHOLOGICSPREAD(M) | ANOVA test | N=66 | ||||
| TUMOR STAGE | Spearman correlation test | N=0 | ||||
| NEOADJUVANT THERAPY | t test | N=0 |
Table S1. Basic characteristics of clinical feature: 'Time to Death'
| Time to Death | Duration (Months) | 0.1-70.1 (median=2.2) |
| censored | N = 56 | |
| death | N = 9 | |
| Significant markers | N = 0 |
Table S2. Basic characteristics of clinical feature: 'AGE'
| AGE | Mean (SD) | 66.8 (11) |
| Significant markers | N = 0 |
Table S3. Basic characteristics of clinical feature: 'GENDER'
| GENDER | Labels | N |
| FEMALE | 24 | |
| MALE | 44 | |
| Significant markers | N = 1 | |
| Higher in MALE | 0 | |
| Higher in FEMALE | 1 |
Table S4. Get Full Table List of one gene differentially expressed by 'GENDER'
| T(pos if higher in 'MALE') | ttestP | Q | AUC | |
|---|---|---|---|---|
| KIF4B | -6.8 | 7.427e-08 | 0.0015 | 0.8835 |
Figure S1. Get High-res Image As an example, this figure shows the association of KIF4B to 'GENDER'. P value = 7.43e-08 with T-test analysis.
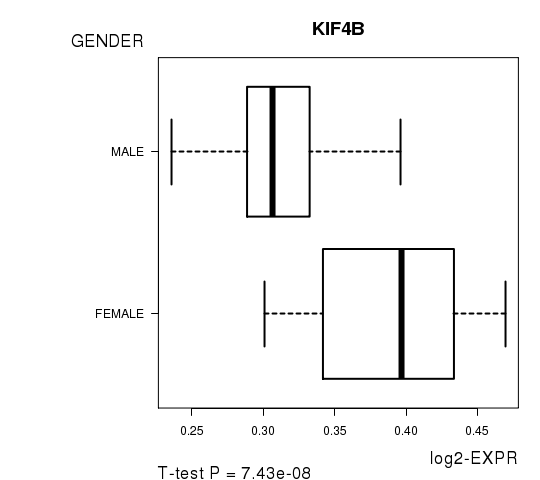
Table S5. Basic characteristics of clinical feature: 'HISTOLOGICAL.TYPE'
| HISTOLOGICAL.TYPE | Labels | N |
| STOMACH ADENOCARCINOMA - DIFFUSE TYPE | 11 | |
| STOMACH ADENOCARCINOMA - NOT OTHERWISE SPECIFIED (NOS) | 28 | |
| STOMACH INTESTINAL ADENOCARCINOMA - MUCINOUS TYPE | 3 | |
| STOMACH INTESTINAL ADENOCARCINOMA - PAPILLARY TYPE | 2 | |
| STOMACH INTESTINAL ADENOCARCINOMA - TUBULAR TYPE | 9 | |
| STOMACH INTESTINAL ADENOCARCINOMA - TYPE NOT OTHERWISE SPECIFIED (NOS) | 15 | |
| Significant markers | N = 34 |
Table S6. Get Full Table List of top 10 genes differentially expressed by 'HISTOLOGICAL.TYPE'
| ANOVA_P | Q | |
|---|---|---|
| LOC255025 | 9.046e-09 | 0.000183 |
| VENTXP7 | 9.696e-09 | 0.000196 |
| LRRC7 | 1.597e-08 | 0.000323 |
| NAALADL2 | 2.638e-08 | 0.000534 |
| RBM12B | 4.66e-08 | 0.000942 |
| RPL41 | 7.259e-08 | 0.00147 |
| PABPC1P2 | 8.026e-08 | 0.00162 |
| KRTAP19-7 | 1.018e-07 | 0.00206 |
| PDHA2 | 1.262e-07 | 0.00255 |
| TMTC1 | 1.442e-07 | 0.00292 |
Figure S2. Get High-res Image As an example, this figure shows the association of LOC255025 to 'HISTOLOGICAL.TYPE'. P value = 9.05e-09 with ANOVA analysis.
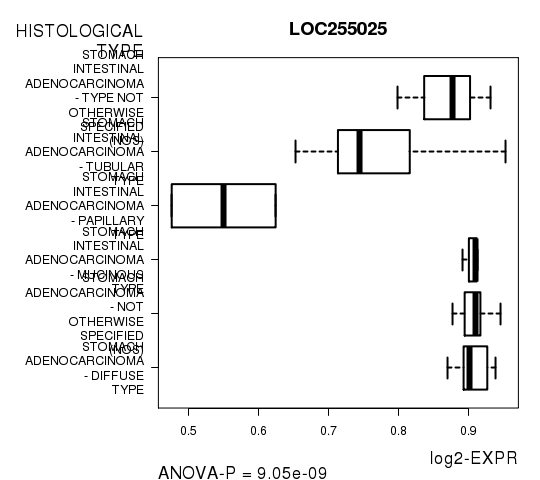
Table S7. Basic characteristics of clinical feature: 'PATHOLOGY.T'
| PATHOLOGY.T | Mean (SD) | 2.57 (0.7) |
| N | ||
| T1 | 2 | |
| T2 | 31 | |
| T3 | 29 | |
| T4 | 6 | |
| Significant markers | N = 8 | |
| pos. correlated | 8 | |
| neg. correlated | 0 |
Table S8. Get Full Table List of 8 genes significantly correlated to 'PATHOLOGY.T' by Spearman correlation test
| SpearmanCorr | corrP | Q | |
|---|---|---|---|
| SPINT2 | 0.5706 | 3.779e-07 | 0.00765 |
| C17ORF55 | 0.566 | 4.888e-07 | 0.00989 |
| LY75 | 0.552 | 1.062e-06 | 0.0215 |
| DHRS3 | 0.5412 | 1.889e-06 | 0.0382 |
| IQGAP3 | 0.5399 | 2.017e-06 | 0.0408 |
| TGFBR3 | 0.5389 | 2.13e-06 | 0.0431 |
| C1ORF172 | 0.5383 | 2.189e-06 | 0.0443 |
| KCNE3 | 0.538 | 2.227e-06 | 0.045 |
Figure S3. Get High-res Image As an example, this figure shows the association of SPINT2 to 'PATHOLOGY.T'. P value = 3.78e-07 with Spearman correlation analysis.
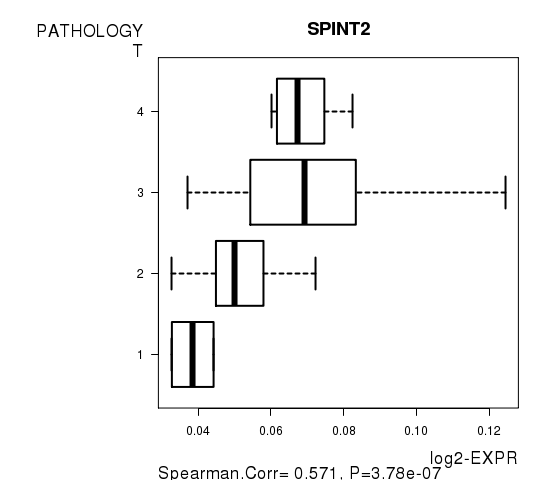
Table S9. Basic characteristics of clinical feature: 'PATHOLOGY.N'
| PATHOLOGY.N | Mean (SD) | 1 (1) |
| N | ||
| N0 | 27 | |
| N1 | 21 | |
| N2 | 13 | |
| N3 | 7 | |
| Significant markers | N = 0 |
Table S10. Basic characteristics of clinical feature: 'PATHOLOGICSPREAD(M)'
| PATHOLOGICSPREAD(M) | Labels | N |
| M0 | 61 | |
| M1 | 6 | |
| MX | 1 | |
| Significant markers | N = 66 |
Table S11. Get Full Table List of top 10 genes differentially expressed by 'PATHOLOGICSPREAD(M)'
| ANOVA_P | Q | |
|---|---|---|
| KDM3A | 3.54e-56 | 7.16e-52 |
| ZNF846 | 8.686e-55 | 1.76e-50 |
| C7ORF31 | 8.6e-50 | 1.74e-45 |
| ZMYM5 | 2.571e-30 | 5.2e-26 |
| UBE2Q2P2 | 2.586e-26 | 5.23e-22 |
| UBE2Q2P3 | 2.586e-26 | 5.23e-22 |
| C6ORF226 | 1.752e-25 | 3.54e-21 |
| MIR15A | 6.658e-25 | 1.35e-20 |
| JUN | 1.081e-21 | 2.19e-17 |
| DNAJC18 | 2.755e-21 | 5.57e-17 |
Figure S4. Get High-res Image As an example, this figure shows the association of KDM3A to 'PATHOLOGICSPREAD(M)'. P value = 3.54e-56 with ANOVA analysis.
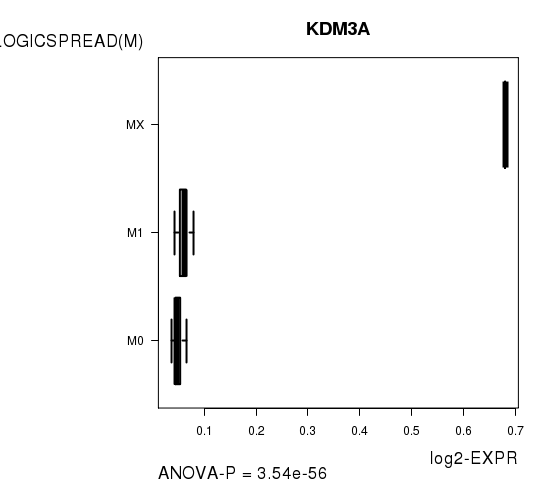
Table S12. Basic characteristics of clinical feature: 'TUMOR.STAGE'
| TUMOR.STAGE | Mean (SD) | 2.43 (0.94) |
| N | ||
| Stage 1 | 11 | |
| Stage 2 | 27 | |
| Stage 3 | 20 | |
| Stage 4 | 10 | |
| Significant markers | N = 0 |
-
Expresson data file = STAD.meth.for_correlation.filtered_data.txt
-
Clinical data file = STAD.clin.merged.picked.txt
-
Number of patients = 68
-
Number of genes = 20229
-
Number of clinical features = 9
For survival clinical features, Wald's test in univariate Cox regression analysis with proportional hazards model (Andersen and Gill 1982) was used to estimate the P values using the 'coxph' function in R. Kaplan-Meier survival curves were plot using the four quartile subgroups of patients based on expression levels
For continuous numerical clinical features, Spearman's rank correlation coefficients (Spearman 1904) and two-tailed P values were estimated using 'cor.test' function in R
For two-class clinical features, two-tailed Student's t test with unequal variance (Lehmann and Romano 2005) was applied to compare the log2-expression levels between the two clinical classes using 't.test' function in R
For multi-class clinical features (ordinal or nominal), one-way analysis of variance (Howell 2002) was applied to compare the log2-expression levels between different clinical classes using 'anova' function in R
For multiple hypothesis correction, Q value is the False Discovery Rate (FDR) analogue of the P value (Benjamini and Hochberg 1995), defined as the minimum FDR at which the test may be called significant. We used the 'Benjamini and Hochberg' method of 'p.adjust' function in R to convert P values into Q values.
This is an experimental feature. The full results of the analysis summarized in this report can be downloaded from the TCGA Data Coordination Center.