This pipeline uses various statistical tests to identify mRNAs whose expression levels correlated to selected clinical features.
Testing the association between 17948 genes and 5 clinical features across 116 samples, statistically thresholded by Q value < 0.05, 5 clinical features related to at least one genes.
-
14 genes correlated to 'AGE'.
-
KBTBD2|25948 , DUSP6|1848 , CD97|976 , MST1P9|11223 , DDIT4L|115265 , ...
-
25 genes correlated to 'GENDER'.
-
DDX3Y|8653 , RPS4Y1|6192 , ZFY|7544 , USP9Y|8287 , UTY|7404 , ...
-
2301 genes correlated to 'HISTOLOGICAL.TYPE'.
-
PDHA1|5160 , GOT2|2806 , ITGA3|3675 , COQ9|57017 , KCNIP3|30818 , ...
-
19 genes correlated to 'RADIATIONS.RADIATION.REGIMENINDICATION'.
-
FLJ37543|285668 , DNAH14|127602 , ORC1L|4998 , CUL7|9820 , C14ORF180|400258 , ...
-
162 genes correlated to 'NEOADJUVANT.THERAPY'.
-
SH2D1B|117157 , L3MBTL|26013 , KDM5C|8242 , SSR2|6746 , ZNF512|84450 , ...
Complete statistical result table is provided in Supplement Table 1
Table 1. Get Full Table This table shows the clinical features, statistical methods used, and the number of genes that are significantly associated with each clinical feature at Q value < 0.05.
| Clinical feature | Statistical test | Significant genes | Associated with | Associated with | ||
|---|---|---|---|---|---|---|
| AGE | Spearman correlation test | N=14 | older | N=4 | younger | N=10 |
| GENDER | t test | N=25 | male | N=13 | female | N=12 |
| HISTOLOGICAL TYPE | ANOVA test | N=2301 | ||||
| RADIATIONS RADIATION REGIMENINDICATION | t test | N=19 | yes | N=5 | no | N=14 |
| NEOADJUVANT THERAPY | t test | N=162 | yes | N=52 | no | N=110 |
Table S1. Basic characteristics of clinical feature: 'AGE'
| AGE | Mean (SD) | 47.71 (16) |
| Significant markers | N = 14 | |
| pos. correlated | 4 | |
| neg. correlated | 10 |
Table S2. Get Full Table List of top 10 genes significantly correlated to 'AGE' by Spearman correlation test
| SpearmanCorr | corrP | Q | |
|---|---|---|---|
| KBTBD2|25948 | -0.4693 | 1.073e-07 | 0.00193 |
| DUSP6|1848 | -0.4622 | 1.765e-07 | 0.00317 |
| CD97|976 | -0.4568 | 2.543e-07 | 0.00456 |
| MST1P9|11223 | -0.4565 | 2.604e-07 | 0.00467 |
| DDIT4L|115265 | 0.4531 | 3.262e-07 | 0.00585 |
| ZCCHC12|170261 | -0.449 | 4.291e-07 | 0.0077 |
| TMEM49|81671 | -0.4474 | 4.761e-07 | 0.00854 |
| LOC401431|401431 | 0.4438 | 6.059e-07 | 0.0109 |
| NDEL1|81565 | -0.4436 | 6.125e-07 | 0.011 |
| GSTM4|2948 | 0.4262 | 1.841e-06 | 0.033 |
Figure S1. Get High-res Image As an example, this figure shows the association of KBTBD2|25948 to 'AGE'. P value = 1.07e-07 with Spearman correlation analysis. The straight line presents the best linear regression.
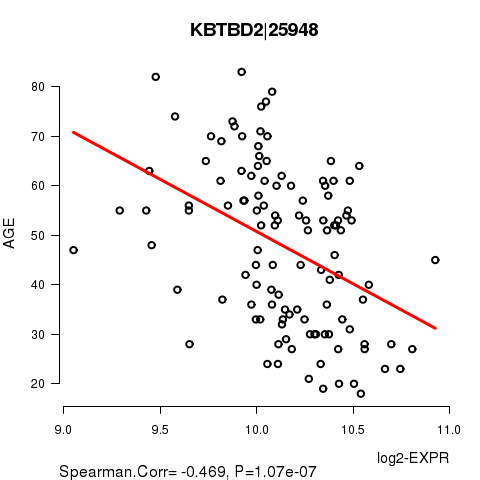
Table S3. Basic characteristics of clinical feature: 'GENDER'
| GENDER | Labels | N |
| FEMALE | 81 | |
| MALE | 35 | |
| Significant markers | N = 25 | |
| Higher in MALE | 13 | |
| Higher in FEMALE | 12 |
Table S4. Get Full Table List of top 10 genes differentially expressed by 'GENDER'
| T(pos if higher in 'MALE') | ttestP | Q | AUC | |
|---|---|---|---|---|
| DDX3Y|8653 | 58.99 | 1.24e-62 | 2.23e-58 | 1 |
| RPS4Y1|6192 | 46.45 | 8.673e-62 | 1.56e-57 | 1 |
| ZFY|7544 | 52.36 | 1.202e-59 | 2.16e-55 | 1 |
| USP9Y|8287 | 53.54 | 2.669e-56 | 4.79e-52 | 1 |
| UTY|7404 | 54.49 | 2.087e-49 | 3.74e-45 | 1 |
| NLGN4Y|22829 | 39 | 1.549e-46 | 2.78e-42 | 1 |
| PRKY|5616 | 21.24 | 3.833e-40 | 6.88e-36 | 0.9981 |
| KDM5D|8284 | 50.93 | 7.721e-39 | 1.39e-34 | 1 |
| CYORF15A|246126 | 42.66 | 4.364e-31 | 7.83e-27 | 1 |
| TSIX|9383 | -17.46 | 6.628e-25 | 1.19e-20 | 0.9994 |
Figure S2. Get High-res Image As an example, this figure shows the association of DDX3Y|8653 to 'GENDER'. P value = 1.24e-62 with T-test analysis.
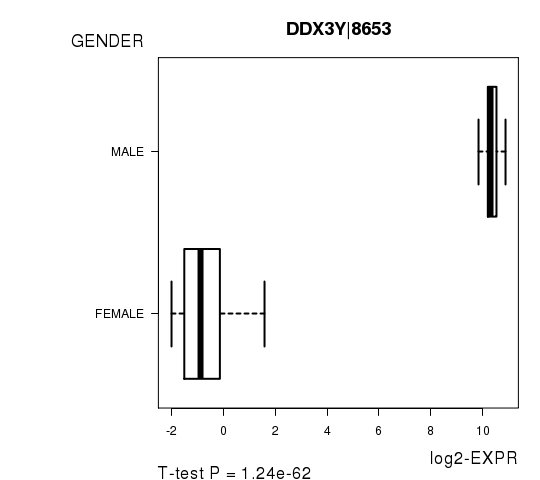
Table S5. Basic characteristics of clinical feature: 'HISTOLOGICAL.TYPE'
| HISTOLOGICAL.TYPE | Labels | N |
| OTHER | 3 | |
| THYROID PAPILLARY CARCINOMA - CLASSICAL/USUAL | 65 | |
| THYROID PAPILLARY CARCINOMA - FOLLICULAR (>= 99% FOLLICULAR PATTERNED) | 32 | |
| THYROID PAPILLARY CARCINOMA - TALL CELL (>= 50% TALL CELL FEATURES) | 16 | |
| Significant markers | N = 2301 |
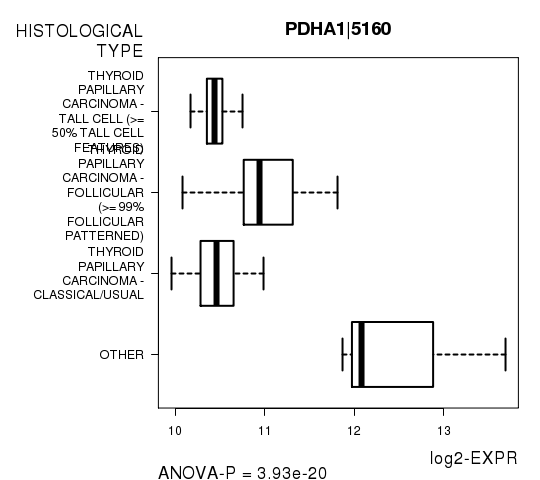
Table S6. Get Full Table List of top 10 genes differentially expressed by 'HISTOLOGICAL.TYPE'
| ANOVA_P | Q | |
|---|---|---|
| PDHA1|5160 | 3.934e-20 | 7.06e-16 |
| GOT2|2806 | 3.811e-19 | 6.84e-15 |
| ITGA3|3675 | 1.303e-18 | 2.34e-14 |
| COQ9|57017 | 4.721e-18 | 8.47e-14 |
| KCNIP3|30818 | 5.276e-18 | 9.47e-14 |
| ALDH1B1|219 | 1.445e-17 | 2.59e-13 |
| ERBB3|2065 | 1.591e-17 | 2.85e-13 |
| MPZL2|10205 | 1.994e-17 | 3.58e-13 |
| LDLR|3949 | 8.447e-17 | 1.52e-12 |
| BRP44L|51660 | 1.088e-16 | 1.95e-12 |
Figure S3. Get High-res Image As an example, this figure shows the association of PDHA1|5160 to 'HISTOLOGICAL.TYPE'. P value = 3.93e-20 with ANOVA analysis.
19 genes related to 'RADIATIONS.RADIATION.REGIMENINDICATION'.
Table S7. Basic characteristics of clinical feature: 'RADIATIONS.RADIATION.REGIMENINDICATION'
| RADIATIONS.RADIATION.REGIMENINDICATION | Labels | N |
| NO | 11 | |
| YES | 105 | |
| Significant markers | N = 19 | |
| Higher in YES | 5 | |
| Higher in NO | 14 |
Table S8. Get Full Table List of top 10 genes differentially expressed by 'RADIATIONS.RADIATION.REGIMENINDICATION'
| T(pos if higher in 'YES') | ttestP | Q | AUC | |
|---|---|---|---|---|
| FLJ37543|285668 | 8.88 | 2.01e-12 | 3.6e-08 | 0.8627 |
| DNAH14|127602 | -8.4 | 1.136e-08 | 0.000203 | 0.9169 |
| ORC1L|4998 | -6.54 | 7.806e-08 | 0.0014 | 0.8165 |
| CUL7|9820 | -7.4 | 1.29e-07 | 0.00231 | 0.8857 |
| C14ORF180|400258 | 6.14 | 1.798e-07 | 0.00322 | 0.8889 |
| MCM10|55388 | -6.44 | 2.463e-07 | 0.00441 | 0.8043 |
| HCFC1|3054 | -7.15 | 3.502e-07 | 0.00627 | 0.8675 |
| ZNF695|57116 | -6.86 | 4.161e-07 | 0.00744 | 0.8519 |
| GINS1|9837 | -5.59 | 5.665e-07 | 0.0101 | 0.7913 |
| CDC45|8318 | -6.5 | 8.185e-07 | 0.0146 | 0.8444 |
Figure S4. Get High-res Image As an example, this figure shows the association of FLJ37543|285668 to 'RADIATIONS.RADIATION.REGIMENINDICATION'. P value = 2.01e-12 with T-test analysis.
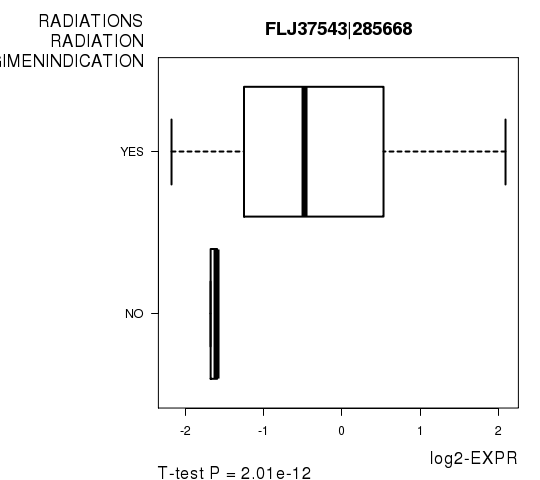
Table S9. Basic characteristics of clinical feature: 'NEOADJUVANT.THERAPY'
| NEOADJUVANT.THERAPY | Labels | N |
| NO | 3 | |
| YES | 113 | |
| Significant markers | N = 162 | |
| Higher in YES | 52 | |
| Higher in NO | 110 |
Table S10. Get Full Table List of top 10 genes differentially expressed by 'NEOADJUVANT.THERAPY'
| T(pos if higher in 'YES') | ttestP | Q | AUC | |
|---|---|---|---|---|
| SH2D1B|117157 | 17.6 | 7.888e-32 | 1.3e-27 | 0.9492 |
| L3MBTL|26013 | -16.28 | 3.506e-28 | 5.79e-24 | 0.944 |
| KDM5C|8242 | -14.37 | 1.534e-26 | 2.53e-22 | 0.9587 |
| SSR2|6746 | 13.67 | 1.515e-25 | 2.5e-21 | 0.9263 |
| ZNF512|84450 | -12.94 | 5.137e-24 | 8.49e-20 | 0.9351 |
| FCRL5|83416 | 15.05 | 2.726e-23 | 4.5e-19 | 0.9479 |
| ZNF418|147686 | -13.06 | 1.889e-20 | 3.12e-16 | 0.9558 |
| WBSCR22|114049 | 11.16 | 5.468e-20 | 9.03e-16 | 0.8643 |
| C1ORF104|284618 | -13.06 | 6.095e-20 | 1.01e-15 | 0.885 |
| SGSM1|129049 | -11.05 | 1.029e-19 | 1.7e-15 | 0.8938 |
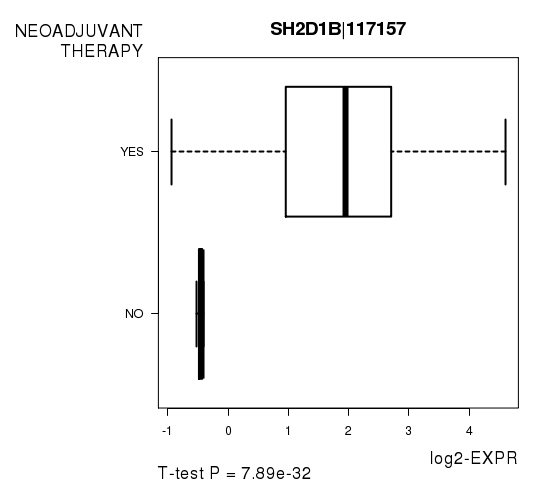
Figure S5. Get High-res Image As an example, this figure shows the association of SH2D1B|117157 to 'NEOADJUVANT.THERAPY'. P value = 7.89e-32 with T-test analysis.
-
Expresson data file = THCA.uncv2.mRNAseq_RSEM_normalized_log2.txt
-
Clinical data file = THCA.clin.merged.picked.txt
-
Number of patients = 116
-
Number of genes = 17948
-
Number of clinical features = 5
For continuous numerical clinical features, Spearman's rank correlation coefficients (Spearman 1904) and two-tailed P values were estimated using 'cor.test' function in R
For two-class clinical features, two-tailed Student's t test with unequal variance (Lehmann and Romano 2005) was applied to compare the log2-expression levels between the two clinical classes using 't.test' function in R
For multi-class clinical features (ordinal or nominal), one-way analysis of variance (Howell 2002) was applied to compare the log2-expression levels between different clinical classes using 'anova' function in R
For multiple hypothesis correction, Q value is the False Discovery Rate (FDR) analogue of the P value (Benjamini and Hochberg 1995), defined as the minimum FDR at which the test may be called significant. We used the 'Benjamini and Hochberg' method of 'p.adjust' function in R to convert P values into Q values.
This is an experimental feature. The full results of the analysis summarized in this report can be downloaded from the TCGA Data Coordination Center.