This pipeline uses various statistical tests to identify genes whose promoter methylation levels correlated to selected clinical features.
Testing the association between 20236 genes and 5 clinical features across 157 samples, statistically thresholded by Q value < 0.05, 5 clinical features related to at least one genes.
-
37 genes correlated to 'AGE'.
-
MGA , SPATA18 , PBX4 , CMTM2 , ZNF518B , ...
-
5 genes correlated to 'GENDER'.
-
KIF4B , FAM35A , GLUD1 , TLE1 , ANKRD20A4
-
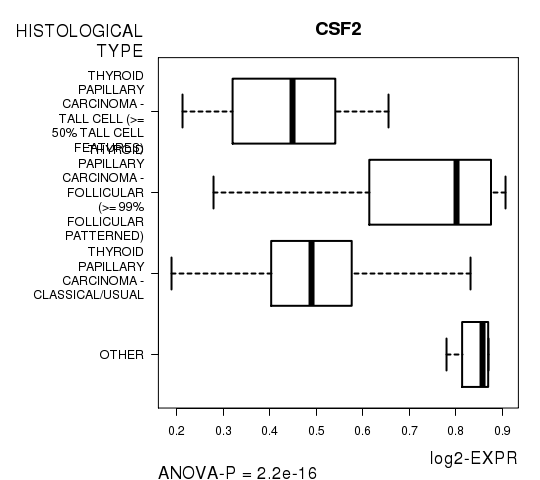
249 genes correlated to 'HISTOLOGICAL.TYPE'.
-
CSF2 , ARHGEF2 , PACSIN3 , LOC730755 , C5ORF62 , ...
-
3 genes correlated to 'RADIATIONS.RADIATION.REGIMENINDICATION'.
-
STX17 , PPM1E , DSCR9
-
176 genes correlated to 'NEOADJUVANT.THERAPY'.
-
POP1 , SEMA3F , SLC10A6 , DSN1 , PPM1J , ...
Complete statistical result table is provided in Supplement Table 1
Table 1. Get Full Table This table shows the clinical features, statistical methods used, and the number of genes that are significantly associated with each clinical feature at Q value < 0.05.
| Clinical feature | Statistical test | Significant genes | Associated with | Associated with | ||
|---|---|---|---|---|---|---|
| AGE | Spearman correlation test | N=37 | older | N=37 | younger | N=0 |
| GENDER | t test | N=5 | male | N=1 | female | N=4 |
| HISTOLOGICAL TYPE | ANOVA test | N=249 | ||||
| RADIATIONS RADIATION REGIMENINDICATION | t test | N=3 | yes | N=3 | no | N=0 |
| NEOADJUVANT THERAPY | t test | N=176 | yes | N=77 | no | N=99 |
Table S1. Basic characteristics of clinical feature: 'AGE'
| AGE | Mean (SD) | 46.72 (16) |
| Significant markers | N = 37 | |
| pos. correlated | 37 | |
| neg. correlated | 0 |
Table S2. Get Full Table List of top 10 genes significantly correlated to 'AGE' by Spearman correlation test
| SpearmanCorr | corrP | Q | |
|---|---|---|---|
| MGA | 0.5078 | 1.137e-11 | 2.3e-07 |
| SPATA18 | 0.503 | 1.906e-11 | 3.86e-07 |
| PBX4 | 0.4972 | 3.499e-11 | 7.08e-07 |
| CMTM2 | 0.4932 | 5.286e-11 | 1.07e-06 |
| ZNF518B | 0.4842 | 1.316e-10 | 2.66e-06 |
| GPR37 | 0.4753 | 3.184e-10 | 6.44e-06 |
| STAC2 | 0.4603 | 1.313e-09 | 2.66e-05 |
| SIPA1 | 0.4493 | 3.574e-09 | 7.23e-05 |
| ELOVL2 | 0.4463 | 4.661e-09 | 9.43e-05 |
| DHX40 | 0.4428 | 6.36e-09 | 0.000129 |
Figure S1. Get High-res Image As an example, this figure shows the association of MGA to 'AGE'. P value = 1.14e-11 with Spearman correlation analysis. The straight line presents the best linear regression.
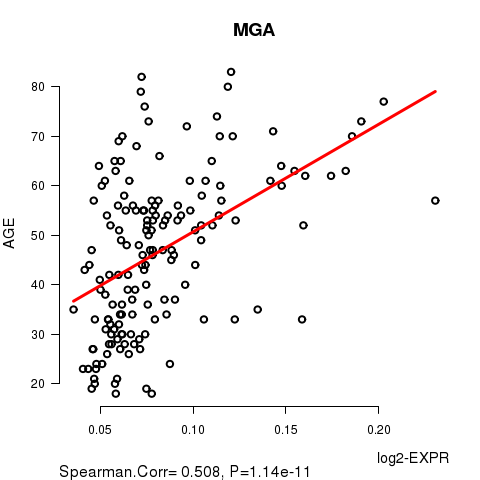
Table S3. Basic characteristics of clinical feature: 'GENDER'
| GENDER | Labels | N |
| FEMALE | 113 | |
| MALE | 44 | |
| Significant markers | N = 5 | |
| Higher in MALE | 1 | |
| Higher in FEMALE | 4 |
Table S4. Get Full Table List of 5 genes differentially expressed by 'GENDER'
| T(pos if higher in 'MALE') | ttestP | Q | AUC | |
|---|---|---|---|---|
| KIF4B | -8.54 | 1.988e-13 | 4.02e-09 | 0.8566 |
| FAM35A | -7.11 | 6.045e-10 | 1.22e-05 | 0.8455 |
| GLUD1 | -7.13 | 1.214e-09 | 2.46e-05 | 0.8315 |
| TLE1 | -6.43 | 2.013e-08 | 0.000407 | 0.8439 |
| ANKRD20A4 | 5 | 2.291e-06 | 0.0463 | 0.7671 |
Figure S2. Get High-res Image As an example, this figure shows the association of KIF4B to 'GENDER'. P value = 1.99e-13 with T-test analysis.
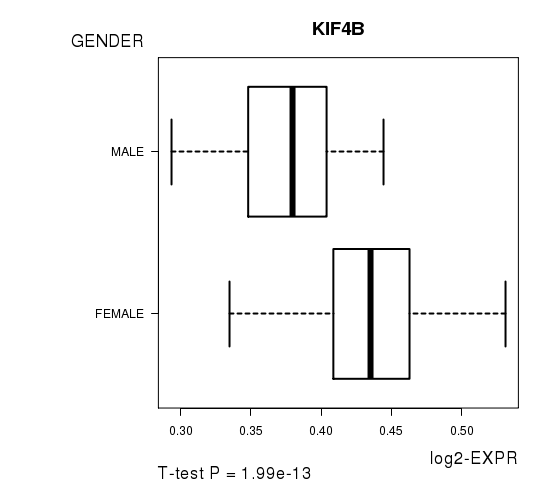
Table S5. Basic characteristics of clinical feature: 'HISTOLOGICAL.TYPE'
| HISTOLOGICAL.TYPE | Labels | N |
| OTHER | 4 | |
| THYROID PAPILLARY CARCINOMA - CLASSICAL/USUAL | 91 | |
| THYROID PAPILLARY CARCINOMA - FOLLICULAR (>= 99% FOLLICULAR PATTERNED) | 43 | |
| THYROID PAPILLARY CARCINOMA - TALL CELL (>= 50% TALL CELL FEATURES) | 19 | |
| Significant markers | N = 249 |
Table S6. Get Full Table List of top 10 genes differentially expressed by 'HISTOLOGICAL.TYPE'
| ANOVA_P | Q | |
|---|---|---|
| CSF2 | 2.205e-16 | 4.46e-12 |
| ARHGEF2 | 1.033e-15 | 2.09e-11 |
| PACSIN3 | 1.028e-14 | 2.08e-10 |
| LOC730755 | 1.309e-14 | 2.65e-10 |
| C5ORF62 | 3.023e-14 | 6.12e-10 |
| MIR21 | 3.308e-14 | 6.69e-10 |
| SLC34A2 | 4.799e-14 | 9.71e-10 |
| FUK | 6.523e-14 | 1.32e-09 |
| TNFRSF1A | 1.06e-13 | 2.14e-09 |
| MIR146B | 1.188e-13 | 2.4e-09 |
Figure S3. Get High-res Image As an example, this figure shows the association of CSF2 to 'HISTOLOGICAL.TYPE'. P value = 2.2e-16 with ANOVA analysis.
3 genes related to 'RADIATIONS.RADIATION.REGIMENINDICATION'.
Table S7. Basic characteristics of clinical feature: 'RADIATIONS.RADIATION.REGIMENINDICATION'
| RADIATIONS.RADIATION.REGIMENINDICATION | Labels | N |
| NO | 14 | |
| YES | 143 | |
| Significant markers | N = 3 | |
| Higher in YES | 3 | |
| Higher in NO | 0 |
Table S8. Get Full Table List of 3 genes differentially expressed by 'RADIATIONS.RADIATION.REGIMENINDICATION'
| T(pos if higher in 'YES') | ttestP | Q | AUC | |
|---|---|---|---|---|
| STX17 | 7.47 | 7.066e-12 | 1.43e-07 | 0.6993 |
| PPM1E | 5.81 | 6.135e-07 | 0.0124 | 0.7483 |
| DSCR9 | 5.49 | 6.448e-07 | 0.013 | 0.7488 |
Figure S4. Get High-res Image As an example, this figure shows the association of STX17 to 'RADIATIONS.RADIATION.REGIMENINDICATION'. P value = 7.07e-12 with T-test analysis.
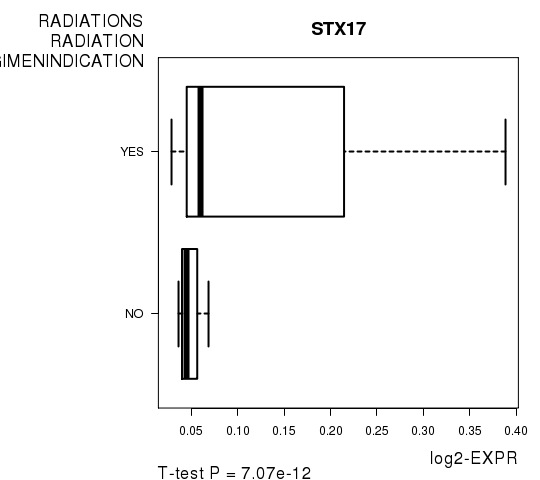
Table S9. Basic characteristics of clinical feature: 'NEOADJUVANT.THERAPY'
| NEOADJUVANT.THERAPY | Labels | N |
| NO | 3 | |
| YES | 154 | |
| Significant markers | N = 176 | |
| Higher in YES | 77 | |
| Higher in NO | 99 |
Table S10. Get Full Table List of top 10 genes differentially expressed by 'NEOADJUVANT.THERAPY'
| T(pos if higher in 'YES') | ttestP | Q | AUC | |
|---|---|---|---|---|
| POP1 | -21.09 | 5.595e-40 | 1.13e-35 | 0.9545 |
| SEMA3F | 14.24 | 4.122e-29 | 8.34e-25 | 0.9589 |
| SLC10A6 | 13.98 | 1.188e-28 | 2.4e-24 | 0.9697 |
| DSN1 | -14.21 | 1.548e-28 | 3.13e-24 | 0.9048 |
| PPM1J | -13.61 | 2.937e-28 | 5.94e-24 | 0.8528 |
| CCRL2 | -14.13 | 1.091e-27 | 2.21e-23 | 0.881 |
| C11ORF52 | 14.11 | 4.231e-27 | 8.56e-23 | 0.9351 |
| ECEL1P2 | 12.62 | 1.665e-25 | 3.37e-21 | 0.8831 |
| ALAS1 | 13.08 | 8.375e-23 | 1.69e-18 | 0.9177 |
| CCBL1 | -13.77 | 7.327e-21 | 1.48e-16 | 0.8874 |
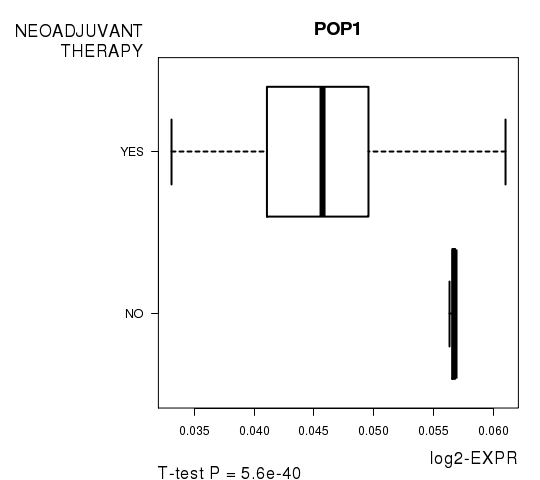
Figure S5. Get High-res Image As an example, this figure shows the association of POP1 to 'NEOADJUVANT.THERAPY'. P value = 5.6e-40 with T-test analysis.
-
Expresson data file = THCA.meth.for_correlation.filtered_data.txt
-
Clinical data file = THCA.clin.merged.picked.txt
-
Number of patients = 157
-
Number of genes = 20236
-
Number of clinical features = 5
For continuous numerical clinical features, Spearman's rank correlation coefficients (Spearman 1904) and two-tailed P values were estimated using 'cor.test' function in R
For two-class clinical features, two-tailed Student's t test with unequal variance (Lehmann and Romano 2005) was applied to compare the log2-expression levels between the two clinical classes using 't.test' function in R
For multi-class clinical features (ordinal or nominal), one-way analysis of variance (Howell 2002) was applied to compare the log2-expression levels between different clinical classes using 'anova' function in R
For multiple hypothesis correction, Q value is the False Discovery Rate (FDR) analogue of the P value (Benjamini and Hochberg 1995), defined as the minimum FDR at which the test may be called significant. We used the 'Benjamini and Hochberg' method of 'p.adjust' function in R to convert P values into Q values.
This is an experimental feature. The full results of the analysis summarized in this report can be downloaded from the TCGA Data Coordination Center.