This pipeline uses various statistical tests to identify miRs whose expression levels correlated to selected clinical features.
Testing the association between 533 genes and 5 clinical features across 150 samples, statistically thresholded by Q value < 0.05, 4 clinical features related to at least one genes.
-
1 gene correlated to 'AGE'.
-
HSA-MIR-1229
-
76 genes correlated to 'HISTOLOGICAL.TYPE'.
-
HSA-MIR-21 , HSA-MIR-146B , HSA-MIR-3926-1 , HSA-MIR-7-2 , HSA-MIR-31 , ...
-
8 genes correlated to 'RADIATIONS.RADIATION.REGIMENINDICATION'.
-
HSA-MIR-888 , HSA-MIR-3130-1 , HSA-MIR-1269 , HSA-MIR-2276 , HSA-MIR-374A , ...
-
3 genes correlated to 'NEOADJUVANT.THERAPY'.
-
HSA-MIR-9-1 , HSA-MIR-424 , HSA-MIR-129-1
-
No genes correlated to 'GENDER'
Complete statistical result table is provided in Supplement Table 1
Table 1. Get Full Table This table shows the clinical features, statistical methods used, and the number of genes that are significantly associated with each clinical feature at Q value < 0.05.
| Clinical feature | Statistical test | Significant genes | Associated with | Associated with | ||
|---|---|---|---|---|---|---|
| AGE | Spearman correlation test | N=1 | older | N=1 | younger | N=0 |
| GENDER | t test | N=0 | ||||
| HISTOLOGICAL TYPE | ANOVA test | N=76 | ||||
| RADIATIONS RADIATION REGIMENINDICATION | t test | N=8 | yes | N=6 | no | N=2 |
| NEOADJUVANT THERAPY | t test | N=3 | yes | N=2 | no | N=1 |
Table S1. Basic characteristics of clinical feature: 'AGE'
| AGE | Mean (SD) | 46.62 (16) |
| Significant markers | N = 1 | |
| pos. correlated | 1 | |
| neg. correlated | 0 |
Table S2. Get Full Table List of one gene significantly correlated to 'AGE' by Spearman correlation test
| SpearmanCorr | corrP | Q | |
|---|---|---|---|
| HSA-MIR-1229 | 0.3431 | 6.026e-05 | 0.0321 |
Figure S1. Get High-res Image As an example, this figure shows the association of HSA-MIR-1229 to 'AGE'. P value = 6.03e-05 with Spearman correlation analysis. The straight line presents the best linear regression.
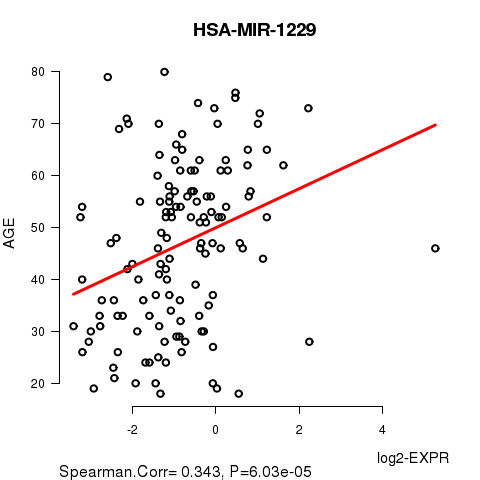
Table S3. Basic characteristics of clinical feature: 'GENDER'
| GENDER | Labels | N |
| FEMALE | 108 | |
| MALE | 42 | |
| Significant markers | N = 0 |
Table S4. Basic characteristics of clinical feature: 'HISTOLOGICAL.TYPE'
| HISTOLOGICAL.TYPE | Labels | N |
| OTHER | 6 | |
| THYROID PAPILLARY CARCINOMA - CLASSICAL/USUAL | 78 | |
| THYROID PAPILLARY CARCINOMA - FOLLICULAR (>= 99% FOLLICULAR PATTERNED) | 50 | |
| THYROID PAPILLARY CARCINOMA - TALL CELL (>= 50% TALL CELL FEATURES) | 16 | |
| Significant markers | N = 76 |
Table S5. Get Full Table List of top 10 genes differentially expressed by 'HISTOLOGICAL.TYPE'
| ANOVA_P | Q | |
|---|---|---|
| HSA-MIR-21 | 1.362e-17 | 7.26e-15 |
| HSA-MIR-146B | 2.206e-13 | 1.17e-10 |
| HSA-MIR-3926-1 | 4.126e-12 | 2.19e-09 |
| HSA-MIR-7-2 | 6.431e-11 | 3.41e-08 |
| HSA-MIR-31 | 1.927e-10 | 1.02e-07 |
| HSA-MIR-652 | 9.885e-10 | 5.22e-07 |
| HSA-MIR-345 | 1.427e-09 | 7.52e-07 |
| HSA-MIR-22 | 2.249e-09 | 1.18e-06 |
| HSA-MIR-30C-2 | 3.259e-09 | 1.71e-06 |
| HSA-MIR-511-1 | 3.483e-09 | 1.83e-06 |
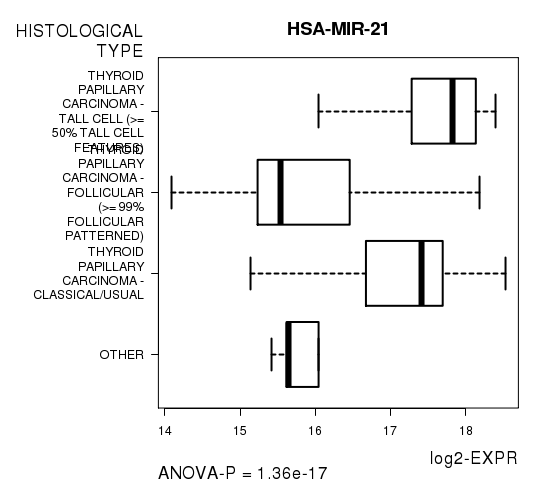
Figure S2. Get High-res Image As an example, this figure shows the association of HSA-MIR-21 to 'HISTOLOGICAL.TYPE'. P value = 1.36e-17 with ANOVA analysis.
8 genes related to 'RADIATIONS.RADIATION.REGIMENINDICATION'.
Table S6. Basic characteristics of clinical feature: 'RADIATIONS.RADIATION.REGIMENINDICATION'
| RADIATIONS.RADIATION.REGIMENINDICATION | Labels | N |
| NO | 14 | |
| YES | 136 | |
| Significant markers | N = 8 | |
| Higher in YES | 6 | |
| Higher in NO | 2 |
Table S7. Get Full Table List of 8 genes differentially expressed by 'RADIATIONS.RADIATION.REGIMENINDICATION'
| T(pos if higher in 'YES') | ttestP | Q | AUC | |
|---|---|---|---|---|
| HSA-MIR-888 | 6.02 | 4.502e-07 | 0.000237 | 0.8571 |
| HSA-MIR-3130-1 | -6.19 | 8.083e-07 | 0.000425 | 0.8102 |
| HSA-MIR-1269 | 5.6 | 1.515e-06 | 0.000796 | 0.845 |
| HSA-MIR-2276 | 5.93 | 3.052e-06 | 0.0016 | 0.7868 |
| HSA-MIR-374A | -5.5 | 1.842e-05 | 0.00964 | 0.8025 |
| HSA-MIR-324 | 5.11 | 2.586e-05 | 0.0135 | 0.7563 |
| HSA-MIR-1976 | 5.08 | 4.102e-05 | 0.0214 | 0.7883 |
| HSA-MIR-20B | 4.75 | 9.097e-05 | 0.0473 | 0.7646 |
Figure S3. Get High-res Image As an example, this figure shows the association of HSA-MIR-888 to 'RADIATIONS.RADIATION.REGIMENINDICATION'. P value = 4.5e-07 with T-test analysis.
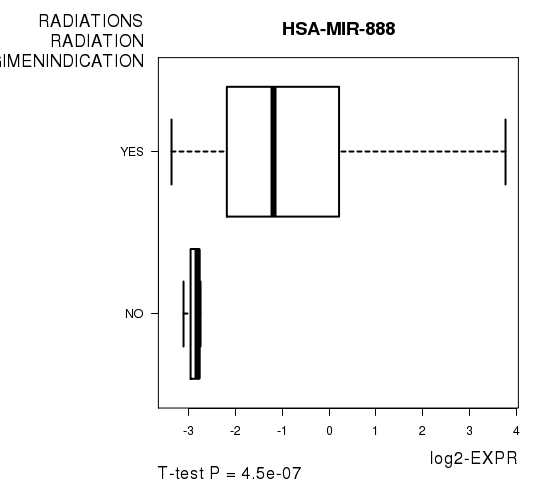
Table S8. Basic characteristics of clinical feature: 'NEOADJUVANT.THERAPY'
| NEOADJUVANT.THERAPY | Labels | N |
| NO | 3 | |
| YES | 147 | |
| Significant markers | N = 3 | |
| Higher in YES | 2 | |
| Higher in NO | 1 |
Table S9. Get Full Table List of 3 genes differentially expressed by 'NEOADJUVANT.THERAPY'
| T(pos if higher in 'YES') | ttestP | Q | AUC | |
|---|---|---|---|---|
| HSA-MIR-9-1 | 8.66 | 2.342e-10 | 8.88e-08 | 0.7937 |
| HSA-MIR-424 | -8.37 | 6.389e-08 | 2.42e-05 | 0.8299 |
| HSA-MIR-129-1 | 12.61 | 1.064e-07 | 4.01e-05 | 0.9 |
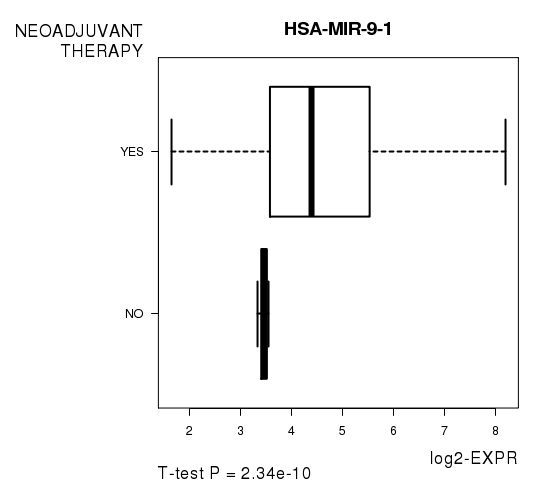
Figure S4. Get High-res Image As an example, this figure shows the association of HSA-MIR-9-1 to 'NEOADJUVANT.THERAPY'. P value = 2.34e-10 with T-test analysis.
-
Expresson data file = THCA.miRseq_RPKM_log2.txt
-
Clinical data file = THCA.clin.merged.picked.txt
-
Number of patients = 150
-
Number of genes = 533
-
Number of clinical features = 5
For continuous numerical clinical features, Spearman's rank correlation coefficients (Spearman 1904) and two-tailed P values were estimated using 'cor.test' function in R
For two-class clinical features, two-tailed Student's t test with unequal variance (Lehmann and Romano 2005) was applied to compare the log2-expression levels between the two clinical classes using 't.test' function in R
For multi-class clinical features (ordinal or nominal), one-way analysis of variance (Howell 2002) was applied to compare the log2-expression levels between different clinical classes using 'anova' function in R
For multiple hypothesis correction, Q value is the False Discovery Rate (FDR) analogue of the P value (Benjamini and Hochberg 1995), defined as the minimum FDR at which the test may be called significant. We used the 'Benjamini and Hochberg' method of 'p.adjust' function in R to convert P values into Q values.
This is an experimental feature. The full results of the analysis summarized in this report can be downloaded from the TCGA Data Coordination Center.