This pipeline uses various statistical tests to identify genes whose promoter methylation levels correlated to selected clinical features.
Testing the association between 20238 genes and 5 clinical features across 313 samples, statistically thresholded by Q value < 0.05, 5 clinical features related to at least one genes.
-
1 gene correlated to 'Time to Death'.
-
ACOT8
-
138 genes correlated to 'AGE'.
-
ZNF574 , SLFN14 , MIR1307 , MIR1249 , FBXO43 , ...
-
1556 genes correlated to 'HISTOLOGICAL.TYPE'.
-
UBE2T , SSTR1 , NPBWR2 , KCNA1 , CRYAB , ...
-
48 genes correlated to 'RADIATIONS.RADIATION.REGIMENINDICATION'.
-
AP3M1 , PCYT1A , CCDC159 , PPP1R11 , RNMTL1 , ...
-
6 genes correlated to 'NEOADJUVANT.THERAPY'.
-
SASS6 , LOC400927 , YIF1A , SOCS3 , GADD45G , ...
Complete statistical result table is provided in Supplement Table 1
Table 1. Get Full Table This table shows the clinical features, statistical methods used, and the number of genes that are significantly associated with each clinical feature at Q value < 0.05.
| Clinical feature | Statistical test | Significant genes | Associated with | Associated with | ||
|---|---|---|---|---|---|---|
| Time to Death | Cox regression test | N=1 | shorter survival | N=1 | longer survival | N=0 |
| AGE | Spearman correlation test | N=138 | older | N=79 | younger | N=59 |
| HISTOLOGICAL TYPE | ANOVA test | N=1556 | ||||
| RADIATIONS RADIATION REGIMENINDICATION | t test | N=48 | yes | N=48 | no | N=0 |
| NEOADJUVANT THERAPY | t test | N=6 | yes | N=6 | no | N=0 |
Table S1. Basic characteristics of clinical feature: 'Time to Death'
| Time to Death | Duration (Months) | 0-187.1 (median=12.8) |
| censored | N = 279 | |
| death | N = 30 | |
| Significant markers | N = 1 | |
| associated with shorter survival | 1 | |
| associated with longer survival | 0 |
Table S2. Get Full Table List of one gene significantly associated with 'Time to Death' by Cox regression test
| HazardRatio | Wald_P | Q | C_index | |
|---|---|---|---|---|
| ACOT8 | 310000000000001 | 1.727e-06 | 0.035 | 0.69 |
Figure S1. Get High-res Image As an example, this figure shows the association of ACOT8 to 'Time to Death'. four curves present the cumulative survival rates of 4 quartile subsets of patients. P value = 1.73e-06 with univariate Cox regression analysis using continuous log-2 expression values.
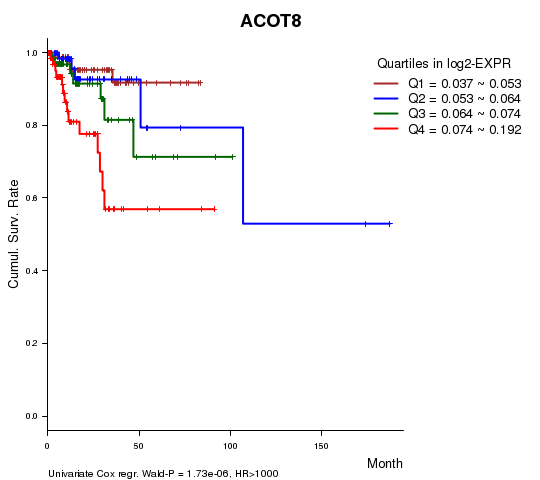
Table S3. Basic characteristics of clinical feature: 'AGE'
| AGE | Mean (SD) | 63.49 (11) |
| Significant markers | N = 138 | |
| pos. correlated | 79 | |
| neg. correlated | 59 |
Table S4. Get Full Table List of top 10 genes significantly correlated to 'AGE' by Spearman correlation test
| SpearmanCorr | corrP | Q | |
|---|---|---|---|
| ZNF574 | -0.3618 | 4.415e-11 | 8.93e-07 |
| SLFN14 | 0.3577 | 7.515e-11 | 1.52e-06 |
| MIR1307 | -0.355 | 1.066e-10 | 2.16e-06 |
| MIR1249 | 0.3432 | 4.738e-10 | 9.59e-06 |
| FBXO43 | -0.3397 | 7.27e-10 | 1.47e-05 |
| CLDN16 | -0.3344 | 1.373e-09 | 2.78e-05 |
| FBXL5 | -0.3316 | 1.918e-09 | 3.88e-05 |
| POLR2J | -0.3289 | 2.624e-09 | 5.31e-05 |
| TREM1 | 0.3283 | 2.832e-09 | 5.73e-05 |
| OTOR | 0.3277 | 3.023e-09 | 6.11e-05 |
Figure S2. Get High-res Image As an example, this figure shows the association of ZNF574 to 'AGE'. P value = 4.41e-11 with Spearman correlation analysis. The straight line presents the best linear regression.
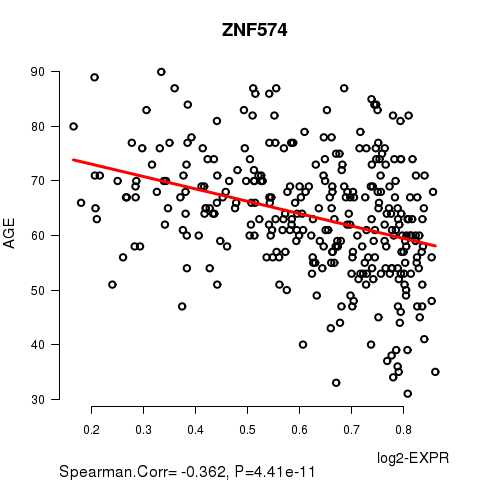
Table S5. Basic characteristics of clinical feature: 'HISTOLOGICAL.TYPE'
| HISTOLOGICAL.TYPE | Labels | N |
| ENDOMETRIOID ENDOMETRIAL ADENOCARCINOMA | 229 | |
| ENDOMETRIOID ENDOMETRIAL ADENOCARCINOMA (GRADE 1) | 6 | |
| ENDOMETRIOID ENDOMETRIAL ADENOCARCINOMA (GRADE 2) | 1 | |
| ENDOMETRIOID ENDOMETRIAL ADENOCARCINOMA (GRADE 3) | 3 | |
| MIXED SEROUS AND ENDOMETRIOID | 16 | |
| SEROUS ENDOMETRIAL ADENOCARCINOMA | 58 | |
| Significant markers | N = 1556 |
Table S6. Get Full Table List of top 10 genes differentially expressed by 'HISTOLOGICAL.TYPE'
| ANOVA_P | Q | |
|---|---|---|
| UBE2T | 4.831e-42 | 9.78e-38 |
| SSTR1 | 7.116e-34 | 1.44e-29 |
| NPBWR2 | 3.718e-33 | 7.52e-29 |
| KCNA1 | 1.888e-31 | 3.82e-27 |
| CRYAB | 2.548e-31 | 5.15e-27 |
| HSPB2 | 3.63e-31 | 7.34e-27 |
| SFMBT1 | 8.92e-28 | 1.8e-23 |
| GRIA4 | 1.274e-26 | 2.58e-22 |
| IDO1 | 2.62e-26 | 5.3e-22 |
| LOC400578 | 2.664e-25 | 5.39e-21 |
Figure S3. Get High-res Image As an example, this figure shows the association of UBE2T to 'HISTOLOGICAL.TYPE'. P value = 4.83e-42 with ANOVA analysis.

48 genes related to 'RADIATIONS.RADIATION.REGIMENINDICATION'.
Table S7. Basic characteristics of clinical feature: 'RADIATIONS.RADIATION.REGIMENINDICATION'
| RADIATIONS.RADIATION.REGIMENINDICATION | Labels | N |
| NO | 79 | |
| YES | 234 | |
| Significant markers | N = 48 | |
| Higher in YES | 48 | |
| Higher in NO | 0 |
Table S8. Get Full Table List of top 10 genes differentially expressed by 'RADIATIONS.RADIATION.REGIMENINDICATION'
| T(pos if higher in 'YES') | ttestP | Q | AUC | |
|---|---|---|---|---|
| AP3M1 | 6.09 | 8.254e-09 | 0.000167 | 0.7076 |
| PCYT1A | 5.93 | 1.842e-08 | 0.000373 | 0.6969 |
| CCDC159 | 5.76 | 2.853e-08 | 0.000577 | 0.6667 |
| PPP1R11 | 5.5 | 1.095e-07 | 0.00222 | 0.7095 |
| RNMTL1 | 5.49 | 1.302e-07 | 0.00264 | 0.6808 |
| YKT6 | 5.48 | 1.497e-07 | 0.00303 | 0.6868 |
| SSRP1 | 5.45 | 1.61e-07 | 0.00326 | 0.6714 |
| RFC2 | 5.53 | 1.698e-07 | 0.00344 | 0.6997 |
| PLEKHA3 | 5.33 | 2.32e-07 | 0.00469 | 0.6712 |
| NEK11 | 5.28 | 3.415e-07 | 0.00691 | 0.6956 |
Figure S4. Get High-res Image As an example, this figure shows the association of AP3M1 to 'RADIATIONS.RADIATION.REGIMENINDICATION'. P value = 8.25e-09 with T-test analysis.

Table S9. Basic characteristics of clinical feature: 'NEOADJUVANT.THERAPY'
| NEOADJUVANT.THERAPY | Labels | N |
| NO | 70 | |
| YES | 243 | |
| Significant markers | N = 6 | |
| Higher in YES | 6 | |
| Higher in NO | 0 |
Table S10. Get Full Table List of 6 genes differentially expressed by 'NEOADJUVANT.THERAPY'
| T(pos if higher in 'YES') | ttestP | Q | AUC | |
|---|---|---|---|---|
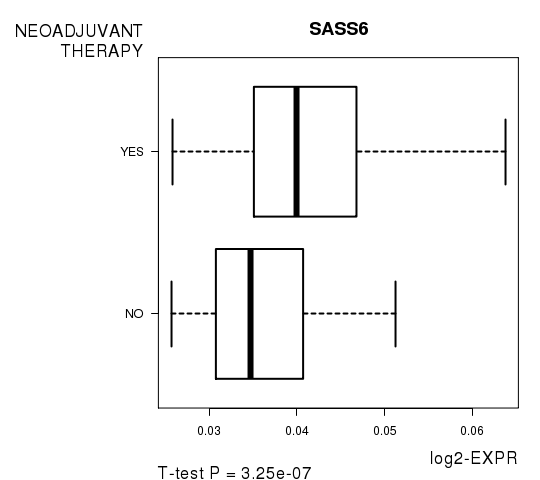
| SASS6 | 5.38 | 3.253e-07 | 0.00658 | 0.6848 |
| LOC400927 | 5.29 | 3.46e-07 | 0.007 | 0.6628 |
| YIF1A | 5.24 | 5.093e-07 | 0.0103 | 0.6681 |
| SOCS3 | 5.04 | 1.077e-06 | 0.0218 | 0.6466 |
| GADD45G | 4.94 | 2.065e-06 | 0.0418 | 0.668 |
| CCRN4L | 4.93 | 2.429e-06 | 0.0492 | 0.6751 |
Figure S5. Get High-res Image As an example, this figure shows the association of SASS6 to 'NEOADJUVANT.THERAPY'. P value = 3.25e-07 with T-test analysis.
-
Expresson data file = UCEC.meth.for_correlation.filtered_data.txt
-
Clinical data file = UCEC.clin.merged.picked.txt
-
Number of patients = 313
-
Number of genes = 20238
-
Number of clinical features = 5
For survival clinical features, Wald's test in univariate Cox regression analysis with proportional hazards model (Andersen and Gill 1982) was used to estimate the P values using the 'coxph' function in R. Kaplan-Meier survival curves were plot using the four quartile subgroups of patients based on expression levels
For continuous numerical clinical features, Spearman's rank correlation coefficients (Spearman 1904) and two-tailed P values were estimated using 'cor.test' function in R
For multi-class clinical features (ordinal or nominal), one-way analysis of variance (Howell 2002) was applied to compare the log2-expression levels between different clinical classes using 'anova' function in R
For two-class clinical features, two-tailed Student's t test with unequal variance (Lehmann and Romano 2005) was applied to compare the log2-expression levels between the two clinical classes using 't.test' function in R
For multiple hypothesis correction, Q value is the False Discovery Rate (FDR) analogue of the P value (Benjamini and Hochberg 1995), defined as the minimum FDR at which the test may be called significant. We used the 'Benjamini and Hochberg' method of 'p.adjust' function in R to convert P values into Q values.
This is an experimental feature. The full results of the analysis summarized in this report can be downloaded from the TCGA Data Coordination Center.