This pipeline uses various statistical tests to identify miRs whose expression levels correlated to selected clinical features.
Testing the association between 551 genes and 5 clinical features across 372 samples, statistically thresholded by Q value < 0.05, 2 clinical features related to at least one genes.
-
57 genes correlated to 'AGE'.
-
HSA-MIR-424 , HSA-MIR-497 , HSA-MIR-3920 , HSA-MIR-1247 , HSA-MIR-34A , ...
-
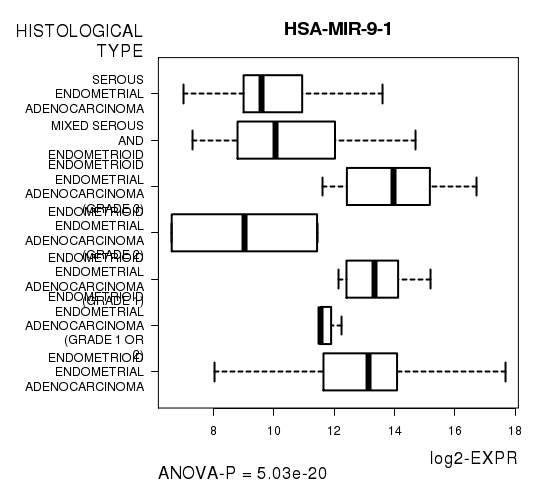
51 genes correlated to 'HISTOLOGICAL.TYPE'.
-
HSA-MIR-9-1 , HSA-MIR-9-2 , HSA-MIR-34A , HSA-MIR-497 , HSA-MIR-195 , ...
-
No genes correlated to 'Time to Death', 'RADIATIONS.RADIATION.REGIMENINDICATION', and 'NEOADJUVANT.THERAPY'.
Complete statistical result table is provided in Supplement Table 1
Table 1. Get Full Table This table shows the clinical features, statistical methods used, and the number of genes that are significantly associated with each clinical feature at Q value < 0.05.
| Clinical feature | Statistical test | Significant genes | Associated with | Associated with | ||
|---|---|---|---|---|---|---|
| Time to Death | Cox regression test | N=0 | ||||
| AGE | Spearman correlation test | N=57 | older | N=5 | younger | N=52 |
| HISTOLOGICAL TYPE | ANOVA test | N=51 | ||||
| RADIATIONS RADIATION REGIMENINDICATION | t test | N=0 | ||||
| NEOADJUVANT THERAPY | t test | N=0 |
Table S1. Basic characteristics of clinical feature: 'Time to Death'
| Time to Death | Duration (Months) | 0-187.1 (median=17.4) |
| censored | N = 340 | |
| death | N = 30 | |
| Significant markers | N = 0 |
Table S2. Basic characteristics of clinical feature: 'AGE'
| AGE | Mean (SD) | 63.18 (11) |
| Significant markers | N = 57 | |
| pos. correlated | 5 | |
| neg. correlated | 52 |
Table S3. Get Full Table List of top 10 genes significantly correlated to 'AGE' by Spearman correlation test
| SpearmanCorr | corrP | Q | |
|---|---|---|---|
| HSA-MIR-424 | -0.3251 | 1.327e-10 | 7.31e-08 |
| HSA-MIR-497 | -0.2981 | 4.512e-09 | 2.48e-06 |
| HSA-MIR-3920 | -0.3904 | 9.269e-09 | 5.09e-06 |
| HSA-MIR-1247 | -0.2862 | 2.012e-08 | 1.1e-05 |
| HSA-MIR-34A | -0.2837 | 2.586e-08 | 1.41e-05 |
| HSA-MIR-199A-1 | -0.2819 | 3.192e-08 | 1.74e-05 |
| HSA-MIR-214 | -0.2808 | 3.781e-08 | 2.06e-05 |
| HSA-MIR-199A-2 | -0.2765 | 5.949e-08 | 3.24e-05 |
| HSA-MIR-409 | -0.2753 | 6.762e-08 | 3.67e-05 |
| HSA-MIR-516A-2 | 0.3745 | 7.454e-08 | 4.04e-05 |
Figure S1. Get High-res Image As an example, this figure shows the association of HSA-MIR-424 to 'AGE'. P value = 1.33e-10 with Spearman correlation analysis. The straight line presents the best linear regression.
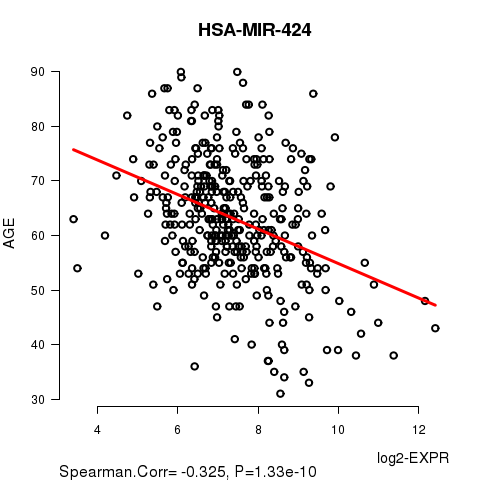
Table S4. Basic characteristics of clinical feature: 'HISTOLOGICAL.TYPE'
| HISTOLOGICAL.TYPE | Labels | N |
| ENDOMETRIOID ENDOMETRIAL ADENOCARCINOMA | 284 | |
| ENDOMETRIOID ENDOMETRIAL ADENOCARCINOMA (GRADE 1 OR 2) | 3 | |
| ENDOMETRIOID ENDOMETRIAL ADENOCARCINOMA (GRADE 1) | 9 | |
| ENDOMETRIOID ENDOMETRIAL ADENOCARCINOMA (GRADE 2) | 2 | |
| ENDOMETRIOID ENDOMETRIAL ADENOCARCINOMA (GRADE 3) | 7 | |
| MIXED SEROUS AND ENDOMETRIOID | 13 | |
| SEROUS ENDOMETRIAL ADENOCARCINOMA | 54 | |
| Significant markers | N = 51 |
Table S5. Get Full Table List of top 10 genes differentially expressed by 'HISTOLOGICAL.TYPE'
| ANOVA_P | Q | |
|---|---|---|
| HSA-MIR-9-1 | 5.025e-20 | 2.77e-17 |
| HSA-MIR-9-2 | 5.492e-20 | 3.02e-17 |
| HSA-MIR-34A | 3.478e-18 | 1.91e-15 |
| HSA-MIR-497 | 2.601e-16 | 1.43e-13 |
| HSA-MIR-195 | 3.199e-16 | 1.75e-13 |
| HSA-MIR-934 | 4.573e-16 | 2.5e-13 |
| HSA-MIR-548V | 7.244e-14 | 3.95e-11 |
| HSA-MIR-483 | 7.287e-14 | 3.96e-11 |
| HSA-MIR-375 | 1.139e-13 | 6.18e-11 |
| HSA-MIR-190B | 2.129e-10 | 1.15e-07 |
Figure S2. Get High-res Image As an example, this figure shows the association of HSA-MIR-9-1 to 'HISTOLOGICAL.TYPE'. P value = 5.03e-20 with ANOVA analysis.
No gene related to 'RADIATIONS.RADIATION.REGIMENINDICATION'.
Table S6. Basic characteristics of clinical feature: 'RADIATIONS.RADIATION.REGIMENINDICATION'
| RADIATIONS.RADIATION.REGIMENINDICATION | Labels | N |
| NO | 123 | |
| YES | 249 | |
| Significant markers | N = 0 |
-
Expresson data file = UCEC.miRseq_RPKM_log2.txt
-
Clinical data file = UCEC.clin.merged.picked.txt
-
Number of patients = 372
-
Number of genes = 551
-
Number of clinical features = 5
For survival clinical features, Wald's test in univariate Cox regression analysis with proportional hazards model (Andersen and Gill 1982) was used to estimate the P values using the 'coxph' function in R. Kaplan-Meier survival curves were plot using the four quartile subgroups of patients based on expression levels
For continuous numerical clinical features, Spearman's rank correlation coefficients (Spearman 1904) and two-tailed P values were estimated using 'cor.test' function in R
For multi-class clinical features (ordinal or nominal), one-way analysis of variance (Howell 2002) was applied to compare the log2-expression levels between different clinical classes using 'anova' function in R
For two-class clinical features, two-tailed Student's t test with unequal variance (Lehmann and Romano 2005) was applied to compare the log2-expression levels between the two clinical classes using 't.test' function in R
For multiple hypothesis correction, Q value is the False Discovery Rate (FDR) analogue of the P value (Benjamini and Hochberg 1995), defined as the minimum FDR at which the test may be called significant. We used the 'Benjamini and Hochberg' method of 'p.adjust' function in R to convert P values into Q values.
This is an experimental feature. The full results of the analysis summarized in this report can be downloaded from the TCGA Data Coordination Center.