This pipeline computes the correlation between significant arm-level copy number variations (cnvs) and selected clinical features.
Testing the association between copy number variation 65 arm-level results and 4 clinical features across 65 patients, one significant finding detected with Q value < 0.25.
-
21q loss cnv correlated to 'AGE'.
Table 1. Get Full Table Overview of the association between significant copy number variation of 65 arm-level results and 4 clinical features. Shown in the table are P values (Q values). Thresholded by Q value < 0.25, one significant finding detected.
|
Clinical Features |
Time to Death |
AGE | GENDER |
KARNOFSKY PERFORMANCE SCORE |
||
| nCNV (%) | nWild-Type | logrank test | t-test | Fisher's exact test | t-test | |
| 21q loss | 6 (9%) | 59 |
0.383 (1.00) |
0.000265 (0.0618) |
0.398 (1.00) |
0.028 (1.00) |
| 1p gain | 7 (11%) | 58 |
0.194 (1.00) |
0.606 (1.00) |
0.215 (1.00) |
|
| 1q gain | 14 (22%) | 51 |
0.0841 (1.00) |
0.0383 (1.00) |
0.527 (1.00) |
|
| 2p gain | 13 (20%) | 52 |
0.423 (1.00) |
0.701 (1.00) |
0.00649 (1.00) |
|
| 3p gain | 13 (20%) | 52 |
0.571 (1.00) |
0.743 (1.00) |
1 (1.00) |
0.51 (1.00) |
| 3q gain | 16 (25%) | 49 |
0.239 (1.00) |
0.0805 (1.00) |
0.137 (1.00) |
0.67 (1.00) |
| 4p gain | 6 (9%) | 59 |
0.164 (1.00) |
0.76 (1.00) |
0.655 (1.00) |
|
| 5p gain | 17 (26%) | 48 |
0.894 (1.00) |
0.63 (1.00) |
1 (1.00) |
0.233 (1.00) |
| 5q gain | 9 (14%) | 56 |
0.601 (1.00) |
0.329 (1.00) |
0.706 (1.00) |
0.233 (1.00) |
| 6p gain | 4 (6%) | 61 |
0.237 (1.00) |
0.55 (1.00) |
0.599 (1.00) |
|
| 7p gain | 19 (29%) | 46 |
0.227 (1.00) |
0.575 (1.00) |
1 (1.00) |
0.278 (1.00) |
| 7q gain | 19 (29%) | 46 |
0.431 (1.00) |
0.831 (1.00) |
0.399 (1.00) |
0.16 (1.00) |
| 8p gain | 10 (15%) | 55 |
0.796 (1.00) |
0.967 (1.00) |
1 (1.00) |
|
| 8q gain | 21 (32%) | 44 |
0.807 (1.00) |
0.848 (1.00) |
0.275 (1.00) |
0.861 (1.00) |
| 9p gain | 8 (12%) | 57 |
0.0403 (1.00) |
0.0601 (1.00) |
0.248 (1.00) |
0.861 (1.00) |
| 9q gain | 9 (14%) | 56 |
0.0685 (1.00) |
0.0508 (1.00) |
1 (1.00) |
0.703 (1.00) |
| 10p gain | 15 (23%) | 50 |
0.7 (1.00) |
0.214 (1.00) |
0.757 (1.00) |
0.861 (1.00) |
| 10q gain | 4 (6%) | 61 |
0.544 (1.00) |
0.426 (1.00) |
0.599 (1.00) |
|
| 11q gain | 3 (5%) | 62 |
0.654 (1.00) |
0.452 (1.00) |
0.545 (1.00) |
|
| 12p gain | 11 (17%) | 54 |
0.827 (1.00) |
0.763 (1.00) |
0.308 (1.00) |
|
| 12q gain | 11 (17%) | 54 |
0.44 (1.00) |
0.925 (1.00) |
0.082 (1.00) |
|
| 13q gain | 11 (17%) | 54 |
0.295 (1.00) |
0.329 (1.00) |
0.308 (1.00) |
0.206 (1.00) |
| 14q gain | 5 (8%) | 60 |
0.808 (1.00) |
0.932 (1.00) |
1 (1.00) |
0.533 (1.00) |
| 15q gain | 4 (6%) | 61 |
0.174 (1.00) |
0.851 (1.00) |
1 (1.00) |
|
| 16p gain | 5 (8%) | 60 |
0.00113 (0.263) |
0.472 (1.00) |
0.326 (1.00) |
|
| 16q gain | 6 (9%) | 59 |
0.00863 (1.00) |
0.25 (1.00) |
0.168 (1.00) |
|
| 17p gain | 4 (6%) | 61 |
0.355 (1.00) |
0.464 (1.00) |
0.599 (1.00) |
|
| 17q gain | 11 (17%) | 54 |
0.722 (1.00) |
0.558 (1.00) |
1 (1.00) |
|
| 18p gain | 11 (17%) | 54 |
0.555 (1.00) |
0.88 (1.00) |
1 (1.00) |
0.703 (1.00) |
| 18q gain | 6 (9%) | 59 |
0.0769 (1.00) |
0.856 (1.00) |
0.398 (1.00) |
|
| 19p gain | 5 (8%) | 60 |
0.698 (1.00) |
0.218 (1.00) |
0.326 (1.00) |
|
| 19q gain | 14 (22%) | 51 |
0.297 (1.00) |
0.927 (1.00) |
0.204 (1.00) |
0.206 (1.00) |
| 20p gain | 26 (40%) | 39 |
0.181 (1.00) |
0.796 (1.00) |
0.112 (1.00) |
0.26 (1.00) |
| 20q gain | 28 (43%) | 37 |
0.687 (1.00) |
0.971 (1.00) |
0.797 (1.00) |
0.87 (1.00) |
| 21q gain | 12 (18%) | 53 |
0.218 (1.00) |
0.382 (1.00) |
0.521 (1.00) |
0.703 (1.00) |
| 22q gain | 5 (8%) | 60 |
0.069 (1.00) |
0.633 (1.00) |
0.158 (1.00) |
0.703 (1.00) |
| Xq gain | 4 (6%) | 61 |
0.789 (1.00) |
0.168 (1.00) |
1 (1.00) |
|
| 2p loss | 3 (5%) | 62 |
0.854 (1.00) |
0.0065 (1.00) |
1 (1.00) |
0.925 (1.00) |
| 2q loss | 5 (8%) | 60 |
0.281 (1.00) |
0.146 (1.00) |
1 (1.00) |
0.925 (1.00) |
| 3p loss | 5 (8%) | 60 |
0.934 (1.00) |
0.234 (1.00) |
0.326 (1.00) |
|
| 4p loss | 11 (17%) | 54 |
0.578 (1.00) |
0.833 (1.00) |
0.487 (1.00) |
0.028 (1.00) |
| 4q loss | 12 (18%) | 53 |
0.719 (1.00) |
0.9 (1.00) |
1 (1.00) |
0.103 (1.00) |
| 5p loss | 7 (11%) | 58 |
0.118 (1.00) |
0.761 (1.00) |
0.215 (1.00) |
0.028 (1.00) |
| 5q loss | 14 (22%) | 51 |
0.334 (1.00) |
0.36 (1.00) |
0.527 (1.00) |
0.059 (1.00) |
| 6p loss | 6 (9%) | 59 |
0.243 (1.00) |
0.223 (1.00) |
1 (1.00) |
|
| 6q loss | 12 (18%) | 53 |
0.204 (1.00) |
0.799 (1.00) |
0.521 (1.00) |
0.0263 (1.00) |
| 8p loss | 18 (28%) | 47 |
0.16 (1.00) |
0.0792 (1.00) |
0.573 (1.00) |
0.699 (1.00) |
| 9p loss | 21 (32%) | 44 |
0.789 (1.00) |
0.766 (1.00) |
0.0992 (1.00) |
0.285 (1.00) |
| 9q loss | 18 (28%) | 47 |
0.631 (1.00) |
0.729 (1.00) |
0.257 (1.00) |
0.451 (1.00) |
| 10p loss | 8 (12%) | 57 |
0.24 (1.00) |
0.682 (1.00) |
1 (1.00) |
|
| 10q loss | 8 (12%) | 57 |
0.29 (1.00) |
0.602 (1.00) |
1 (1.00) |
|
| 11p loss | 23 (35%) | 42 |
0.44 (1.00) |
0.346 (1.00) |
0.587 (1.00) |
0.919 (1.00) |
| 11q loss | 19 (29%) | 46 |
0.456 (1.00) |
0.653 (1.00) |
1 (1.00) |
0.516 (1.00) |
| 12q loss | 3 (5%) | 62 |
0.613 (1.00) |
0.576 (1.00) |
0.545 (1.00) |
|
| 13q loss | 10 (15%) | 55 |
0.919 (1.00) |
0.492 (1.00) |
0.145 (1.00) |
|
| 14q loss | 13 (20%) | 52 |
0.26 (1.00) |
0.761 (1.00) |
0.516 (1.00) |
0.703 (1.00) |
| 15q loss | 8 (12%) | 57 |
0.532 (1.00) |
0.239 (1.00) |
0.427 (1.00) |
0.861 (1.00) |
| 16p loss | 7 (11%) | 58 |
0.229 (1.00) |
0.184 (1.00) |
0.408 (1.00) |
0.342 (1.00) |
| 16q loss | 6 (9%) | 59 |
0.524 (1.00) |
0.408 (1.00) |
0.655 (1.00) |
0.592 (1.00) |
| 17p loss | 19 (29%) | 46 |
0.0725 (1.00) |
0.11 (1.00) |
0.779 (1.00) |
0.53 (1.00) |
| 17q loss | 3 (5%) | 62 |
0.794 (1.00) |
0.874 (1.00) |
1 (1.00) |
|
| 18p loss | 8 (12%) | 57 |
0.276 (1.00) |
0.431 (1.00) |
0.427 (1.00) |
|
| 18q loss | 16 (25%) | 49 |
0.0675 (1.00) |
0.365 (1.00) |
0.137 (1.00) |
0.87 (1.00) |
| 19p loss | 3 (5%) | 62 |
0.569 (1.00) |
0.0062 (1.00) |
0.263 (1.00) |
|
| 22q loss | 14 (22%) | 51 |
0.439 (1.00) |
0.653 (1.00) |
0.0558 (1.00) |
0.588 (1.00) |
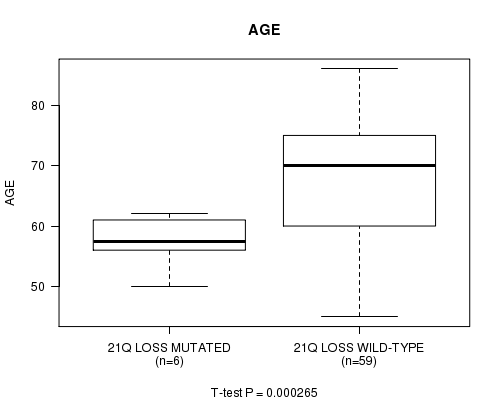
P value = 0.000265 (t-test), Q value = 0.062
Table S1. Gene #64: '21q loss mutation analysis' versus Clinical Feature #2: 'AGE'
| nPatients | Mean (Std.Dev) | |
|---|---|---|
| ALL | 65 | 67.7 (10.5) |
| 21Q LOSS MUTATED | 6 | 57.3 (4.4) |
| 21Q LOSS WILD-TYPE | 59 | 68.7 (10.3) |
Figure S1. Get High-res Image Gene #64: '21q loss mutation analysis' versus Clinical Feature #2: 'AGE'
-
Mutation data file = broad_values_by_arm.mutsig.cluster.txt
-
Clinical data file = BLCA.clin.merged.picked.txt
-
Number of patients = 65
-
Number of significantly arm-level cnvs = 65
-
Number of selected clinical features = 4
-
Exclude genes that fewer than K tumors have mutations, K = 3
For survival clinical features, the Kaplan-Meier survival curves of tumors with and without gene mutations were plotted and the statistical significance P values were estimated by logrank test (Bland and Altman 2004) using the 'survdiff' function in R
For continuous numerical clinical features, two-tailed Student's t test with unequal variance (Lehmann and Romano 2005) was applied to compare the clinical values between tumors with and without gene mutations using 't.test' function in R
For binary or multi-class clinical features (nominal or ordinal), two-tailed Fisher's exact tests (Fisher 1922) were used to estimate the P values using the 'fisher.test' function in R
For multiple hypothesis correction, Q value is the False Discovery Rate (FDR) analogue of the P value (Benjamini and Hochberg 1995), defined as the minimum FDR at which the test may be called significant. We used the 'Benjamini and Hochberg' method of 'p.adjust' function in R to convert P values into Q values.
This is an experimental feature. The full results of the analysis summarized in this report can be downloaded from the TCGA Data Coordination Center.