This pipeline computes the correlation between cancer subtypes identified by different molecular patterns and selected clinical features.
Testing the association between subtypes identified by 8 different clustering approaches and 4 clinical features across 68 patients, 4 significant findings detected with P value < 0.05.
-
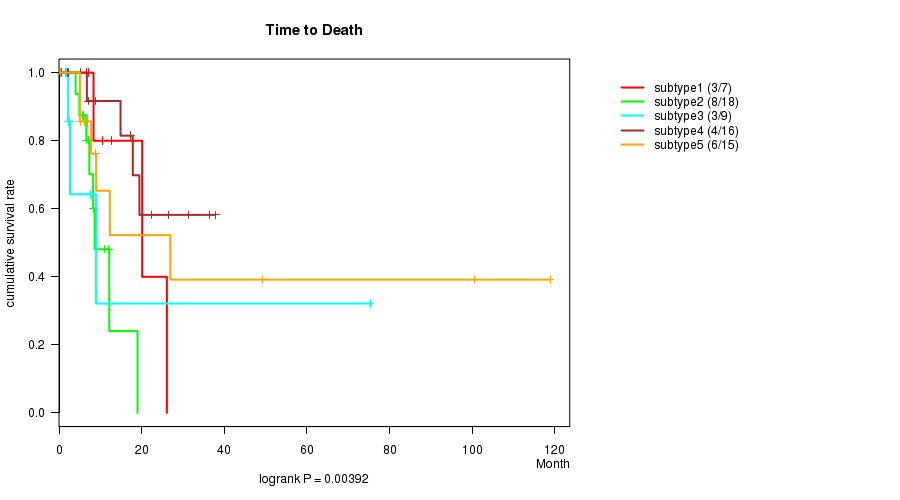
5 subtypes identified in current cancer cohort by 'CN CNMF'. These subtypes correlate to 'Time to Death'.
-
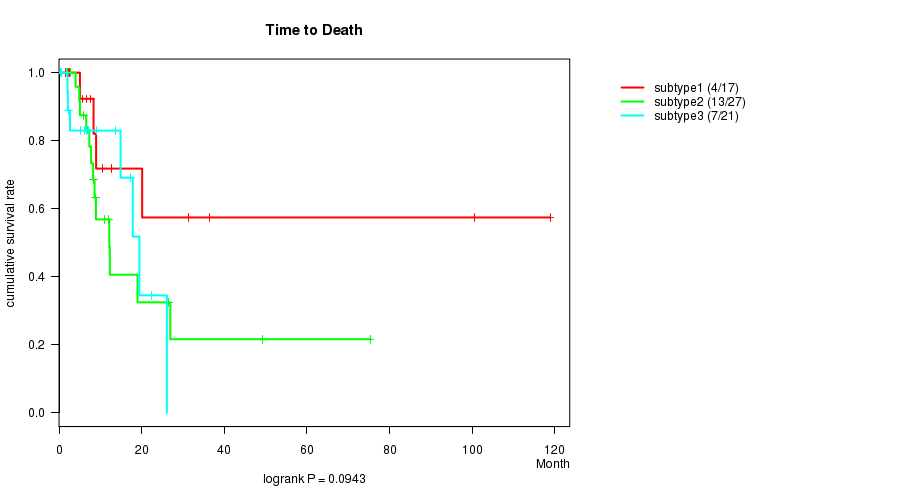
3 subtypes identified in current cancer cohort by 'METHLYATION CNMF'. These subtypes do not correlate to any clinical features.
-
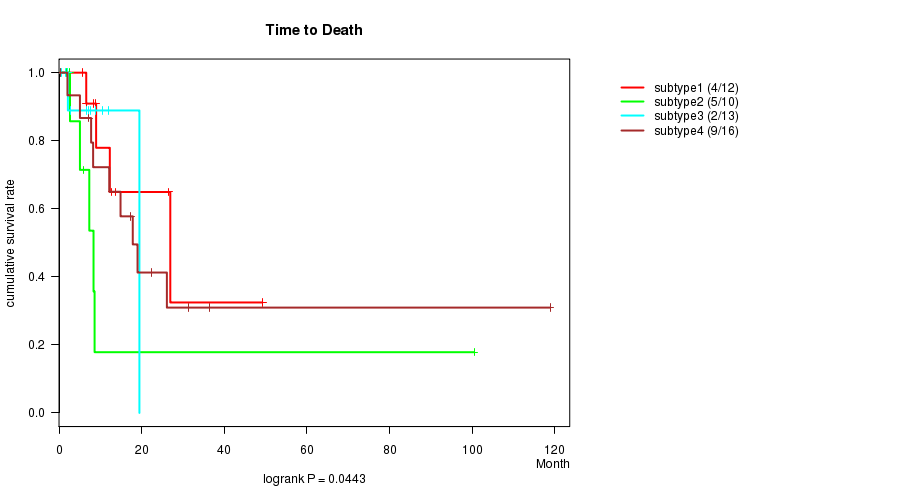
CNMF clustering analysis on RPPA data identified 4 subtypes that correlate to 'Time to Death'.
-
Consensus hierarchical clustering analysis on RPPA data identified 3 subtypes that do not correlate to any clinical features.
-
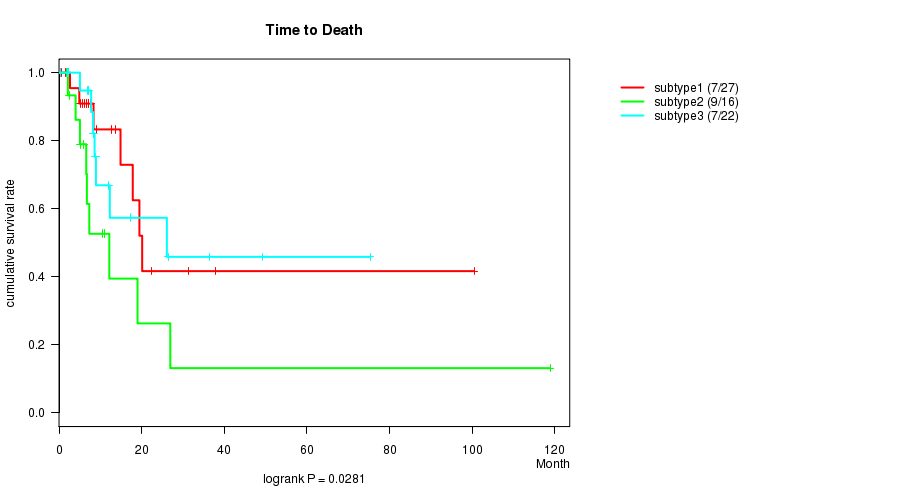
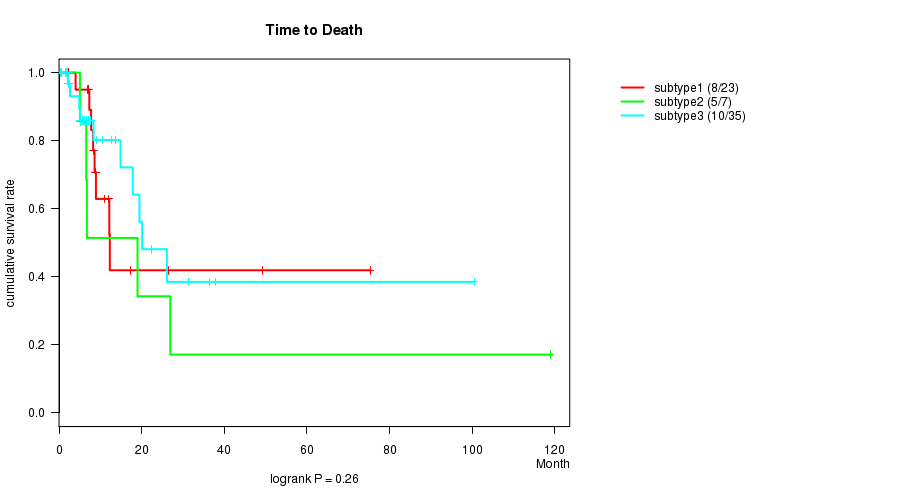
CNMF clustering analysis on sequencing-based mRNA expression data identified 3 subtypes that correlate to 'Time to Death'.
-
Consensus hierarchical clustering analysis on sequencing-based mRNA expression data identified 3 subtypes that do not correlate to any clinical features.
-
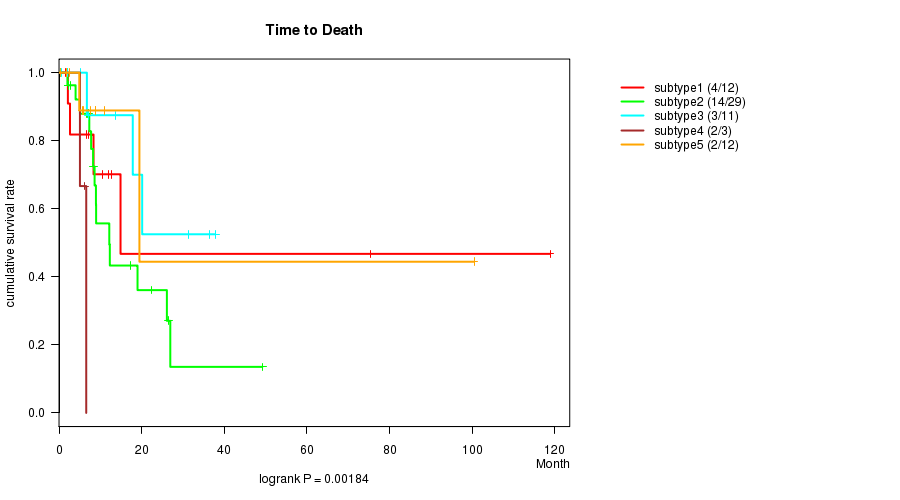
CNMF clustering analysis on sequencing-based miR expression data identified 5 subtypes that correlate to 'Time to Death'.
-
Consensus hierarchical clustering analysis on sequencing-based miR expression data identified 2 subtypes that do not correlate to any clinical features.
Table 1. Get Full Table Overview of the association between subtypes identified by 8 different clustering approaches and 4 clinical features. Shown in the table are P values from statistical tests. Thresholded by P value < 0.05, 4 significant findings detected.
|
Clinical Features |
Time to Death |
AGE | GENDER |
KARNOFSKY PERFORMANCE SCORE |
| Statistical Tests | logrank test | t-test | Fisher's exact test | t-test |
| CN CNMF | 0.00392 | 0.728 | 0.821 | 0.87 |
| METHLYATION CNMF | 0.0943 | 0.592 | 0.133 | 0.713 |
| RPPA CNMF subtypes | 0.0443 | 0.362 | 0.699 | 0.465 |
| RPPA cHierClus subtypes | 0.111 | 0.15 | 0.302 | 0.342 |
| RNAseq CNMF subtypes | 0.0281 | 0.453 | 0.38 | 0.68 |
| RNAseq cHierClus subtypes | 0.26 | 0.946 | 0.521 | 0.404 |
| MIRseq CNMF subtypes | 0.00184 | 0.545 | 0.942 | 0.573 |
| MIRseq cHierClus subtypes | 0.563 | 0.107 | 1 |
Table S1. Get Full Table Description of clustering approach #1: 'CN CNMF'
| Cluster Labels | 1 | 2 | 3 | 4 | 5 |
|---|---|---|---|---|---|
| Number of samples | 7 | 18 | 9 | 16 | 15 |
P value = 0.00392 (logrank test)
Table S2. Clustering Approach #1: 'CN CNMF' versus Clinical Feature #1: 'Time to Death'
| nPatients | nDeath | Duration Range (Median), Month | |
|---|---|---|---|
| ALL | 65 | 24 | 0.4 - 118.9 (7.8) |
| subtype1 | 7 | 3 | 6.7 - 26.1 (10.6) |
| subtype2 | 18 | 8 | 1.5 - 19.0 (7.1) |
| subtype3 | 9 | 3 | 0.5 - 75.3 (2.5) |
| subtype4 | 16 | 4 | 0.7 - 37.8 (16.1) |
| subtype5 | 15 | 6 | 0.4 - 118.9 (8.8) |
Figure S1. Get High-res Image Clustering Approach #1: 'CN CNMF' versus Clinical Feature #1: 'Time to Death'
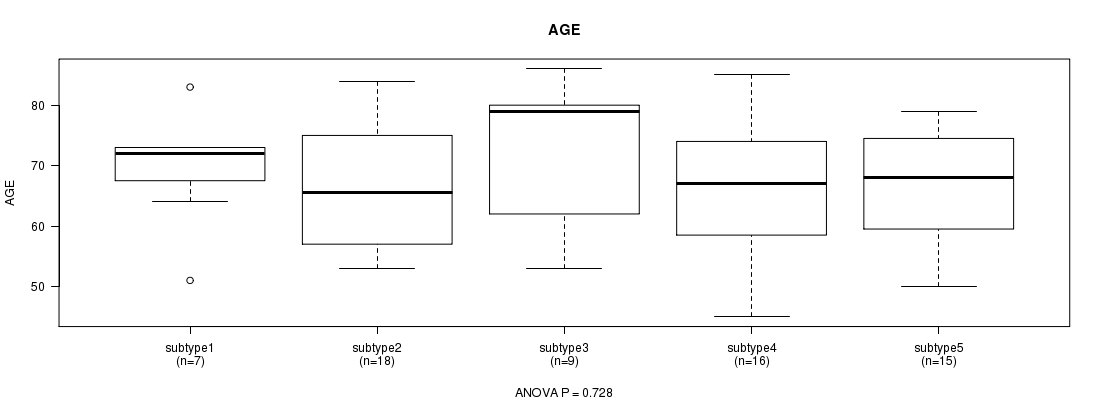
P value = 0.728 (ANOVA)
Table S3. Clustering Approach #1: 'CN CNMF' versus Clinical Feature #2: 'AGE'
| nPatients | Mean (Std.Dev) | |
|---|---|---|
| ALL | 65 | 67.7 (10.5) |
| subtype1 | 7 | 69.6 (9.9) |
| subtype2 | 18 | 66.6 (10.9) |
| subtype3 | 9 | 71.8 (11.8) |
| subtype4 | 16 | 66.5 (11.5) |
| subtype5 | 15 | 66.8 (8.8) |
Figure S2. Get High-res Image Clustering Approach #1: 'CN CNMF' versus Clinical Feature #2: 'AGE'
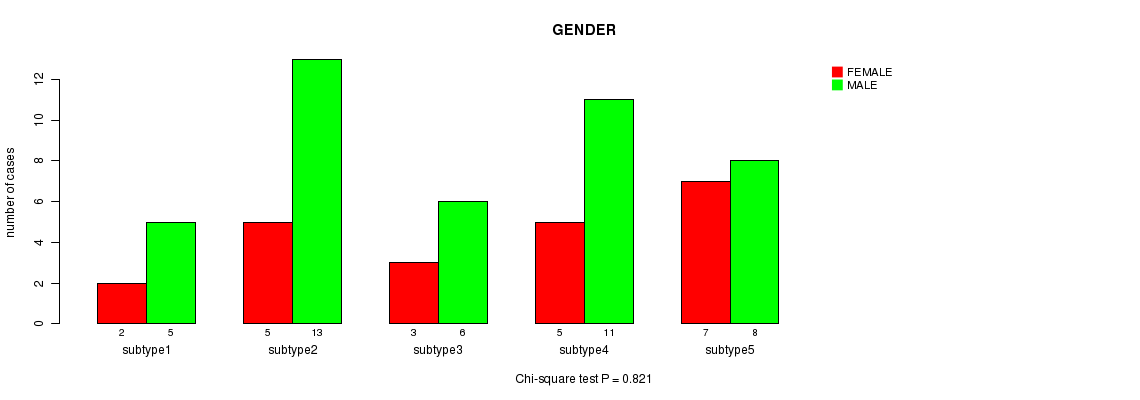
P value = 0.821 (Chi-square test)
Table S4. Clustering Approach #1: 'CN CNMF' versus Clinical Feature #3: 'GENDER'
| nPatients | FEMALE | MALE |
|---|---|---|
| ALL | 22 | 43 |
| subtype1 | 2 | 5 |
| subtype2 | 5 | 13 |
| subtype3 | 3 | 6 |
| subtype4 | 5 | 11 |
| subtype5 | 7 | 8 |
Figure S3. Get High-res Image Clustering Approach #1: 'CN CNMF' versus Clinical Feature #3: 'GENDER'
P value = 0.87 (ANOVA)
Table S5. Clustering Approach #1: 'CN CNMF' versus Clinical Feature #4: 'KARNOFSKY.PERFORMANCE.SCORE'
| nPatients | Mean (Std.Dev) | |
|---|---|---|
| ALL | 16 | 79.4 (17.7) |
| subtype1 | 1 | 80.0 (NA) |
| subtype2 | 1 | 90.0 (NA) |
| subtype3 | 1 | 70.0 (NA) |
| subtype4 | 8 | 80.0 (19.3) |
| subtype5 | 5 | 78.0 (21.7) |
Figure S4. Get High-res Image Clustering Approach #1: 'CN CNMF' versus Clinical Feature #4: 'KARNOFSKY.PERFORMANCE.SCORE'
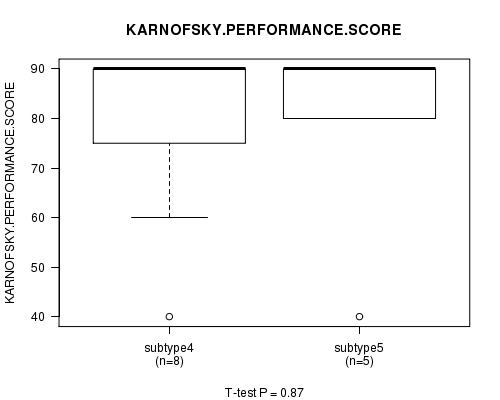
Table S6. Get Full Table Description of clustering approach #2: 'METHLYATION CNMF'
| Cluster Labels | 1 | 2 | 3 |
|---|---|---|---|
| Number of samples | 17 | 27 | 21 |
P value = 0.0943 (logrank test)
Table S7. Clustering Approach #2: 'METHLYATION CNMF' versus Clinical Feature #1: 'Time to Death'
| nPatients | nDeath | Duration Range (Median), Month | |
|---|---|---|---|
| ALL | 65 | 24 | 0.4 - 118.9 (7.8) |
| subtype1 | 17 | 4 | 1.5 - 118.9 (8.3) |
| subtype2 | 27 | 13 | 0.4 - 75.3 (8.3) |
| subtype3 | 21 | 7 | 0.5 - 26.1 (7.0) |
Figure S5. Get High-res Image Clustering Approach #2: 'METHLYATION CNMF' versus Clinical Feature #1: 'Time to Death'
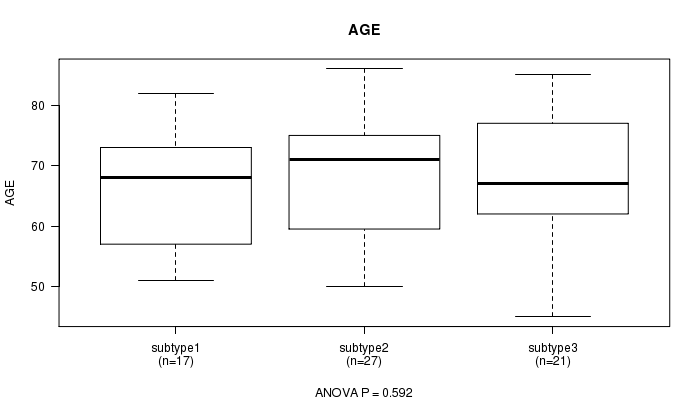
P value = 0.592 (ANOVA)
Table S8. Clustering Approach #2: 'METHLYATION CNMF' versus Clinical Feature #2: 'AGE'
| nPatients | Mean (Std.Dev) | |
|---|---|---|
| ALL | 65 | 68.0 (10.5) |
| subtype1 | 17 | 65.8 (10.2) |
| subtype2 | 27 | 69.1 (10.5) |
| subtype3 | 21 | 68.2 (10.7) |
Figure S6. Get High-res Image Clustering Approach #2: 'METHLYATION CNMF' versus Clinical Feature #2: 'AGE'
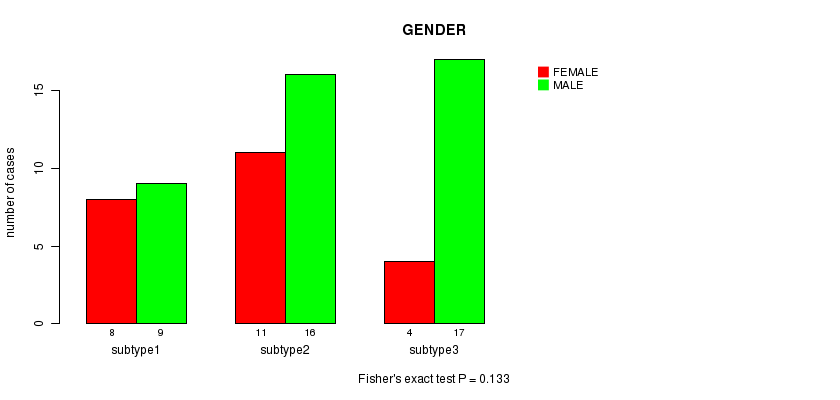
P value = 0.133 (Fisher's exact test)
Table S9. Clustering Approach #2: 'METHLYATION CNMF' versus Clinical Feature #3: 'GENDER'
| nPatients | FEMALE | MALE |
|---|---|---|
| ALL | 23 | 42 |
| subtype1 | 8 | 9 |
| subtype2 | 11 | 16 |
| subtype3 | 4 | 17 |
Figure S7. Get High-res Image Clustering Approach #2: 'METHLYATION CNMF' versus Clinical Feature #3: 'GENDER'
P value = 0.713 (ANOVA)
Table S10. Clustering Approach #2: 'METHLYATION CNMF' versus Clinical Feature #4: 'KARNOFSKY.PERFORMANCE.SCORE'
| nPatients | Mean (Std.Dev) | |
|---|---|---|
| ALL | 16 | 79.4 (17.7) |
| subtype1 | 3 | 86.7 (5.8) |
| subtype2 | 4 | 75.0 (23.8) |
| subtype3 | 9 | 78.9 (18.3) |
Figure S8. Get High-res Image Clustering Approach #2: 'METHLYATION CNMF' versus Clinical Feature #4: 'KARNOFSKY.PERFORMANCE.SCORE'
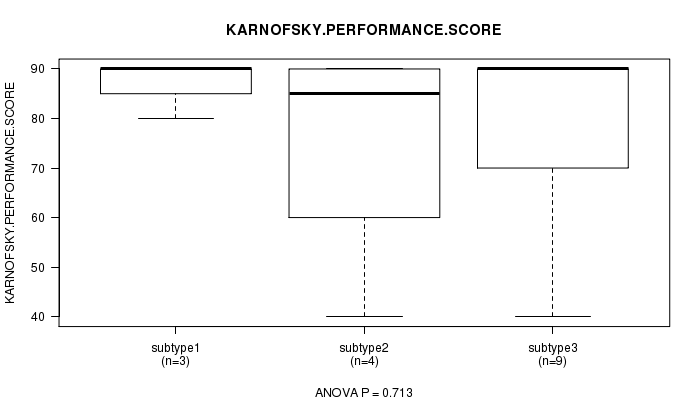
Table S11. Get Full Table Description of clustering approach #3: 'RPPA CNMF subtypes'
| Cluster Labels | 1 | 2 | 3 | 4 |
|---|---|---|---|---|
| Number of samples | 12 | 10 | 13 | 16 |
P value = 0.0443 (logrank test)
Table S12. Clustering Approach #3: 'RPPA CNMF subtypes' versus Clinical Feature #1: 'Time to Death'
| nPatients | nDeath | Duration Range (Median), Month | |
|---|---|---|---|
| ALL | 51 | 20 | 0.4 - 118.9 (8.3) |
| subtype1 | 12 | 4 | 5.7 - 49.2 (10.6) |
| subtype2 | 10 | 5 | 1.8 - 100.5 (5.5) |
| subtype3 | 13 | 2 | 0.5 - 19.5 (6.6) |
| subtype4 | 16 | 9 | 0.4 - 118.9 (16.1) |
Figure S9. Get High-res Image Clustering Approach #3: 'RPPA CNMF subtypes' versus Clinical Feature #1: 'Time to Death'
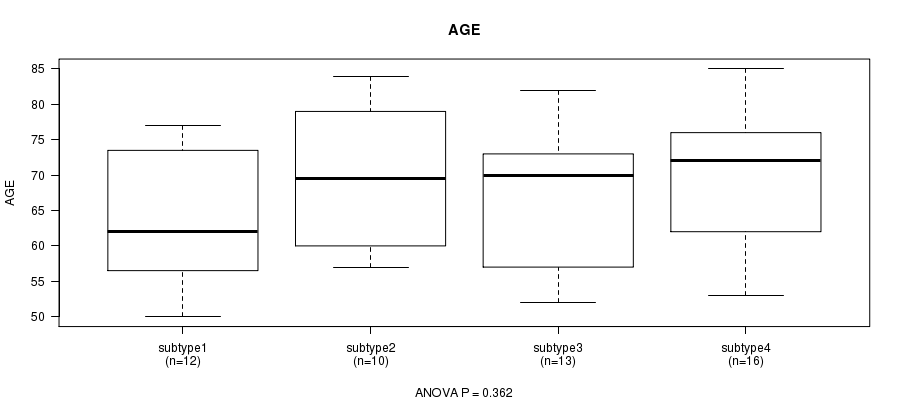
P value = 0.362 (ANOVA)
Table S13. Clustering Approach #3: 'RPPA CNMF subtypes' versus Clinical Feature #2: 'AGE'
| nPatients | Mean (Std.Dev) | |
|---|---|---|
| ALL | 51 | 67.6 (9.7) |
| subtype1 | 12 | 63.9 (9.2) |
| subtype2 | 10 | 69.5 (9.3) |
| subtype3 | 13 | 66.5 (10.2) |
| subtype4 | 16 | 70.0 (9.9) |
Figure S10. Get High-res Image Clustering Approach #3: 'RPPA CNMF subtypes' versus Clinical Feature #2: 'AGE'
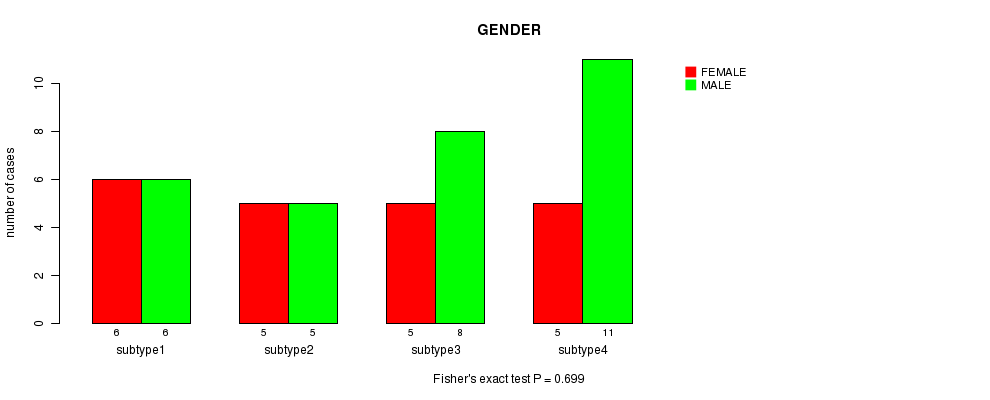
P value = 0.699 (Fisher's exact test)
Table S14. Clustering Approach #3: 'RPPA CNMF subtypes' versus Clinical Feature #3: 'GENDER'
| nPatients | FEMALE | MALE |
|---|---|---|
| ALL | 21 | 30 |
| subtype1 | 6 | 6 |
| subtype2 | 5 | 5 |
| subtype3 | 5 | 8 |
| subtype4 | 5 | 11 |
Figure S11. Get High-res Image Clustering Approach #3: 'RPPA CNMF subtypes' versus Clinical Feature #3: 'GENDER'
P value = 0.465 (ANOVA)
Table S15. Clustering Approach #3: 'RPPA CNMF subtypes' versus Clinical Feature #4: 'KARNOFSKY.PERFORMANCE.SCORE'
| nPatients | Mean (Std.Dev) | |
|---|---|---|
| ALL | 11 | 80.0 (16.7) |
| subtype1 | 5 | 88.0 (4.5) |
| subtype2 | 1 | 70.0 (NA) |
| subtype3 | 1 | 60.0 (NA) |
| subtype4 | 4 | 77.5 (25.0) |
Figure S12. Get High-res Image Clustering Approach #3: 'RPPA CNMF subtypes' versus Clinical Feature #4: 'KARNOFSKY.PERFORMANCE.SCORE'
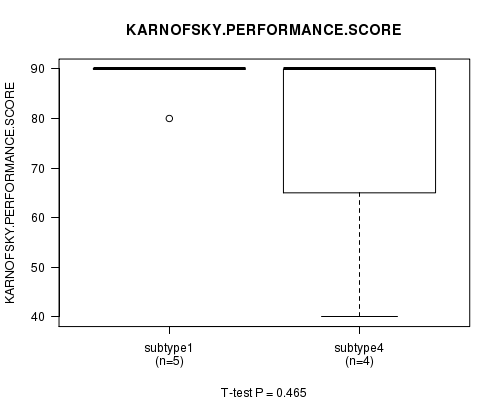
Table S16. Get Full Table Description of clustering approach #4: 'RPPA cHierClus subtypes'
| Cluster Labels | 1 | 2 | 3 |
|---|---|---|---|
| Number of samples | 14 | 17 | 20 |
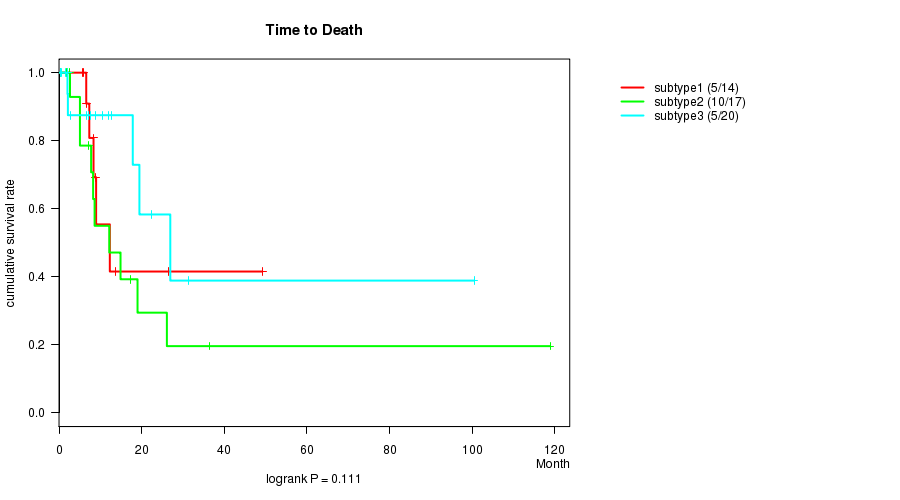
P value = 0.111 (logrank test)
Table S17. Clustering Approach #4: 'RPPA cHierClus subtypes' versus Clinical Feature #1: 'Time to Death'
| nPatients | nDeath | Duration Range (Median), Month | |
|---|---|---|---|
| ALL | 51 | 20 | 0.4 - 118.9 (8.3) |
| subtype1 | 14 | 5 | 1.9 - 49.2 (8.3) |
| subtype2 | 17 | 10 | 0.4 - 118.9 (8.2) |
| subtype3 | 20 | 5 | 0.5 - 100.5 (8.3) |
Figure S13. Get High-res Image Clustering Approach #4: 'RPPA cHierClus subtypes' versus Clinical Feature #1: 'Time to Death'
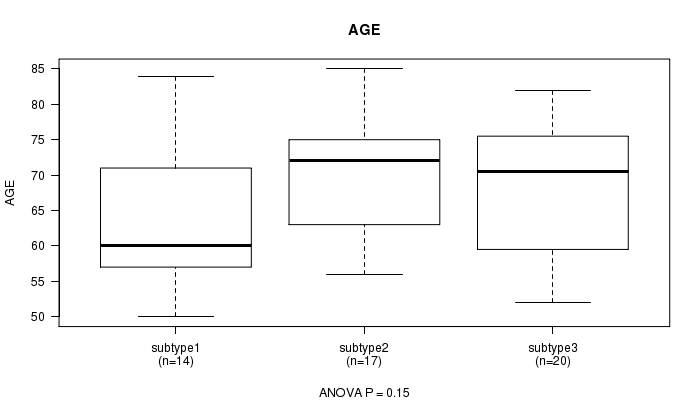
P value = 0.15 (ANOVA)
Table S18. Clustering Approach #4: 'RPPA cHierClus subtypes' versus Clinical Feature #2: 'AGE'
| nPatients | Mean (Std.Dev) | |
|---|---|---|
| ALL | 51 | 67.6 (9.7) |
| subtype1 | 14 | 63.5 (9.6) |
| subtype2 | 17 | 70.2 (9.0) |
| subtype3 | 20 | 68.2 (9.9) |
Figure S14. Get High-res Image Clustering Approach #4: 'RPPA cHierClus subtypes' versus Clinical Feature #2: 'AGE'
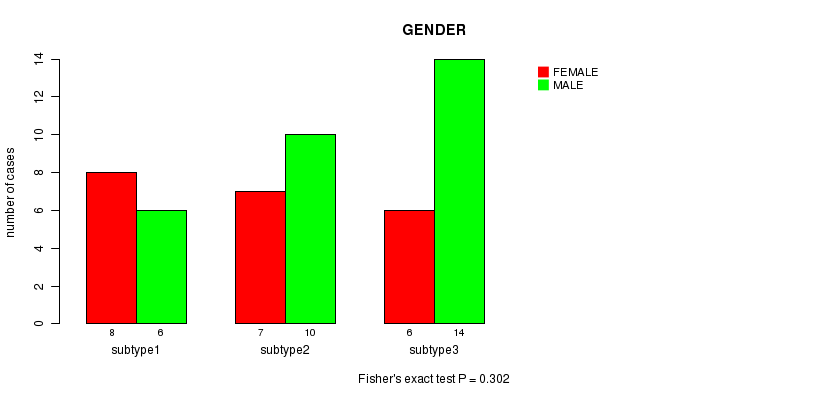
P value = 0.302 (Fisher's exact test)
Table S19. Clustering Approach #4: 'RPPA cHierClus subtypes' versus Clinical Feature #3: 'GENDER'
| nPatients | FEMALE | MALE |
|---|---|---|
| ALL | 21 | 30 |
| subtype1 | 8 | 6 |
| subtype2 | 7 | 10 |
| subtype3 | 6 | 14 |
Figure S15. Get High-res Image Clustering Approach #4: 'RPPA cHierClus subtypes' versus Clinical Feature #3: 'GENDER'
P value = 0.342 (ANOVA)
Table S20. Clustering Approach #4: 'RPPA cHierClus subtypes' versus Clinical Feature #4: 'KARNOFSKY.PERFORMANCE.SCORE'
| nPatients | Mean (Std.Dev) | |
|---|---|---|
| ALL | 11 | 80.0 (16.7) |
| subtype1 | 4 | 90.0 (0.0) |
| subtype2 | 4 | 72.5 (23.6) |
| subtype3 | 3 | 76.7 (15.3) |
Figure S16. Get High-res Image Clustering Approach #4: 'RPPA cHierClus subtypes' versus Clinical Feature #4: 'KARNOFSKY.PERFORMANCE.SCORE'
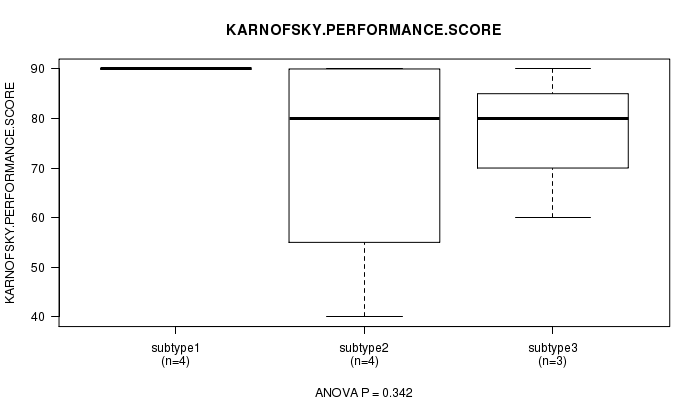
Table S21. Get Full Table Description of clustering approach #5: 'RNAseq CNMF subtypes'
| Cluster Labels | 1 | 2 | 3 |
|---|---|---|---|
| Number of samples | 27 | 16 | 22 |
P value = 0.0281 (logrank test)
Table S22. Clustering Approach #5: 'RNAseq CNMF subtypes' versus Clinical Feature #1: 'Time to Death'
| nPatients | nDeath | Duration Range (Median), Month | |
|---|---|---|---|
| ALL | 65 | 23 | 0.4 - 118.9 (7.8) |
| subtype1 | 27 | 7 | 0.5 - 100.5 (7.2) |
| subtype2 | 16 | 9 | 1.8 - 118.9 (6.7) |
| subtype3 | 22 | 7 | 0.4 - 75.3 (8.7) |
Figure S17. Get High-res Image Clustering Approach #5: 'RNAseq CNMF subtypes' versus Clinical Feature #1: 'Time to Death'
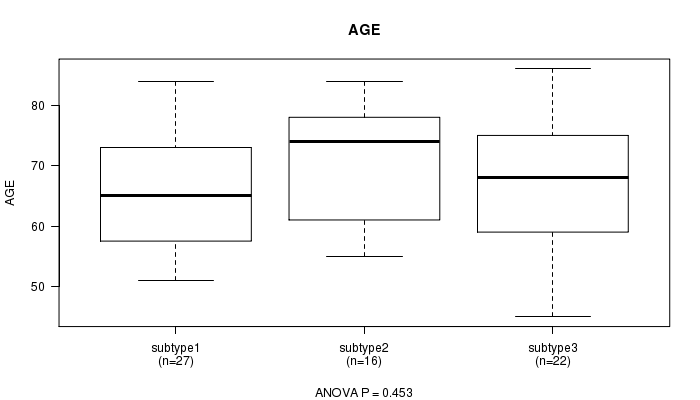
P value = 0.453 (ANOVA)
Table S23. Clustering Approach #5: 'RNAseq CNMF subtypes' versus Clinical Feature #2: 'AGE'
| nPatients | Mean (Std.Dev) | |
|---|---|---|
| ALL | 65 | 67.5 (10.5) |
| subtype1 | 27 | 66.1 (10.3) |
| subtype2 | 16 | 70.3 (9.5) |
| subtype3 | 22 | 67.1 (11.6) |
Figure S18. Get High-res Image Clustering Approach #5: 'RNAseq CNMF subtypes' versus Clinical Feature #2: 'AGE'
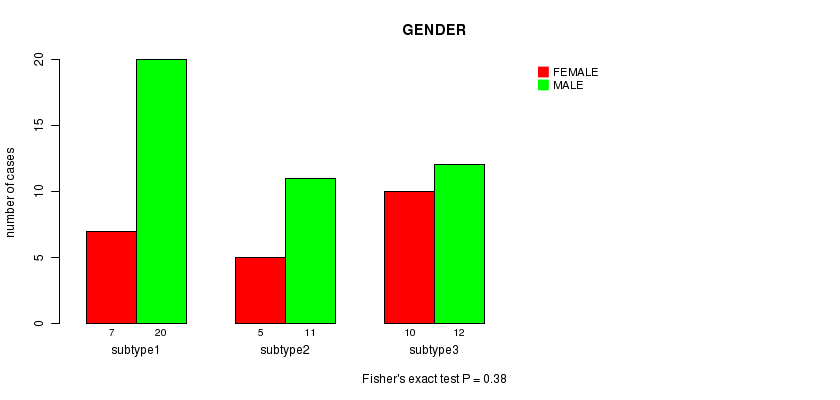
P value = 0.38 (Fisher's exact test)
Table S24. Clustering Approach #5: 'RNAseq CNMF subtypes' versus Clinical Feature #3: 'GENDER'
| nPatients | FEMALE | MALE |
|---|---|---|
| ALL | 22 | 43 |
| subtype1 | 7 | 20 |
| subtype2 | 5 | 11 |
| subtype3 | 10 | 12 |
Figure S19. Get High-res Image Clustering Approach #5: 'RNAseq CNMF subtypes' versus Clinical Feature #3: 'GENDER'
P value = 0.68 (ANOVA)
Table S25. Clustering Approach #5: 'RNAseq CNMF subtypes' versus Clinical Feature #4: 'KARNOFSKY.PERFORMANCE.SCORE'
| nPatients | Mean (Std.Dev) | |
|---|---|---|
| ALL | 17 | 80.0 (17.3) |
| subtype1 | 7 | 84.3 (11.3) |
| subtype2 | 3 | 80.0 (10.0) |
| subtype3 | 7 | 75.7 (24.4) |
Figure S20. Get High-res Image Clustering Approach #5: 'RNAseq CNMF subtypes' versus Clinical Feature #4: 'KARNOFSKY.PERFORMANCE.SCORE'
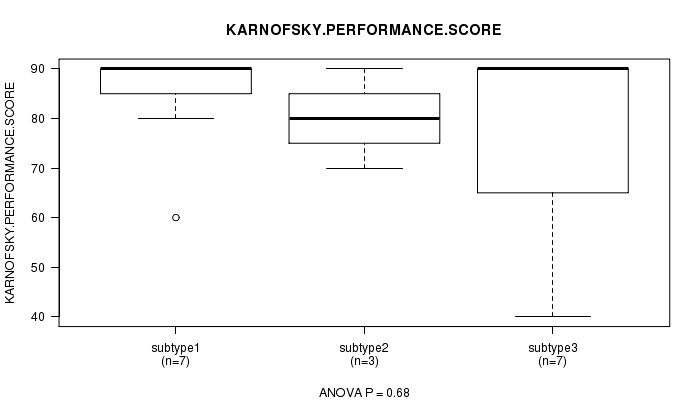
Table S26. Get Full Table Description of clustering approach #6: 'RNAseq cHierClus subtypes'
| Cluster Labels | 1 | 2 | 3 |
|---|---|---|---|
| Number of samples | 23 | 7 | 35 |
P value = 0.26 (logrank test)
Table S27. Clustering Approach #6: 'RNAseq cHierClus subtypes' versus Clinical Feature #1: 'Time to Death'
| nPatients | nDeath | Duration Range (Median), Month | |
|---|---|---|---|
| ALL | 65 | 23 | 0.4 - 118.9 (7.8) |
| subtype1 | 23 | 8 | 0.4 - 75.3 (8.6) |
| subtype2 | 7 | 5 | 5.1 - 118.9 (6.7) |
| subtype3 | 35 | 10 | 0.5 - 100.5 (7.0) |
Figure S21. Get High-res Image Clustering Approach #6: 'RNAseq cHierClus subtypes' versus Clinical Feature #1: 'Time to Death'
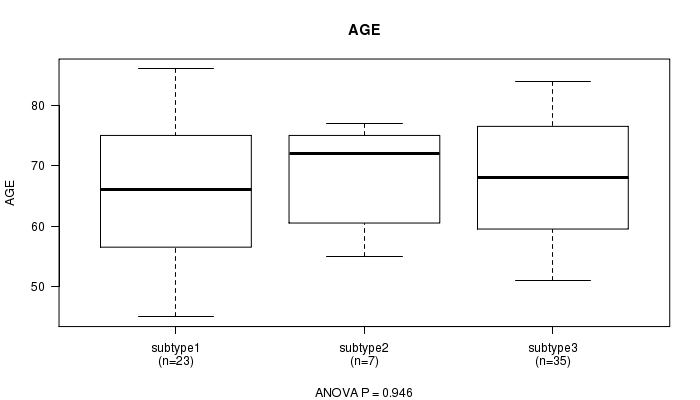
P value = 0.946 (ANOVA)
Table S28. Clustering Approach #6: 'RNAseq cHierClus subtypes' versus Clinical Feature #2: 'AGE'
| nPatients | Mean (Std.Dev) | |
|---|---|---|
| ALL | 65 | 67.5 (10.5) |
| subtype1 | 23 | 66.9 (11.6) |
| subtype2 | 7 | 67.9 (9.0) |
| subtype3 | 35 | 67.8 (10.3) |
Figure S22. Get High-res Image Clustering Approach #6: 'RNAseq cHierClus subtypes' versus Clinical Feature #2: 'AGE'
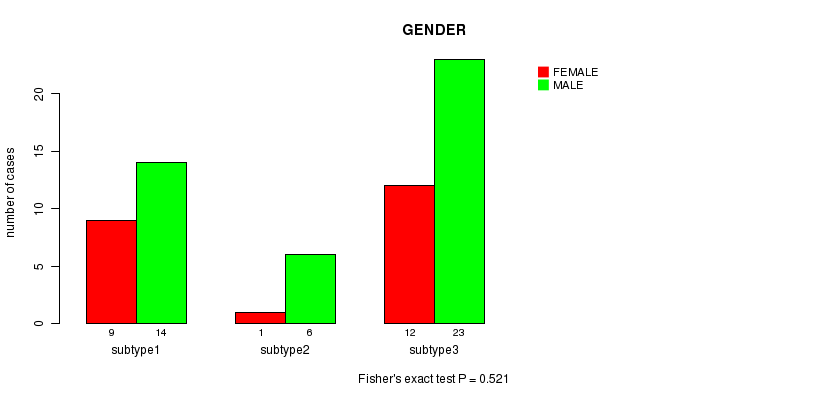
P value = 0.521 (Fisher's exact test)
Table S29. Clustering Approach #6: 'RNAseq cHierClus subtypes' versus Clinical Feature #3: 'GENDER'
| nPatients | FEMALE | MALE |
|---|---|---|
| ALL | 22 | 43 |
| subtype1 | 9 | 14 |
| subtype2 | 1 | 6 |
| subtype3 | 12 | 23 |
Figure S23. Get High-res Image Clustering Approach #6: 'RNAseq cHierClus subtypes' versus Clinical Feature #3: 'GENDER'
P value = 0.404 (ANOVA)
Table S30. Clustering Approach #6: 'RNAseq cHierClus subtypes' versus Clinical Feature #4: 'KARNOFSKY.PERFORMANCE.SCORE'
| nPatients | Mean (Std.Dev) | |
|---|---|---|
| ALL | 17 | 80.0 (17.3) |
| subtype1 | 6 | 73.3 (25.8) |
| subtype2 | 2 | 85.0 (7.1) |
| subtype3 | 9 | 83.3 (11.2) |
Figure S24. Get High-res Image Clustering Approach #6: 'RNAseq cHierClus subtypes' versus Clinical Feature #4: 'KARNOFSKY.PERFORMANCE.SCORE'
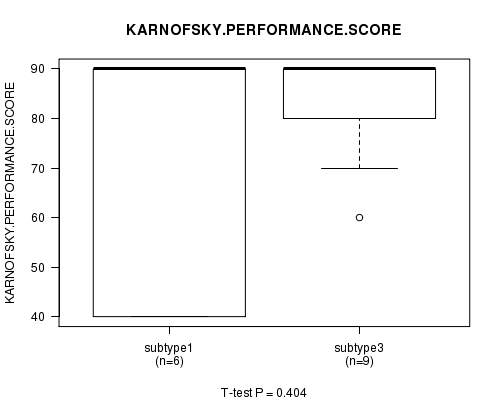
Table S31. Get Full Table Description of clustering approach #7: 'MIRseq CNMF subtypes'
| Cluster Labels | 1 | 2 | 3 | 4 | 5 |
|---|---|---|---|---|---|
| Number of samples | 12 | 29 | 11 | 3 | 12 |
P value = 0.00184 (logrank test)
Table S32. Clustering Approach #7: 'MIRseq CNMF subtypes' versus Clinical Feature #1: 'Time to Death'
| nPatients | nDeath | Duration Range (Median), Month | |
|---|---|---|---|
| ALL | 67 | 25 | 0.4 - 118.9 (7.8) |
| subtype1 | 12 | 4 | 1.5 - 118.9 (9.5) |
| subtype2 | 29 | 14 | 0.4 - 49.2 (8.2) |
| subtype3 | 11 | 3 | 0.7 - 37.8 (13.7) |
| subtype4 | 3 | 2 | 5.1 - 6.6 (6.2) |
| subtype5 | 12 | 2 | 0.5 - 100.5 (6.8) |
Figure S25. Get High-res Image Clustering Approach #7: 'MIRseq CNMF subtypes' versus Clinical Feature #1: 'Time to Death'
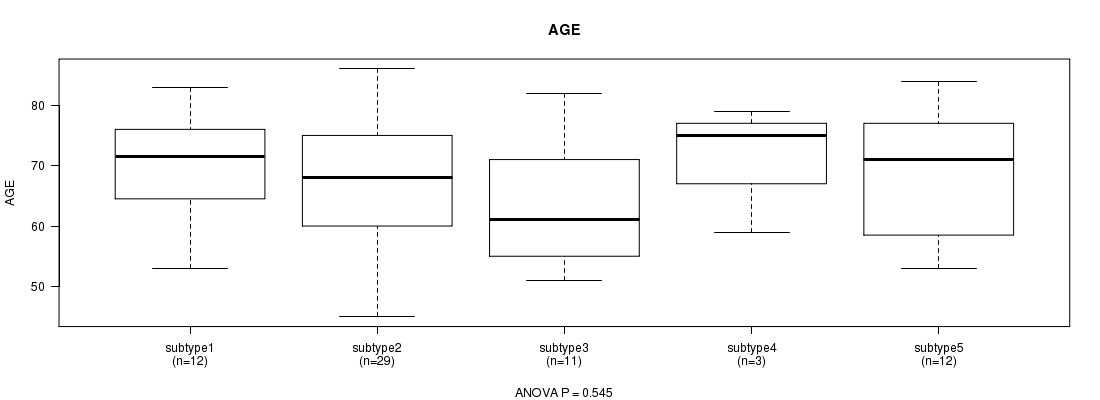
P value = 0.545 (ANOVA)
Table S33. Clustering Approach #7: 'MIRseq CNMF subtypes' versus Clinical Feature #2: 'AGE'
| nPatients | Mean (Std.Dev) | |
|---|---|---|
| ALL | 67 | 67.9 (10.3) |
| subtype1 | 12 | 70.6 (8.5) |
| subtype2 | 29 | 67.7 (10.5) |
| subtype3 | 11 | 63.5 (11.2) |
| subtype4 | 3 | 71.0 (10.6) |
| subtype5 | 12 | 68.8 (11.0) |
Figure S26. Get High-res Image Clustering Approach #7: 'MIRseq CNMF subtypes' versus Clinical Feature #2: 'AGE'
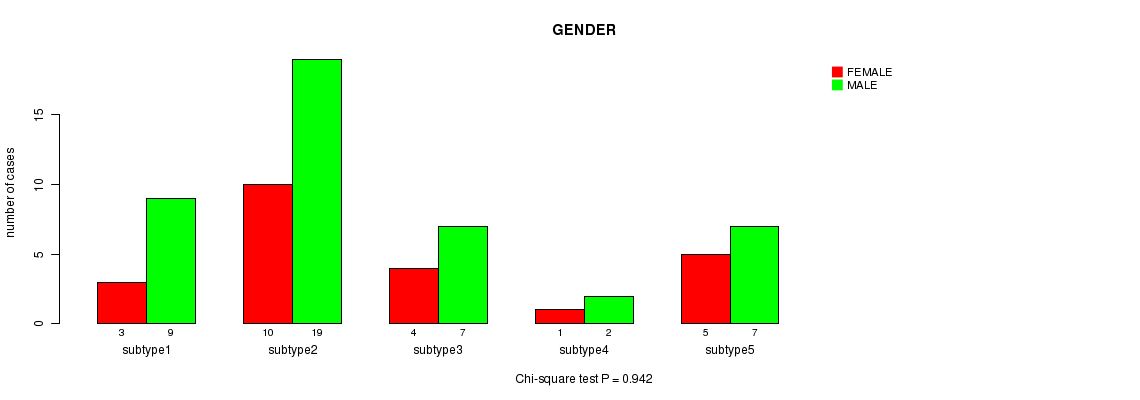
P value = 0.942 (Chi-square test)
Table S34. Clustering Approach #7: 'MIRseq CNMF subtypes' versus Clinical Feature #3: 'GENDER'
| nPatients | FEMALE | MALE |
|---|---|---|
| ALL | 23 | 44 |
| subtype1 | 3 | 9 |
| subtype2 | 10 | 19 |
| subtype3 | 4 | 7 |
| subtype4 | 1 | 2 |
| subtype5 | 5 | 7 |
Figure S27. Get High-res Image Clustering Approach #7: 'MIRseq CNMF subtypes' versus Clinical Feature #3: 'GENDER'
P value = 0.573 (ANOVA)
Table S35. Clustering Approach #7: 'MIRseq CNMF subtypes' versus Clinical Feature #4: 'KARNOFSKY.PERFORMANCE.SCORE'
| nPatients | Mean (Std.Dev) | |
|---|---|---|
| ALL | 16 | 79.4 (17.7) |
| subtype2 | 8 | 76.2 (22.6) |
| subtype3 | 5 | 82.0 (13.0) |
| subtype4 | 1 | 90.0 (NA) |
| subtype5 | 2 | 80.0 (14.1) |
Figure S28. Get High-res Image Clustering Approach #7: 'MIRseq CNMF subtypes' versus Clinical Feature #4: 'KARNOFSKY.PERFORMANCE.SCORE'
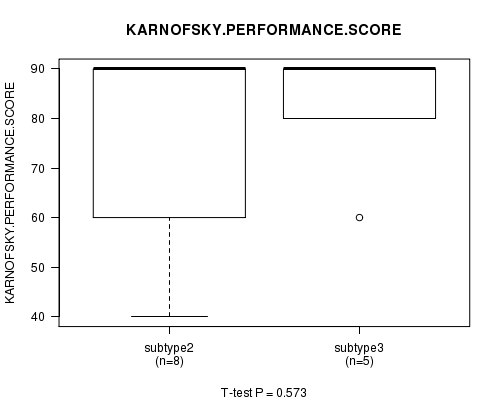
Table S36. Get Full Table Description of clustering approach #8: 'MIRseq cHierClus subtypes'
| Cluster Labels | 1 | 2 | 3 |
|---|---|---|---|
| Number of samples | 2 | 12 | 53 |
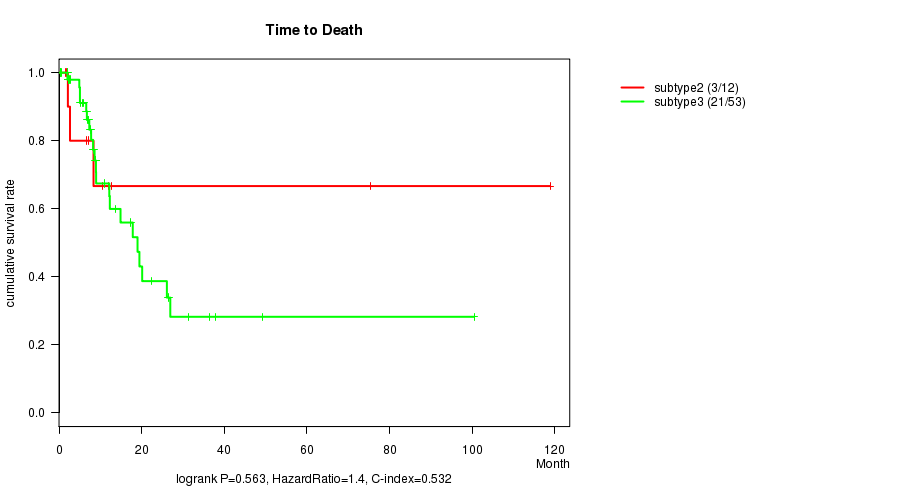
P value = 0.563 (logrank test)
Table S37. Clustering Approach #8: 'MIRseq cHierClus subtypes' versus Clinical Feature #1: 'Time to Death'
| nPatients | nDeath | Duration Range (Median), Month | |
|---|---|---|---|
| ALL | 65 | 24 | 0.4 - 118.9 (8.2) |
| subtype2 | 12 | 3 | 1.5 - 118.9 (7.8) |
| subtype3 | 53 | 21 | 0.4 - 100.5 (8.2) |
Figure S29. Get High-res Image Clustering Approach #8: 'MIRseq cHierClus subtypes' versus Clinical Feature #1: 'Time to Death'
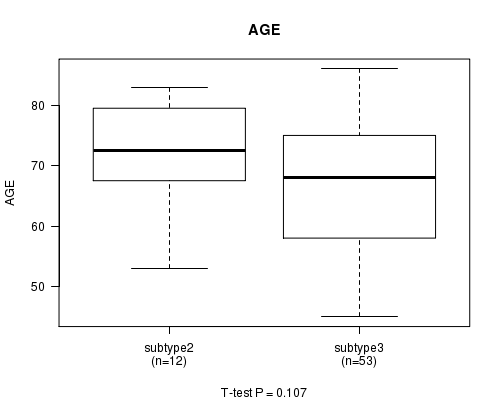
P value = 0.107 (t-test)
Table S38. Clustering Approach #8: 'MIRseq cHierClus subtypes' versus Clinical Feature #2: 'AGE'
| nPatients | Mean (Std.Dev) | |
|---|---|---|
| ALL | 65 | 68.1 (10.4) |
| subtype2 | 12 | 72.0 (8.5) |
| subtype3 | 53 | 67.2 (10.7) |
Figure S30. Get High-res Image Clustering Approach #8: 'MIRseq cHierClus subtypes' versus Clinical Feature #2: 'AGE'
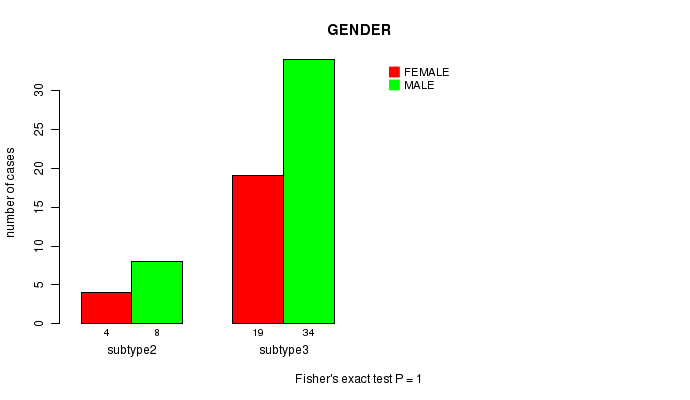
P value = 1 (Fisher's exact test)
Table S39. Clustering Approach #8: 'MIRseq cHierClus subtypes' versus Clinical Feature #3: 'GENDER'
| nPatients | FEMALE | MALE |
|---|---|---|
| ALL | 23 | 42 |
| subtype2 | 4 | 8 |
| subtype3 | 19 | 34 |
Figure S31. Get High-res Image Clustering Approach #8: 'MIRseq cHierClus subtypes' versus Clinical Feature #3: 'GENDER'
-
Cluster data file = BLCA.mergedcluster.txt
-
Clinical data file = BLCA.clin.merged.picked.txt
-
Number of patients = 68
-
Number of clustering approaches = 8
-
Number of selected clinical features = 4
-
Exclude small clusters that include fewer than K patients, K = 3
consensus non-negative matrix factorization clustering approach (Brunet et al. 2004)
Resampling-based clustering method (Monti et al. 2003)
For survival clinical features, the Kaplan-Meier survival curves of tumors with and without gene mutations were plotted and the statistical significance P values were estimated by logrank test (Bland and Altman 2004) using the 'survdiff' function in R
For continuous numerical clinical features, one-way analysis of variance (Howell 2002) was applied to compare the clinical values between tumor subtypes using 'anova' function in R
For multi-class clinical features (nominal or ordinal), Chi-square tests (Greenwood and Nikulin 1996) were used to estimate the P values using the 'chisq.test' function in R
For binary clinical features, two-tailed Fisher's exact tests (Fisher 1922) were used to estimate the P values using the 'fisher.test' function in R
For continuous numerical clinical features, two-tailed Student's t test with unequal variance (Lehmann and Romano 2005) was applied to compare the clinical values between two tumor subtypes using 't.test' function in R
This is an experimental feature. The full results of the analysis summarized in this report can be downloaded from the TCGA Data Coordination Center.