This pipeline uses various statistical tests to identify genes whose promoter methylation levels correlated to selected clinical features.
Testing the association between 17362 genes and 5 clinical features across 506 samples, statistically thresholded by Q value < 0.05, 4 clinical features related to at least one genes.
-
140 genes correlated to 'AGE'.
-
KIF15 , EGR2 , MEX3C , LGALS8 , C10ORF35 , ...
-
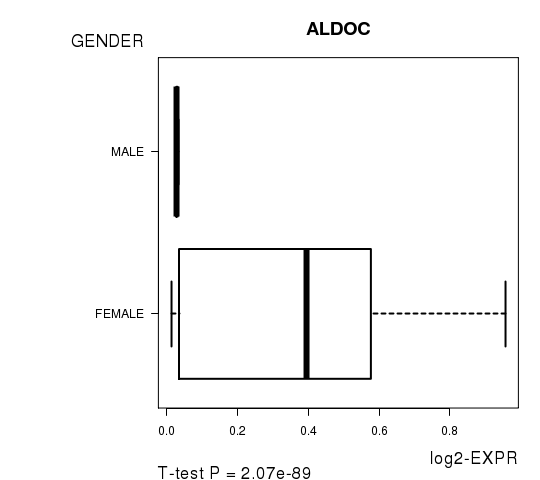
169 genes correlated to 'GENDER'.
-
ALDOC , ZNF486 , CRIP1 , RAD51AP2 , DNAJC15 , ...
-
229 genes correlated to 'RADIATIONS.RADIATION.REGIMENINDICATION'.
-
CCDC86 , CCDC85B , NDUFB4 , HS1BP3 , SGSH , ...
-
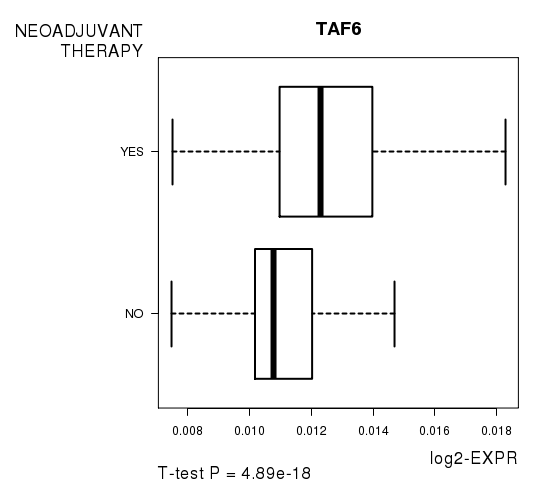
421 genes correlated to 'NEOADJUVANT.THERAPY'.
-
TAF6 , PIN1 , HS1BP3 , RPS15 , SGSH , ...
-
No genes correlated to 'Time to Death'
Complete statistical result table is provided in Supplement Table 1
Table 1. Get Full Table This table shows the clinical features, statistical methods used, and the number of genes that are significantly associated with each clinical feature at Q value < 0.05.
| Clinical feature | Statistical test | Significant genes | Associated with | Associated with | ||
|---|---|---|---|---|---|---|
| Time to Death | Cox regression test | N=0 | ||||
| AGE | Spearman correlation test | N=140 | older | N=126 | younger | N=14 |
| GENDER | t test | N=169 | male | N=39 | female | N=130 |
| RADIATIONS RADIATION REGIMENINDICATION | t test | N=229 | yes | N=170 | no | N=59 |
| NEOADJUVANT THERAPY | t test | N=421 | yes | N=323 | no | N=98 |
Table S1. Basic characteristics of clinical feature: 'Time to Death'
| Time to Death | Duration (Months) | 0-223.4 (median=18.3) |
| censored | N = 422 | |
| death | N = 56 | |
| Significant markers | N = 0 |
Table S2. Basic characteristics of clinical feature: 'AGE'
| AGE | Mean (SD) | 57.47 (13) |
| Significant markers | N = 140 | |
| pos. correlated | 126 | |
| neg. correlated | 14 |
Table S3. Get Full Table List of top 10 genes significantly correlated to 'AGE' by Spearman correlation test
| SpearmanCorr | corrP | Q | |
|---|---|---|---|
| KIF15 | 0.295 | 1.336e-11 | 2.32e-07 |
| EGR2 | 0.2895 | 3.331e-11 | 5.78e-07 |
| MEX3C | 0.2874 | 4.644e-11 | 8.06e-07 |
| LGALS8 | -0.2843 | 7.59e-11 | 1.32e-06 |
| C10ORF35 | 0.2782 | 1.995e-10 | 3.46e-06 |
| PAPSS1 | 0.2766 | 2.559e-10 | 4.44e-06 |
| RPS2 | 0.2757 | 2.92e-10 | 5.07e-06 |
| RPL13A | 0.2726 | 4.684e-10 | 8.13e-06 |
| RPL7A | 0.2706 | 6.378e-10 | 1.11e-05 |
| MTMR7 | 0.2705 | 6.44e-10 | 1.12e-05 |
Figure S1. Get High-res Image As an example, this figure shows the association of KIF15 to 'AGE'. P value = 1.34e-11 with Spearman correlation analysis. The straight line presents the best linear regression.
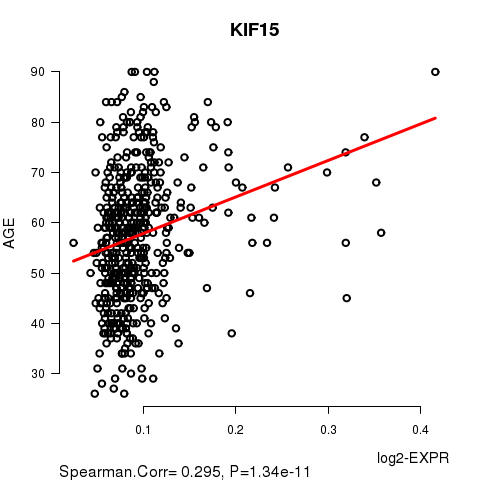
Table S4. Basic characteristics of clinical feature: 'GENDER'
| GENDER | Labels | N |
| FEMALE | 500 | |
| MALE | 6 | |
| Significant markers | N = 169 | |
| Higher in MALE | 39 | |
| Higher in FEMALE | 130 |
Table S5. Get Full Table List of top 10 genes differentially expressed by 'GENDER'
| T(pos if higher in 'MALE') | ttestP | Q | AUC | |
|---|---|---|---|---|
| ALDOC | -25.05 | 2.072e-89 | 3.6e-85 | 0.8637 |
| ZNF486 | -18 | 3.5e-56 | 6.08e-52 | 0.8187 |
| CRIP1 | -16.27 | 3.831e-48 | 6.65e-44 | 0.8647 |
| RAD51AP2 | -14.02 | 2.555e-37 | 4.43e-33 | 0.6927 |
| DNAJC15 | -13.66 | 3.497e-35 | 6.07e-31 | 0.7287 |
| RIMS4 | -17.55 | 8.669e-34 | 1.5e-29 | 0.7963 |
| NMNAT3 | -13.06 | 2.507e-33 | 4.35e-29 | 0.6853 |
| LOC400043 | -13 | 7.144e-31 | 1.24e-26 | 0.6022 |
| RND2 | -12.85 | 1.011e-27 | 1.75e-23 | 0.791 |
| EML1 | -11.16 | 7.642e-26 | 1.33e-21 | 0.608 |
Figure S2. Get High-res Image As an example, this figure shows the association of ALDOC to 'GENDER'. P value = 2.07e-89 with T-test analysis.
229 genes related to 'RADIATIONS.RADIATION.REGIMENINDICATION'.
Table S6. Basic characteristics of clinical feature: 'RADIATIONS.RADIATION.REGIMENINDICATION'
| RADIATIONS.RADIATION.REGIMENINDICATION | Labels | N |
| NO | 124 | |
| YES | 382 | |
| Significant markers | N = 229 | |
| Higher in YES | 170 | |
| Higher in NO | 59 |
Table S7. Get Full Table List of top 10 genes differentially expressed by 'RADIATIONS.RADIATION.REGIMENINDICATION'
| T(pos if higher in 'YES') | ttestP | Q | AUC | |
|---|---|---|---|---|
| CCDC86 | 7.5 | 1.024e-12 | 1.78e-08 | 0.7064 |
| CCDC85B | 7.2 | 5.52e-12 | 9.58e-08 | 0.6853 |
| NDUFB4 | 7.15 | 8.444e-12 | 1.47e-07 | 0.6847 |
| HS1BP3 | 7.03 | 1.296e-11 | 2.25e-07 | 0.6874 |
| SGSH | 6.96 | 1.96e-11 | 3.4e-07 | 0.6698 |
| MAP3K10 | 6.96 | 2.279e-11 | 3.96e-07 | 0.6672 |
| CAPNS1 | 6.96 | 2.6e-11 | 4.51e-07 | 0.6825 |
| TAF6 | 6.9 | 3.187e-11 | 5.53e-07 | 0.6677 |
| MAP1LC3B2 | -6.97 | 3.543e-11 | 6.15e-07 | 0.6913 |
| ERP29 | 6.78 | 4.002e-11 | 6.95e-07 | 0.7045 |
Figure S3. Get High-res Image As an example, this figure shows the association of CCDC86 to 'RADIATIONS.RADIATION.REGIMENINDICATION'. P value = 1.02e-12 with T-test analysis.
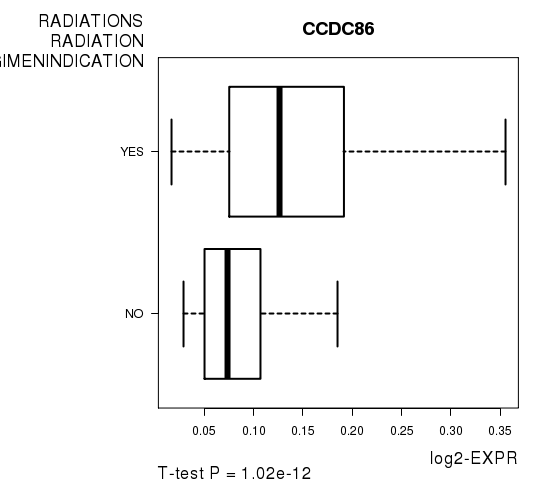
Table S8. Basic characteristics of clinical feature: 'NEOADJUVANT.THERAPY'
| NEOADJUVANT.THERAPY | Labels | N |
| NO | 190 | |
| YES | 316 | |
| Significant markers | N = 421 | |
| Higher in YES | 323 | |
| Higher in NO | 98 |
Table S9. Get Full Table List of top 10 genes differentially expressed by 'NEOADJUVANT.THERAPY'
| T(pos if higher in 'YES') | ttestP | Q | AUC | |
|---|---|---|---|---|
| TAF6 | 9 | 4.894e-18 | 8.5e-14 | 0.705 |
| PIN1 | 8.87 | 1.301e-17 | 2.26e-13 | 0.7055 |
| HS1BP3 | 8.34 | 7.221e-16 | 1.25e-11 | 0.6969 |
| RPS15 | 8.25 | 1.397e-15 | 2.43e-11 | 0.7075 |
| SGSH | 8.23 | 1.624e-15 | 2.82e-11 | 0.6892 |
| CDC20B | 8.09 | 4.862e-15 | 8.44e-11 | 0.6985 |
| CATSPER2 | -8.17 | 7.68e-15 | 1.33e-10 | 0.715 |
| DLEU2L | -8.02 | 7.707e-15 | 1.34e-10 | 0.7041 |
| CCDC86 | 7.99 | 1.197e-14 | 2.08e-10 | 0.7076 |
| UCK1 | 7.96 | 1.205e-14 | 2.09e-10 | 0.6756 |
Figure S4. Get High-res Image As an example, this figure shows the association of TAF6 to 'NEOADJUVANT.THERAPY'. P value = 4.89e-18 with T-test analysis.
-
Expresson data file = BRCA.meth.for_correlation.filtered_data.txt
-
Clinical data file = BRCA.clin.merged.picked.txt
-
Number of patients = 506
-
Number of genes = 17362
-
Number of clinical features = 5
For survival clinical features, Wald's test in univariate Cox regression analysis with proportional hazards model (Andersen and Gill 1982) was used to estimate the P values using the 'coxph' function in R. Kaplan-Meier survival curves were plot using the four quartile subgroups of patients based on expression levels
For continuous numerical clinical features, Spearman's rank correlation coefficients (Spearman 1904) and two-tailed P values were estimated using 'cor.test' function in R
For two-class clinical features, two-tailed Student's t test with unequal variance (Lehmann and Romano 2005) was applied to compare the log2-expression levels between the two clinical classes using 't.test' function in R
For multiple hypothesis correction, Q value is the False Discovery Rate (FDR) analogue of the P value (Benjamini and Hochberg 1995), defined as the minimum FDR at which the test may be called significant. We used the 'Benjamini and Hochberg' method of 'p.adjust' function in R to convert P values into Q values.
This is an experimental feature. The full results of the analysis summarized in this report can be downloaded from the TCGA Data Coordination Center.