This pipeline uses various statistical tests to identify miRs whose expression levels correlated to selected clinical features.
Testing the association between 506 genes and 5 clinical features across 817 samples, statistically thresholded by Q value < 0.05, 4 clinical features related to at least one genes.
-
2 genes correlated to 'Time to Death'.
-
HSA-MIR-874 , HSA-MIR-148B
-
25 genes correlated to 'AGE'.
-
HSA-MIR-424 , HSA-MIR-381 , HSA-MIR-31 , HSA-MIR-99A , HSA-MIR-542 , ...
-
3 genes correlated to 'RADIATIONS.RADIATION.REGIMENINDICATION'.
-
HSA-MIR-374C , HSA-MIR-3607 , HSA-MIR-489
-
7 genes correlated to 'NEOADJUVANT.THERAPY'.
-
HSA-MIR-374C , HSA-MIR-3607 , HSA-MIR-1180 , HSA-MIR-26A-1 , HSA-MIR-3676 , ...
-
No genes correlated to 'GENDER'
Complete statistical result table is provided in Supplement Table 1
Table 1. Get Full Table This table shows the clinical features, statistical methods used, and the number of genes that are significantly associated with each clinical feature at Q value < 0.05.
| Clinical feature | Statistical test | Significant genes | Associated with | Associated with | ||
|---|---|---|---|---|---|---|
| Time to Death | Cox regression test | N=2 | shorter survival | N=2 | longer survival | N=0 |
| AGE | Spearman correlation test | N=25 | older | N=2 | younger | N=23 |
| GENDER | t test | N=0 | ||||
| RADIATIONS RADIATION REGIMENINDICATION | t test | N=3 | yes | N=0 | no | N=3 |
| NEOADJUVANT THERAPY | t test | N=7 | yes | N=3 | no | N=4 |
Table S1. Basic characteristics of clinical feature: 'Time to Death'
| Time to Death | Duration (Months) | 0-223.4 (median=19) |
| censored | N = 664 | |
| death | N = 94 | |
| Significant markers | N = 2 | |
| associated with shorter survival | 2 | |
| associated with longer survival | 0 |
Table S2. Get Full Table List of 2 genes significantly associated with 'Time to Death' by Cox regression test
| HazardRatio | Wald_P | Q | C_index | |
|---|---|---|---|---|
| HSA-MIR-874 | 1.57 | 1.037e-05 | 0.0052 | 0.606 |
| HSA-MIR-148B | 1.78 | 6.237e-05 | 0.031 | 0.625 |
Figure S1. Get High-res Image As an example, this figure shows the association of HSA-MIR-874 to 'Time to Death'. four curves present the cumulative survival rates of 4 quartile subsets of patients. P value = 1.04e-05 with univariate Cox regression analysis using continuous log-2 expression values.
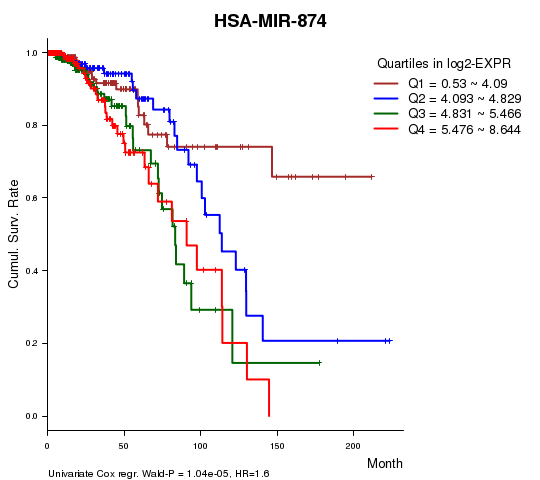
Table S3. Basic characteristics of clinical feature: 'AGE'
| AGE | Mean (SD) | 58.26 (13) |
| Significant markers | N = 25 | |
| pos. correlated | 2 | |
| neg. correlated | 23 |
Table S4. Get Full Table List of top 10 genes significantly correlated to 'AGE' by Spearman correlation test
| SpearmanCorr | corrP | Q | |
|---|---|---|---|
| HSA-MIR-424 | -0.2216 | 1.56e-10 | 7.89e-08 |
| HSA-MIR-381 | -0.2139 | 6.764e-10 | 3.42e-07 |
| HSA-MIR-31 | -0.213 | 1.308e-09 | 6.59e-07 |
| HSA-MIR-99A | -0.2057 | 3.019e-09 | 1.52e-06 |
| HSA-MIR-542 | -0.2044 | 3.778e-09 | 1.9e-06 |
| HSA-MIR-598 | -0.1996 | 8.862e-09 | 4.44e-06 |
| HSA-MIR-652 | -0.1965 | 1.505e-08 | 7.52e-06 |
| HSA-LET-7C | -0.1774 | 3.37e-07 | 0.000168 |
| HSA-MIR-450B | -0.1705 | 9.763e-07 | 0.000486 |
| HSA-MIR-125B-1 | -0.1652 | 2.08e-06 | 0.00103 |
Figure S2. Get High-res Image As an example, this figure shows the association of HSA-MIR-424 to 'AGE'. P value = 1.56e-10 with Spearman correlation analysis. The straight line presents the best linear regression.
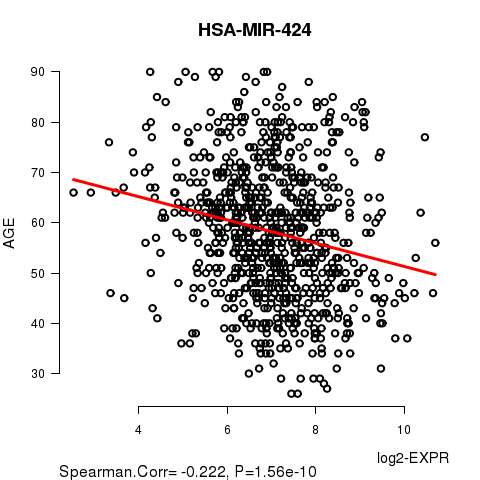
Table S5. Basic characteristics of clinical feature: 'GENDER'
| GENDER | Labels | N |
| FEMALE | 808 | |
| MALE | 9 | |
| Significant markers | N = 0 |
3 genes related to 'RADIATIONS.RADIATION.REGIMENINDICATION'.
Table S6. Basic characteristics of clinical feature: 'RADIATIONS.RADIATION.REGIMENINDICATION'
| RADIATIONS.RADIATION.REGIMENINDICATION | Labels | N |
| NO | 189 | |
| YES | 628 | |
| Significant markers | N = 3 | |
| Higher in YES | 0 | |
| Higher in NO | 3 |
Table S7. Get Full Table List of 3 genes differentially expressed by 'RADIATIONS.RADIATION.REGIMENINDICATION'
| T(pos if higher in 'YES') | ttestP | Q | AUC | |
|---|---|---|---|---|
| HSA-MIR-374C | -4.73 | 3.893e-06 | 0.00197 | 0.6313 |
| HSA-MIR-3607 | -4.3 | 2.14e-05 | 0.0108 | 0.5726 |
| HSA-MIR-489 | -4.3 | 2.917e-05 | 0.0147 | 0.6304 |
Figure S3. Get High-res Image As an example, this figure shows the association of HSA-MIR-374C to 'RADIATIONS.RADIATION.REGIMENINDICATION'. P value = 3.89e-06 with T-test analysis.
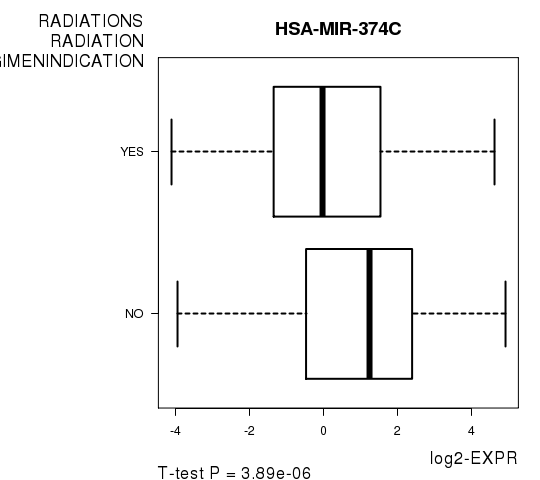
Table S8. Basic characteristics of clinical feature: 'NEOADJUVANT.THERAPY'
| NEOADJUVANT.THERAPY | Labels | N |
| NO | 299 | |
| YES | 518 | |
| Significant markers | N = 7 | |
| Higher in YES | 3 | |
| Higher in NO | 4 |
Table S9. Get Full Table List of 7 genes differentially expressed by 'NEOADJUVANT.THERAPY'
| T(pos if higher in 'YES') | ttestP | Q | AUC | |
|---|---|---|---|---|
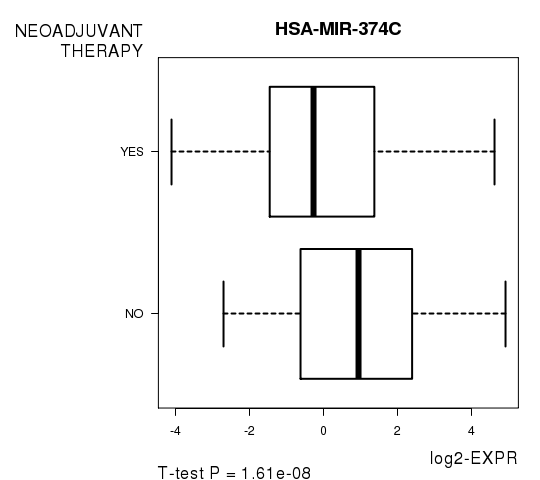
| HSA-MIR-374C | -5.75 | 1.614e-08 | 8.17e-06 | 0.6404 |
| HSA-MIR-3607 | -5.21 | 2.362e-07 | 0.000119 | 0.5764 |
| HSA-MIR-1180 | 4.7 | 3.18e-06 | 0.0016 | 0.5965 |
| HSA-MIR-26A-1 | -4.5 | 7.912e-06 | 0.00398 | 0.575 |
| HSA-MIR-3676 | 4.41 | 1.232e-05 | 0.00618 | 0.5909 |
| HSA-MIR-361 | 4.29 | 2.067e-05 | 0.0104 | 0.5903 |
| HSA-MIR-320E | -3.93 | 9.988e-05 | 0.0499 | 0.5878 |
Figure S4. Get High-res Image As an example, this figure shows the association of HSA-MIR-374C to 'NEOADJUVANT.THERAPY'. P value = 1.61e-08 with T-test analysis.
-
Expresson data file = BRCA.miRseq_RPKM_log2.txt
-
Clinical data file = BRCA.clin.merged.picked.txt
-
Number of patients = 817
-
Number of genes = 506
-
Number of clinical features = 5
For survival clinical features, Wald's test in univariate Cox regression analysis with proportional hazards model (Andersen and Gill 1982) was used to estimate the P values using the 'coxph' function in R. Kaplan-Meier survival curves were plot using the four quartile subgroups of patients based on expression levels
For continuous numerical clinical features, Spearman's rank correlation coefficients (Spearman 1904) and two-tailed P values were estimated using 'cor.test' function in R
For two-class clinical features, two-tailed Student's t test with unequal variance (Lehmann and Romano 2005) was applied to compare the log2-expression levels between the two clinical classes using 't.test' function in R
For multiple hypothesis correction, Q value is the False Discovery Rate (FDR) analogue of the P value (Benjamini and Hochberg 1995), defined as the minimum FDR at which the test may be called significant. We used the 'Benjamini and Hochberg' method of 'p.adjust' function in R to convert P values into Q values.
This is an experimental feature. The full results of the analysis summarized in this report can be downloaded from the TCGA Data Coordination Center.