This pipeline computes the correlation between cancer subtypes identified by different molecular patterns and selected clinical features.
Testing the association between subtypes identified by 10 different clustering approaches and 5 clinical features across 862 patients, 16 significant findings detected with P value < 0.05.
-
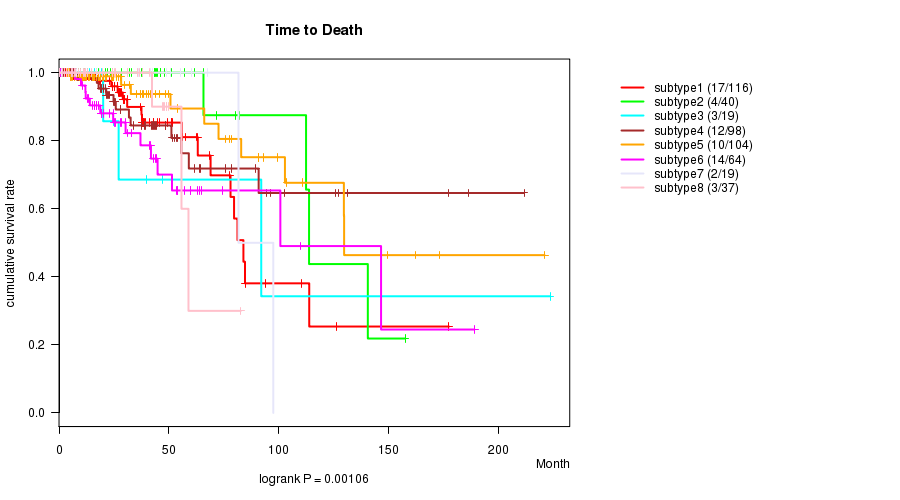
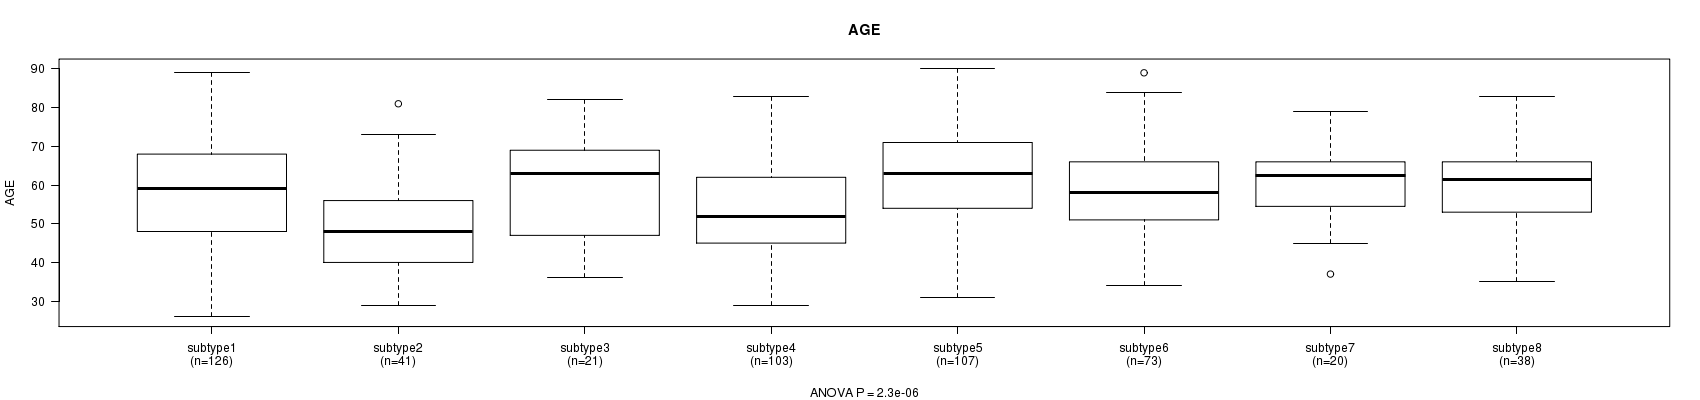
CNMF clustering analysis on array-based mRNA expression data identified 8 subtypes that correlate to 'Time to Death' and 'AGE'.
-
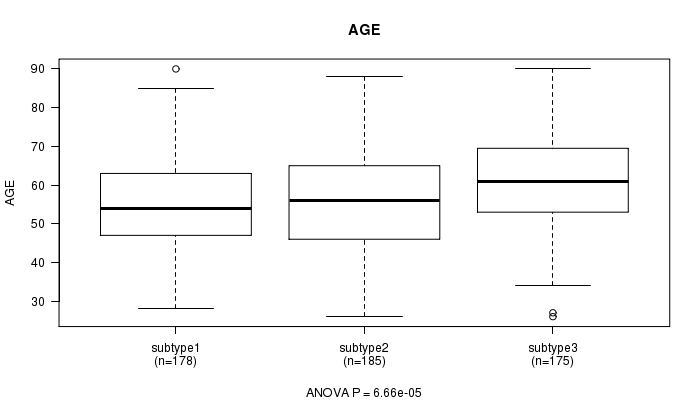
Consensus hierarchical clustering analysis on array-based mRNA expression data identified 3 subtypes that correlate to 'AGE'.
-
5 subtypes identified in current cancer cohort by 'CN CNMF'. These subtypes correlate to 'Time to Death' and 'GENDER'.
-
3 subtypes identified in current cancer cohort by 'METHLYATION CNMF'. These subtypes correlate to 'Time to Death' and 'AGE'.
-
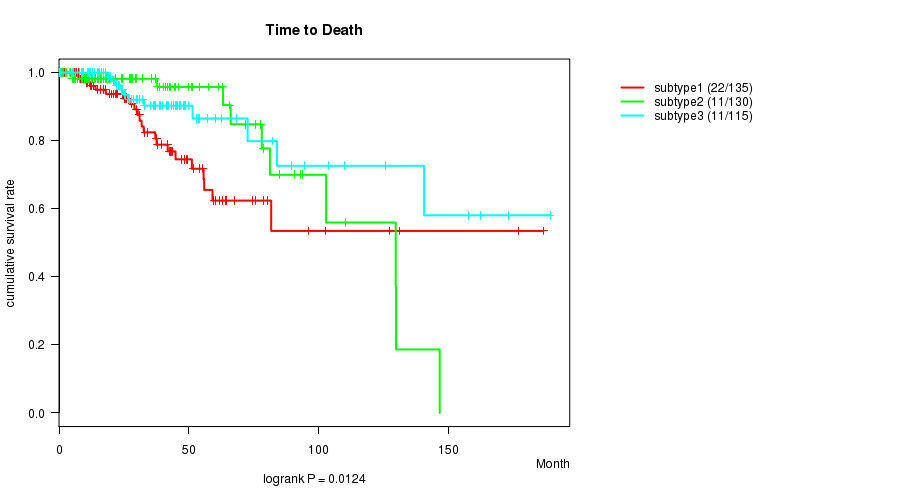
CNMF clustering analysis on RPPA data identified 3 subtypes that correlate to 'Time to Death' and 'AGE'.
-
Consensus hierarchical clustering analysis on RPPA data identified 3 subtypes that correlate to 'AGE'.
-
CNMF clustering analysis on sequencing-based mRNA expression data identified 3 subtypes that correlate to 'AGE'.
-
Consensus hierarchical clustering analysis on sequencing-based mRNA expression data identified 3 subtypes that correlate to 'Time to Death' and 'AGE'.
-
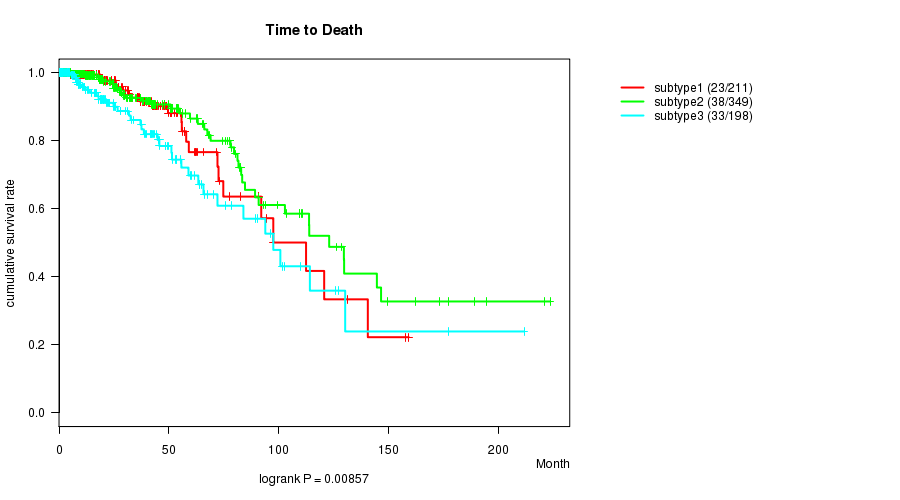
CNMF clustering analysis on sequencing-based miR expression data identified 3 subtypes that correlate to 'Time to Death' and 'AGE'.
-
Consensus hierarchical clustering analysis on sequencing-based miR expression data identified 3 subtypes that correlate to 'Time to Death'.
Table 1. Get Full Table Overview of the association between subtypes identified by 10 different clustering approaches and 5 clinical features. Shown in the table are P values from statistical tests. Thresholded by P value < 0.05, 16 significant findings detected.
|
Clinical Features |
Time to Death |
AGE | GENDER |
RADIATIONS RADIATION REGIMENINDICATION |
NEOADJUVANT THERAPY |
| Statistical Tests | logrank test | ANOVA | Fisher's exact test | Fisher's exact test | Fisher's exact test |
| mRNA CNMF subtypes | 0.00106 | 2.3e-06 | 0.0519 | 0.897 | 0.391 |
| mRNA cHierClus subtypes | 0.557 | 0.00176 | 0.322 | 0.195 | 0.335 |
| CN CNMF | 0.00957 | 0.0773 | 0.000216 | 0.191 | 0.733 |
| METHLYATION CNMF | 0.0095 | 6.66e-05 | 0.227 | 0.885 | 0.494 |
| RPPA CNMF subtypes | 0.0124 | 0.0191 | 0.058 | 0.944 | 0.0593 |
| RPPA cHierClus subtypes | 0.0901 | 0.000121 | 0.187 | 0.726 | 0.307 |
| RNAseq CNMF subtypes | 0.179 | 0.00573 | 0.0991 | 0.467 | 0.184 |
| RNAseq cHierClus subtypes | 0.00841 | 0.000672 | 0.0886 | 0.255 | 0.0533 |
| MIRseq CNMF subtypes | 0.00857 | 0.00561 | 0.0881 | 0.624 | 0.273 |
| MIRseq cHierClus subtypes | 0.0377 | 0.0929 | 0.258 | 0.883 | 0.87 |
Table S1. Get Full Table Description of clustering approach #1: 'mRNA CNMF subtypes'
| Cluster Labels | 1 | 2 | 3 | 4 | 5 | 6 | 7 | 8 |
|---|---|---|---|---|---|---|---|---|
| Number of samples | 126 | 41 | 21 | 103 | 107 | 73 | 20 | 38 |
P value = 0.00106 (logrank test)
Table S2. Clustering Approach #1: 'mRNA CNMF subtypes' versus Clinical Feature #1: 'Time to Death'
| nPatients | nDeath | Duration Range (Median), Month | |
|---|---|---|---|
| ALL | 497 | 65 | 0.1 - 223.4 (24.1) |
| subtype1 | 116 | 17 | 0.1 - 177.4 (24.4) |
| subtype2 | 40 | 4 | 0.1 - 157.4 (40.6) |
| subtype3 | 19 | 3 | 0.3 - 223.4 (14.0) |
| subtype4 | 98 | 12 | 0.1 - 211.5 (21.9) |
| subtype5 | 104 | 10 | 0.3 - 220.9 (19.0) |
| subtype6 | 64 | 14 | 0.1 - 189.0 (24.9) |
| subtype7 | 19 | 2 | 0.2 - 97.5 (36.3) |
| subtype8 | 37 | 3 | 0.3 - 82.7 (20.0) |
Figure S1. Get High-res Image Clustering Approach #1: 'mRNA CNMF subtypes' versus Clinical Feature #1: 'Time to Death'
P value = 2.3e-06 (ANOVA)
Table S3. Clustering Approach #1: 'mRNA CNMF subtypes' versus Clinical Feature #2: 'AGE'
| nPatients | Mean (Std.Dev) | |
|---|---|---|
| ALL | 529 | 57.9 (13.2) |
| subtype1 | 126 | 58.5 (14.3) |
| subtype2 | 41 | 50.0 (12.1) |
| subtype3 | 21 | 59.4 (13.8) |
| subtype4 | 103 | 53.8 (12.6) |
| subtype5 | 107 | 62.1 (12.4) |
| subtype6 | 73 | 58.5 (12.5) |
| subtype7 | 20 | 60.4 (9.9) |
| subtype8 | 38 | 60.3 (12.0) |
Figure S2. Get High-res Image Clustering Approach #1: 'mRNA CNMF subtypes' versus Clinical Feature #2: 'AGE'
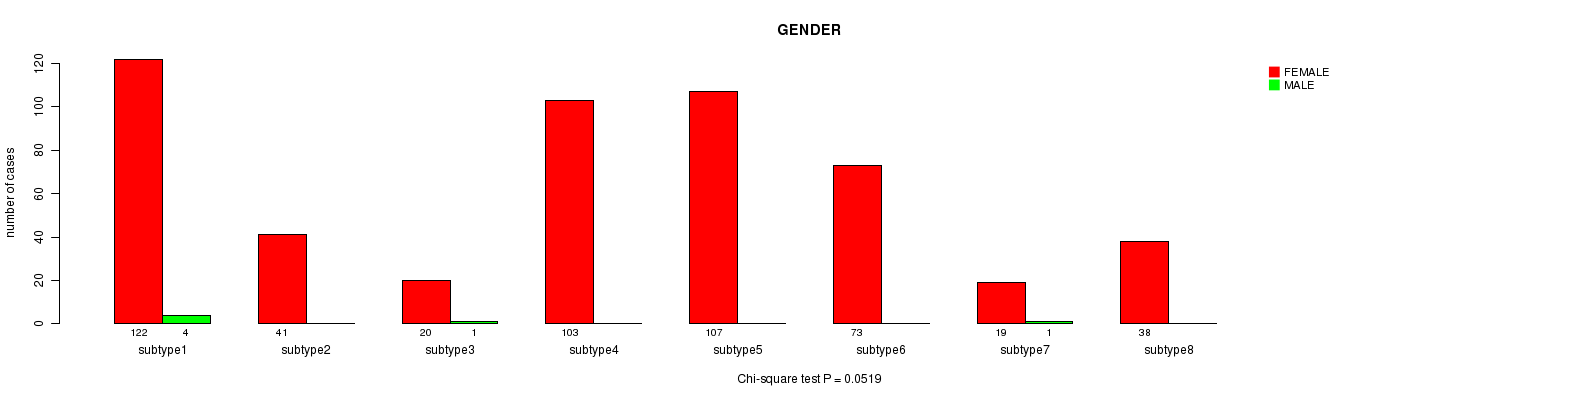
P value = 0.0519 (Chi-square test)
Table S4. Clustering Approach #1: 'mRNA CNMF subtypes' versus Clinical Feature #3: 'GENDER'
| nPatients | FEMALE | MALE |
|---|---|---|
| ALL | 523 | 6 |
| subtype1 | 122 | 4 |
| subtype2 | 41 | 0 |
| subtype3 | 20 | 1 |
| subtype4 | 103 | 0 |
| subtype5 | 107 | 0 |
| subtype6 | 73 | 0 |
| subtype7 | 19 | 1 |
| subtype8 | 38 | 0 |
Figure S3. Get High-res Image Clustering Approach #1: 'mRNA CNMF subtypes' versus Clinical Feature #3: 'GENDER'
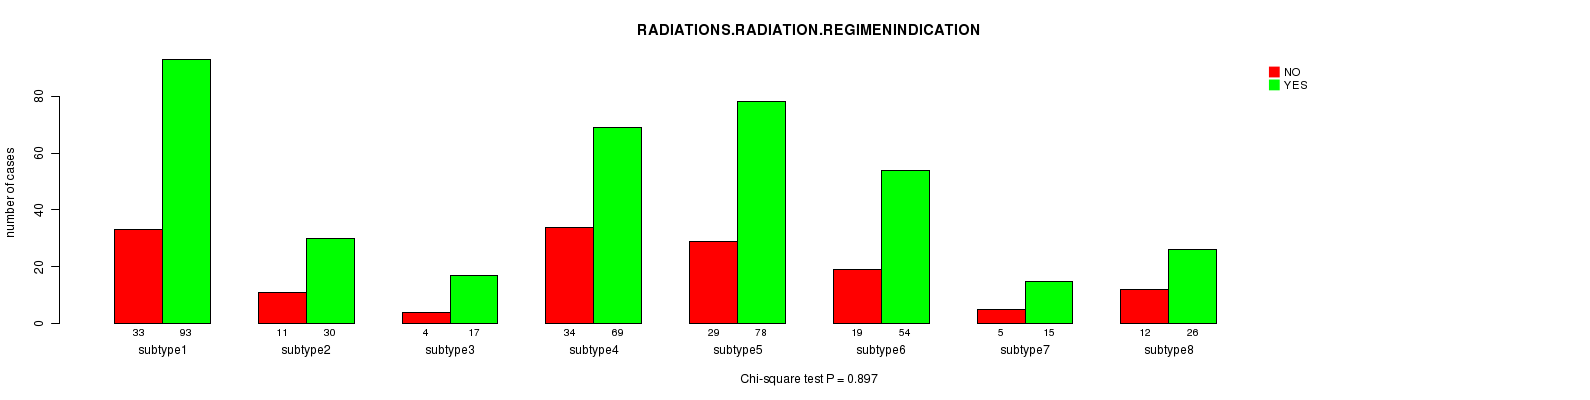
P value = 0.897 (Chi-square test)
Table S5. Clustering Approach #1: 'mRNA CNMF subtypes' versus Clinical Feature #4: 'RADIATIONS.RADIATION.REGIMENINDICATION'
| nPatients | NO | YES |
|---|---|---|
| ALL | 147 | 382 |
| subtype1 | 33 | 93 |
| subtype2 | 11 | 30 |
| subtype3 | 4 | 17 |
| subtype4 | 34 | 69 |
| subtype5 | 29 | 78 |
| subtype6 | 19 | 54 |
| subtype7 | 5 | 15 |
| subtype8 | 12 | 26 |
Figure S4. Get High-res Image Clustering Approach #1: 'mRNA CNMF subtypes' versus Clinical Feature #4: 'RADIATIONS.RADIATION.REGIMENINDICATION'
P value = 0.391 (Chi-square test)
Table S6. Clustering Approach #1: 'mRNA CNMF subtypes' versus Clinical Feature #5: 'NEOADJUVANT.THERAPY'
| nPatients | NO | YES |
|---|---|---|
| ALL | 221 | 308 |
| subtype1 | 53 | 73 |
| subtype2 | 20 | 21 |
| subtype3 | 5 | 16 |
| subtype4 | 48 | 55 |
| subtype5 | 45 | 62 |
| subtype6 | 26 | 47 |
| subtype7 | 6 | 14 |
| subtype8 | 18 | 20 |
Figure S5. Get High-res Image Clustering Approach #1: 'mRNA CNMF subtypes' versus Clinical Feature #5: 'NEOADJUVANT.THERAPY'
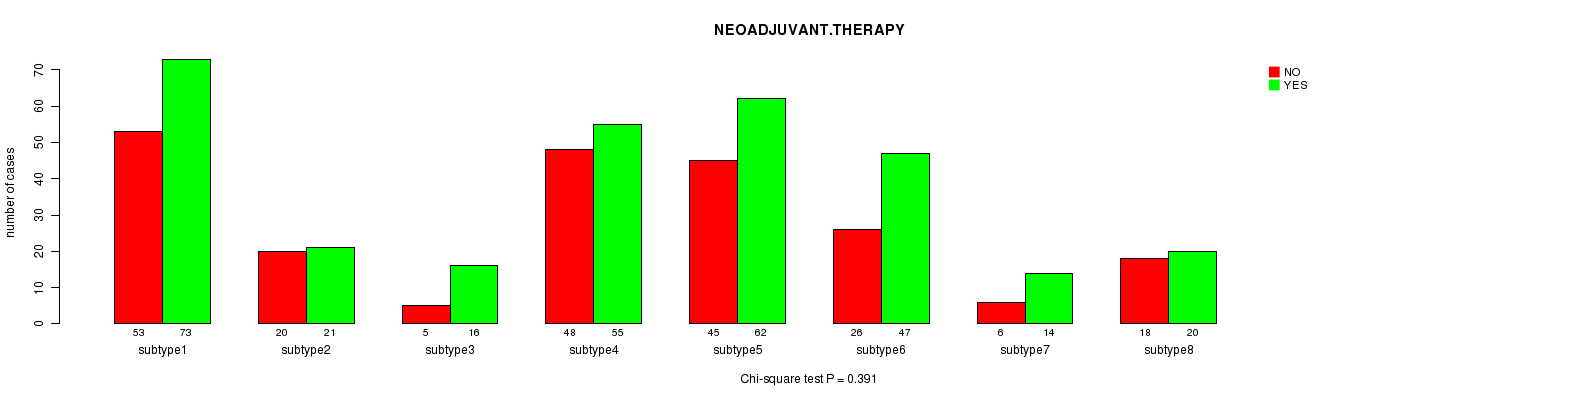
Table S7. Get Full Table Description of clustering approach #2: 'mRNA cHierClus subtypes'
| Cluster Labels | 1 | 2 | 3 |
|---|---|---|---|
| Number of samples | 129 | 129 | 271 |
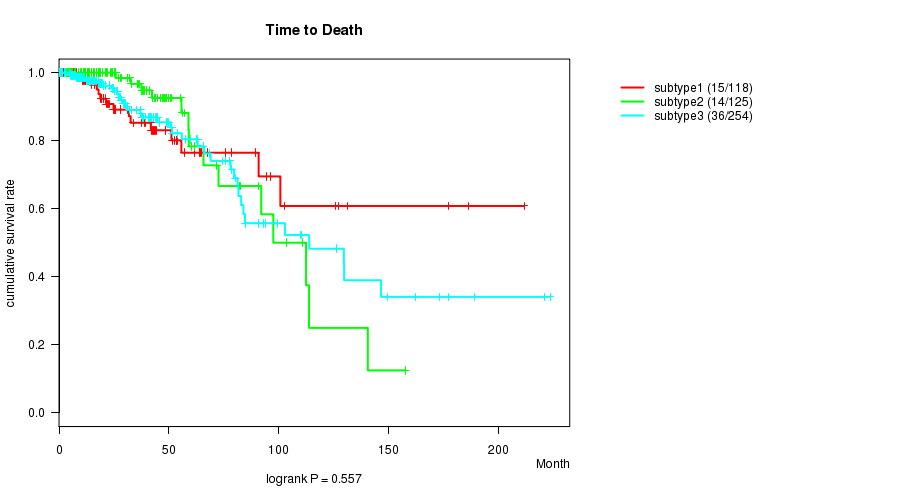
P value = 0.557 (logrank test)
Table S8. Clustering Approach #2: 'mRNA cHierClus subtypes' versus Clinical Feature #1: 'Time to Death'
| nPatients | nDeath | Duration Range (Median), Month | |
|---|---|---|---|
| ALL | 497 | 65 | 0.1 - 223.4 (24.1) |
| subtype1 | 118 | 15 | 0.1 - 211.5 (21.6) |
| subtype2 | 125 | 14 | 0.3 - 157.4 (27.2) |
| subtype3 | 254 | 36 | 0.1 - 223.4 (23.1) |
Figure S6. Get High-res Image Clustering Approach #2: 'mRNA cHierClus subtypes' versus Clinical Feature #1: 'Time to Death'
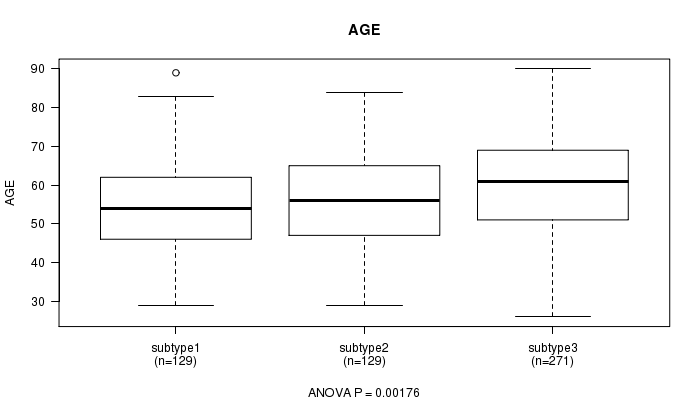
P value = 0.00176 (ANOVA)
Table S9. Clustering Approach #2: 'mRNA cHierClus subtypes' versus Clinical Feature #2: 'AGE'
| nPatients | Mean (Std.Dev) | |
|---|---|---|
| ALL | 529 | 57.9 (13.2) |
| subtype1 | 129 | 55.1 (12.6) |
| subtype2 | 129 | 56.7 (13.1) |
| subtype3 | 271 | 59.8 (13.4) |
Figure S7. Get High-res Image Clustering Approach #2: 'mRNA cHierClus subtypes' versus Clinical Feature #2: 'AGE'
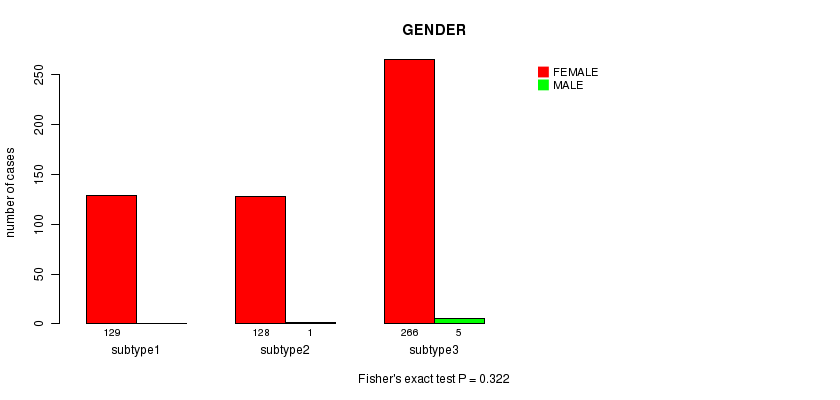
P value = 0.322 (Fisher's exact test)
Table S10. Clustering Approach #2: 'mRNA cHierClus subtypes' versus Clinical Feature #3: 'GENDER'
| nPatients | FEMALE | MALE |
|---|---|---|
| ALL | 523 | 6 |
| subtype1 | 129 | 0 |
| subtype2 | 128 | 1 |
| subtype3 | 266 | 5 |
Figure S8. Get High-res Image Clustering Approach #2: 'mRNA cHierClus subtypes' versus Clinical Feature #3: 'GENDER'
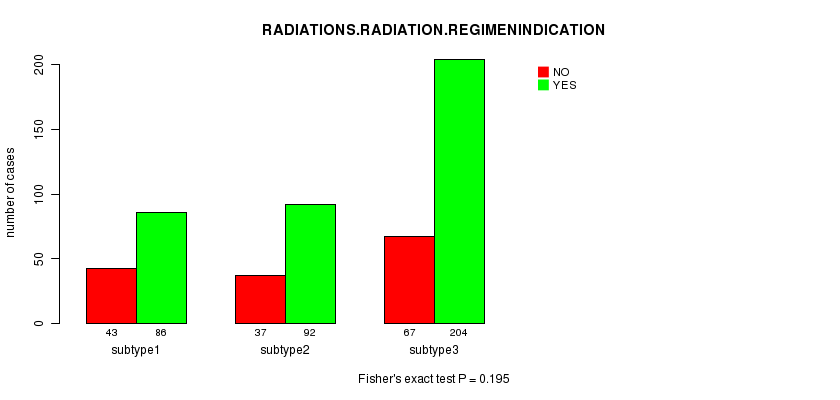
P value = 0.195 (Fisher's exact test)
Table S11. Clustering Approach #2: 'mRNA cHierClus subtypes' versus Clinical Feature #4: 'RADIATIONS.RADIATION.REGIMENINDICATION'
| nPatients | NO | YES |
|---|---|---|
| ALL | 147 | 382 |
| subtype1 | 43 | 86 |
| subtype2 | 37 | 92 |
| subtype3 | 67 | 204 |
Figure S9. Get High-res Image Clustering Approach #2: 'mRNA cHierClus subtypes' versus Clinical Feature #4: 'RADIATIONS.RADIATION.REGIMENINDICATION'
P value = 0.335 (Fisher's exact test)
Table S12. Clustering Approach #2: 'mRNA cHierClus subtypes' versus Clinical Feature #5: 'NEOADJUVANT.THERAPY'
| nPatients | NO | YES |
|---|---|---|
| ALL | 221 | 308 |
| subtype1 | 59 | 70 |
| subtype2 | 57 | 72 |
| subtype3 | 105 | 166 |
Figure S10. Get High-res Image Clustering Approach #2: 'mRNA cHierClus subtypes' versus Clinical Feature #5: 'NEOADJUVANT.THERAPY'
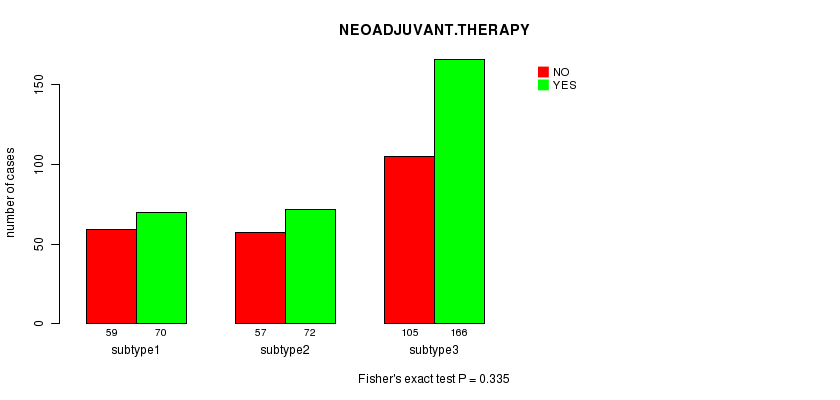
Table S13. Get Full Table Description of clustering approach #3: 'CN CNMF'
| Cluster Labels | 1 | 2 | 3 | 4 | 5 |
|---|---|---|---|---|---|
| Number of samples | 324 | 204 | 67 | 194 | 49 |
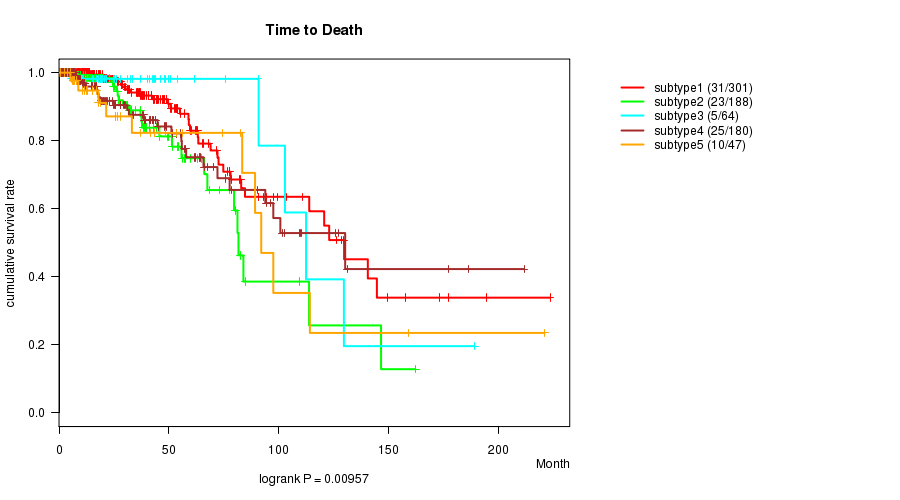
P value = 0.00957 (logrank test)
Table S14. Clustering Approach #3: 'CN CNMF' versus Clinical Feature #1: 'Time to Death'
| nPatients | nDeath | Duration Range (Median), Month | |
|---|---|---|---|
| ALL | 780 | 94 | 0.0 - 223.4 (18.3) |
| subtype1 | 301 | 31 | 0.0 - 223.4 (20.0) |
| subtype2 | 188 | 23 | 0.1 - 162.0 (17.4) |
| subtype3 | 64 | 5 | 0.0 - 189.0 (19.6) |
| subtype4 | 180 | 25 | 0.0 - 211.5 (17.4) |
| subtype5 | 47 | 10 | 0.7 - 220.9 (19.1) |
Figure S11. Get High-res Image Clustering Approach #3: 'CN CNMF' versus Clinical Feature #1: 'Time to Death'
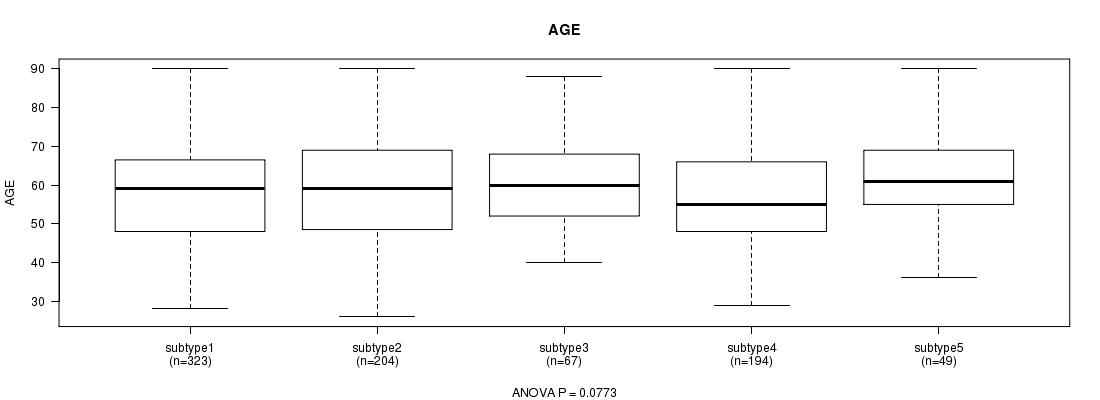
P value = 0.0773 (ANOVA)
Table S15. Clustering Approach #3: 'CN CNMF' versus Clinical Feature #2: 'AGE'
| nPatients | Mean (Std.Dev) | |
|---|---|---|
| ALL | 837 | 58.5 (13.2) |
| subtype1 | 323 | 58.3 (13.0) |
| subtype2 | 204 | 58.9 (14.5) |
| subtype3 | 67 | 60.7 (11.6) |
| subtype4 | 194 | 56.7 (12.8) |
| subtype5 | 49 | 61.7 (11.9) |
Figure S12. Get High-res Image Clustering Approach #3: 'CN CNMF' versus Clinical Feature #2: 'AGE'
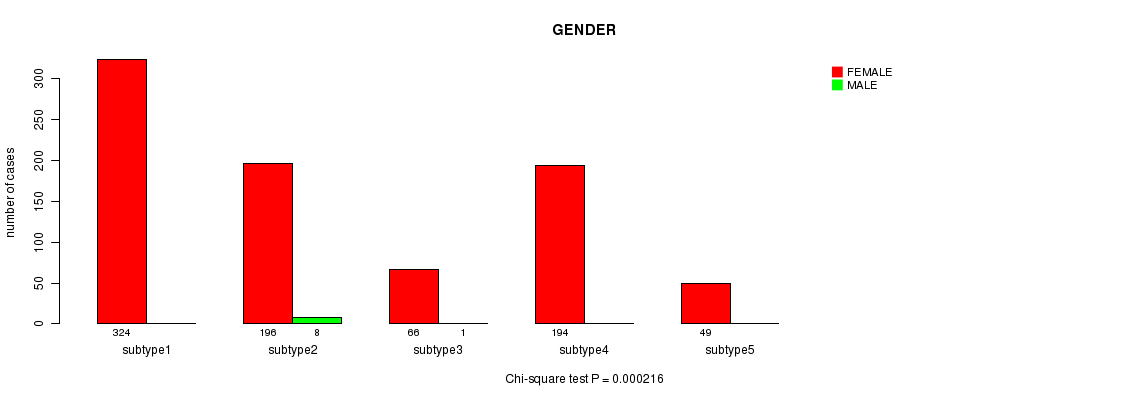
P value = 0.000216 (Chi-square test)
Table S16. Clustering Approach #3: 'CN CNMF' versus Clinical Feature #3: 'GENDER'
| nPatients | FEMALE | MALE |
|---|---|---|
| ALL | 829 | 9 |
| subtype1 | 324 | 0 |
| subtype2 | 196 | 8 |
| subtype3 | 66 | 1 |
| subtype4 | 194 | 0 |
| subtype5 | 49 | 0 |
Figure S13. Get High-res Image Clustering Approach #3: 'CN CNMF' versus Clinical Feature #3: 'GENDER'
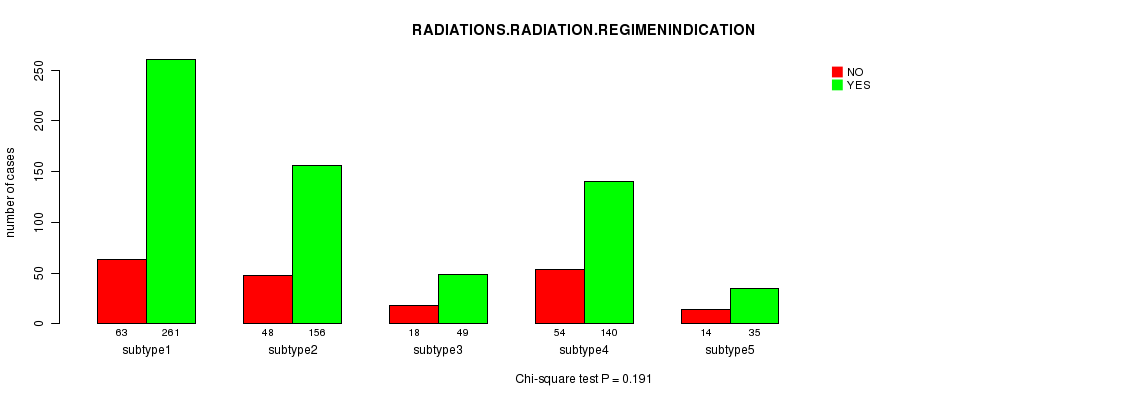
P value = 0.191 (Chi-square test)
Table S17. Clustering Approach #3: 'CN CNMF' versus Clinical Feature #4: 'RADIATIONS.RADIATION.REGIMENINDICATION'
| nPatients | NO | YES |
|---|---|---|
| ALL | 197 | 641 |
| subtype1 | 63 | 261 |
| subtype2 | 48 | 156 |
| subtype3 | 18 | 49 |
| subtype4 | 54 | 140 |
| subtype5 | 14 | 35 |
Figure S14. Get High-res Image Clustering Approach #3: 'CN CNMF' versus Clinical Feature #4: 'RADIATIONS.RADIATION.REGIMENINDICATION'
P value = 0.733 (Chi-square test)
Table S18. Clustering Approach #3: 'CN CNMF' versus Clinical Feature #5: 'NEOADJUVANT.THERAPY'
| nPatients | NO | YES |
|---|---|---|
| ALL | 301 | 537 |
| subtype1 | 121 | 203 |
| subtype2 | 65 | 139 |
| subtype3 | 25 | 42 |
| subtype4 | 71 | 123 |
| subtype5 | 19 | 30 |
Figure S15. Get High-res Image Clustering Approach #3: 'CN CNMF' versus Clinical Feature #5: 'NEOADJUVANT.THERAPY'
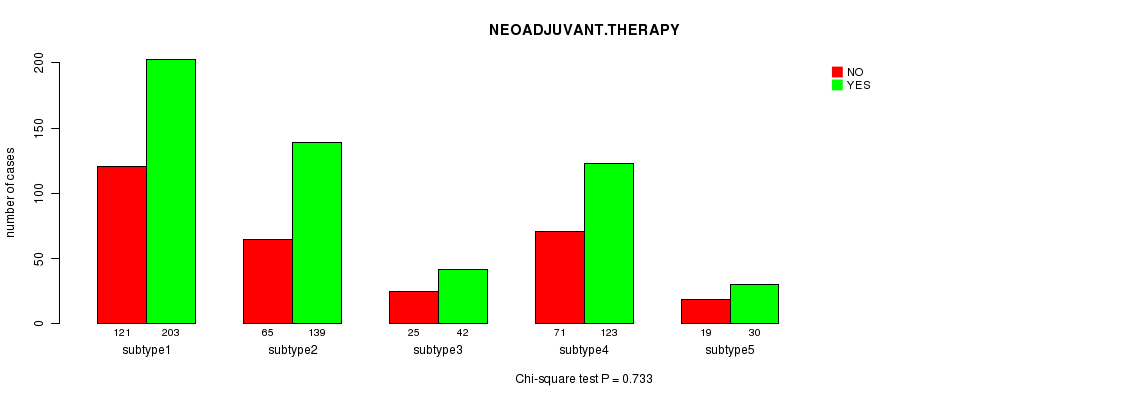
Table S19. Get Full Table Description of clustering approach #4: 'METHLYATION CNMF'
| Cluster Labels | 1 | 2 | 3 |
|---|---|---|---|
| Number of samples | 179 | 185 | 175 |
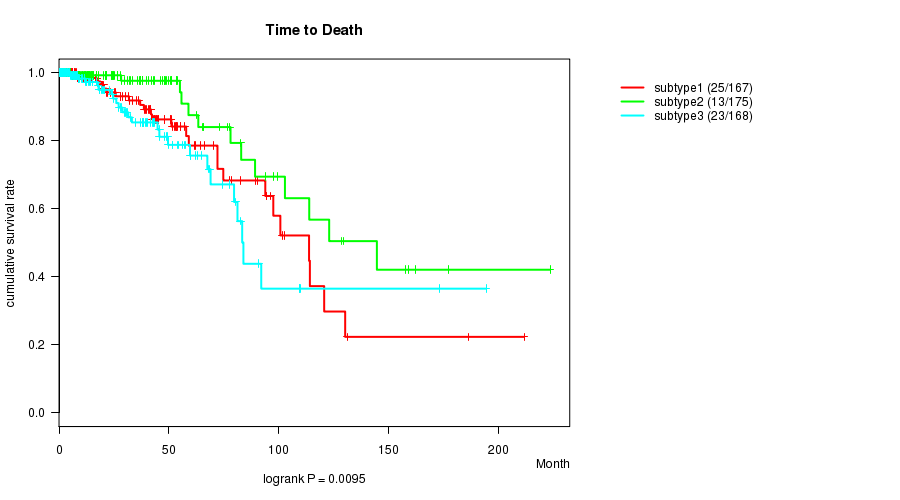
P value = 0.0095 (logrank test)
Table S20. Clustering Approach #4: 'METHLYATION CNMF' versus Clinical Feature #1: 'Time to Death'
| nPatients | nDeath | Duration Range (Median), Month | |
|---|---|---|---|
| ALL | 510 | 61 | 0.0 - 223.4 (17.9) |
| subtype1 | 167 | 25 | 0.0 - 211.5 (23.4) |
| subtype2 | 175 | 13 | 0.1 - 223.4 (13.8) |
| subtype3 | 168 | 23 | 0.0 - 194.3 (17.7) |
Figure S16. Get High-res Image Clustering Approach #4: 'METHLYATION CNMF' versus Clinical Feature #1: 'Time to Death'
P value = 6.66e-05 (ANOVA)
Table S21. Clustering Approach #4: 'METHLYATION CNMF' versus Clinical Feature #2: 'AGE'
| nPatients | Mean (Std.Dev) | |
|---|---|---|
| ALL | 538 | 57.6 (13.1) |
| subtype1 | 178 | 55.4 (12.2) |
| subtype2 | 185 | 56.4 (13.4) |
| subtype3 | 175 | 61.1 (13.1) |
Figure S17. Get High-res Image Clustering Approach #4: 'METHLYATION CNMF' versus Clinical Feature #2: 'AGE'
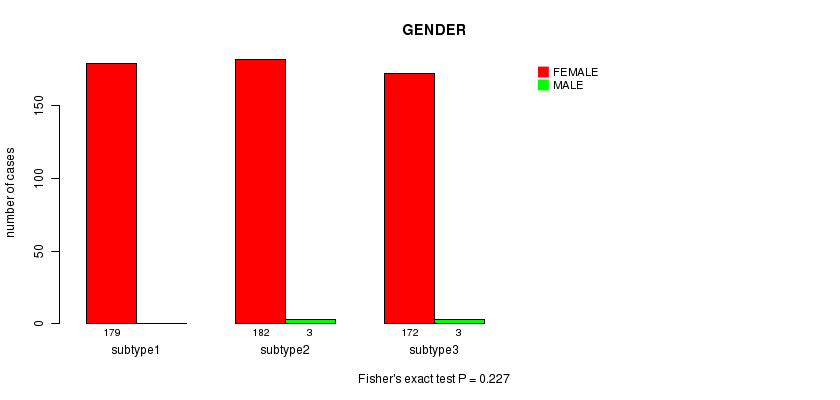
P value = 0.227 (Fisher's exact test)
Table S22. Clustering Approach #4: 'METHLYATION CNMF' versus Clinical Feature #3: 'GENDER'
| nPatients | FEMALE | MALE |
|---|---|---|
| ALL | 533 | 6 |
| subtype1 | 179 | 0 |
| subtype2 | 182 | 3 |
| subtype3 | 172 | 3 |
Figure S18. Get High-res Image Clustering Approach #4: 'METHLYATION CNMF' versus Clinical Feature #3: 'GENDER'
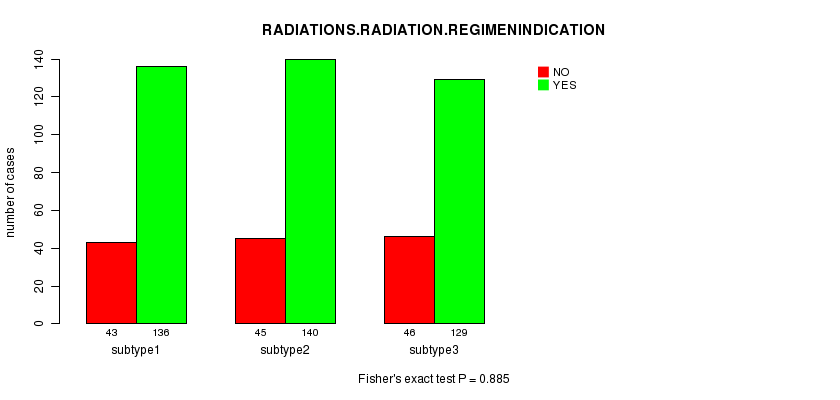
P value = 0.885 (Fisher's exact test)
Table S23. Clustering Approach #4: 'METHLYATION CNMF' versus Clinical Feature #4: 'RADIATIONS.RADIATION.REGIMENINDICATION'
| nPatients | NO | YES |
|---|---|---|
| ALL | 134 | 405 |
| subtype1 | 43 | 136 |
| subtype2 | 45 | 140 |
| subtype3 | 46 | 129 |
Figure S19. Get High-res Image Clustering Approach #4: 'METHLYATION CNMF' versus Clinical Feature #4: 'RADIATIONS.RADIATION.REGIMENINDICATION'
P value = 0.494 (Fisher's exact test)
Table S24. Clustering Approach #4: 'METHLYATION CNMF' versus Clinical Feature #5: 'NEOADJUVANT.THERAPY'
| nPatients | NO | YES |
|---|---|---|
| ALL | 202 | 337 |
| subtype1 | 61 | 118 |
| subtype2 | 71 | 114 |
| subtype3 | 70 | 105 |
Figure S20. Get High-res Image Clustering Approach #4: 'METHLYATION CNMF' versus Clinical Feature #5: 'NEOADJUVANT.THERAPY'
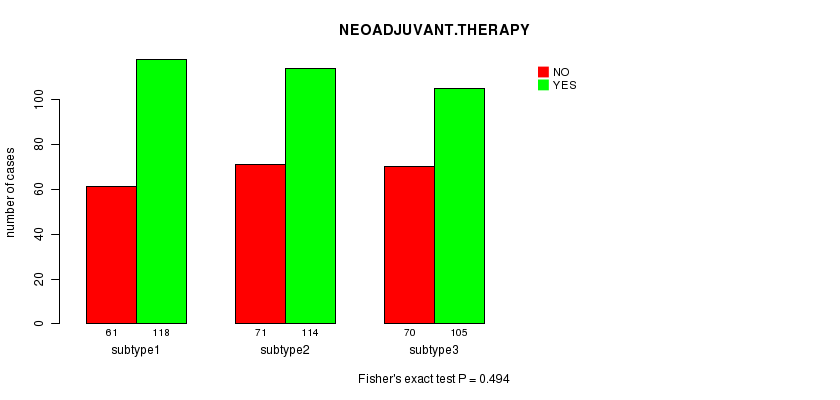
Table S25. Get Full Table Description of clustering approach #5: 'RPPA CNMF subtypes'
| Cluster Labels | 1 | 2 | 3 |
|---|---|---|---|
| Number of samples | 151 | 134 | 123 |
P value = 0.0124 (logrank test)
Table S26. Clustering Approach #5: 'RPPA CNMF subtypes' versus Clinical Feature #1: 'Time to Death'
| nPatients | nDeath | Duration Range (Median), Month | |
|---|---|---|---|
| ALL | 380 | 44 | 0.1 - 189.0 (24.5) |
| subtype1 | 135 | 22 | 0.1 - 186.4 (24.3) |
| subtype2 | 130 | 11 | 0.2 - 146.5 (17.4) |
| subtype3 | 115 | 11 | 0.3 - 189.0 (28.5) |
Figure S21. Get High-res Image Clustering Approach #5: 'RPPA CNMF subtypes' versus Clinical Feature #1: 'Time to Death'
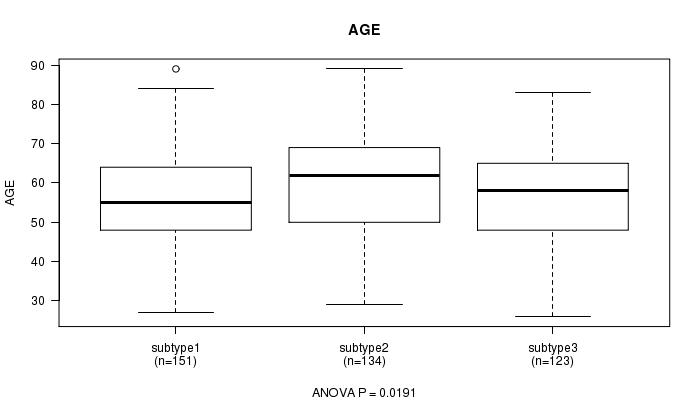
P value = 0.0191 (ANOVA)
Table S27. Clustering Approach #5: 'RPPA CNMF subtypes' versus Clinical Feature #2: 'AGE'
| nPatients | Mean (Std.Dev) | |
|---|---|---|
| ALL | 408 | 57.9 (13.1) |
| subtype1 | 151 | 56.3 (13.1) |
| subtype2 | 134 | 60.4 (13.8) |
| subtype3 | 123 | 57.0 (11.9) |
Figure S22. Get High-res Image Clustering Approach #5: 'RPPA CNMF subtypes' versus Clinical Feature #2: 'AGE'
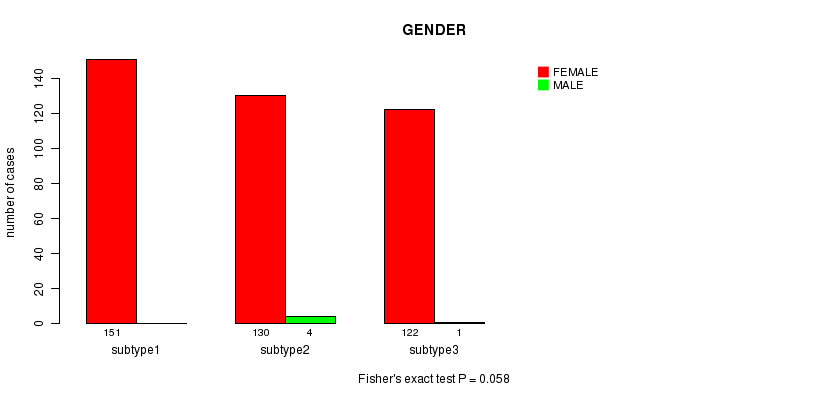
P value = 0.058 (Fisher's exact test)
Table S28. Clustering Approach #5: 'RPPA CNMF subtypes' versus Clinical Feature #3: 'GENDER'
| nPatients | FEMALE | MALE |
|---|---|---|
| ALL | 403 | 5 |
| subtype1 | 151 | 0 |
| subtype2 | 130 | 4 |
| subtype3 | 122 | 1 |
Figure S23. Get High-res Image Clustering Approach #5: 'RPPA CNMF subtypes' versus Clinical Feature #3: 'GENDER'
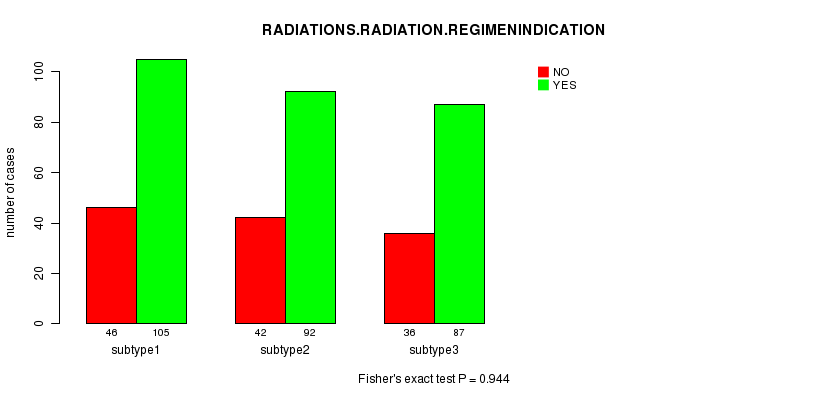
P value = 0.944 (Fisher's exact test)
Table S29. Clustering Approach #5: 'RPPA CNMF subtypes' versus Clinical Feature #4: 'RADIATIONS.RADIATION.REGIMENINDICATION'
| nPatients | NO | YES |
|---|---|---|
| ALL | 124 | 284 |
| subtype1 | 46 | 105 |
| subtype2 | 42 | 92 |
| subtype3 | 36 | 87 |
Figure S24. Get High-res Image Clustering Approach #5: 'RPPA CNMF subtypes' versus Clinical Feature #4: 'RADIATIONS.RADIATION.REGIMENINDICATION'
P value = 0.0593 (Fisher's exact test)
Table S30. Clustering Approach #5: 'RPPA CNMF subtypes' versus Clinical Feature #5: 'NEOADJUVANT.THERAPY'
| nPatients | NO | YES |
|---|---|---|
| ALL | 188 | 220 |
| subtype1 | 64 | 87 |
| subtype2 | 73 | 61 |
| subtype3 | 51 | 72 |
Figure S25. Get High-res Image Clustering Approach #5: 'RPPA CNMF subtypes' versus Clinical Feature #5: 'NEOADJUVANT.THERAPY'
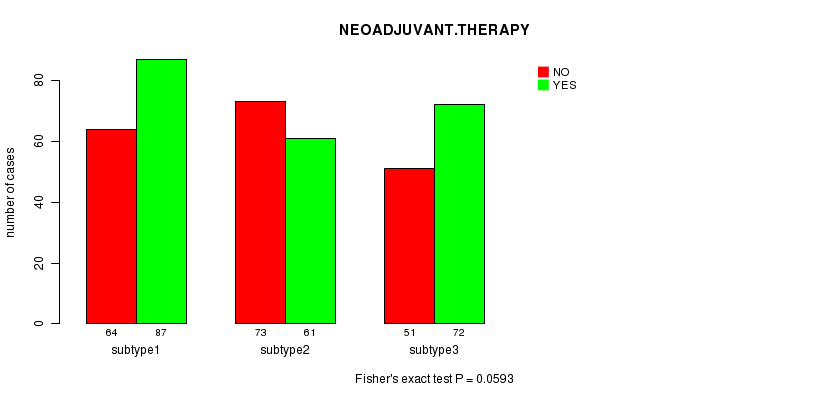
Table S31. Get Full Table Description of clustering approach #6: 'RPPA cHierClus subtypes'
| Cluster Labels | 1 | 2 | 3 |
|---|---|---|---|
| Number of samples | 135 | 162 | 111 |
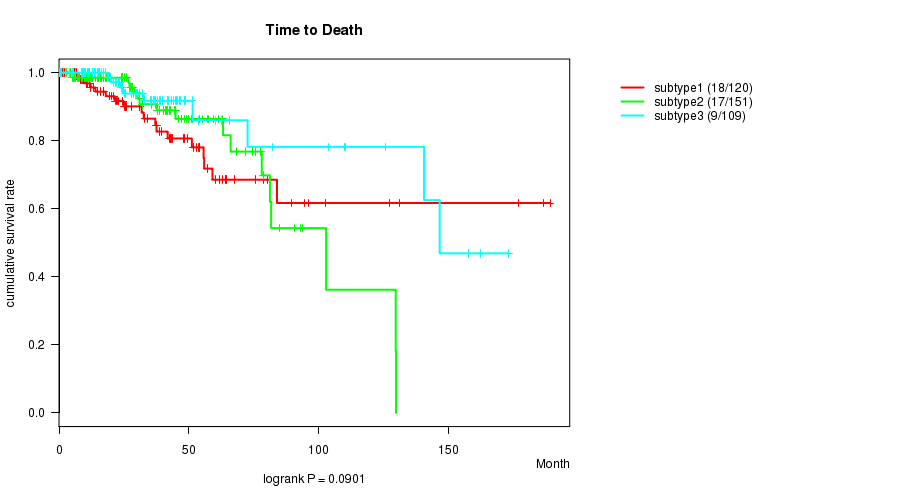
P value = 0.0901 (logrank test)
Table S32. Clustering Approach #6: 'RPPA cHierClus subtypes' versus Clinical Feature #1: 'Time to Death'
| nPatients | nDeath | Duration Range (Median), Month | |
|---|---|---|---|
| ALL | 380 | 44 | 0.1 - 189.0 (24.5) |
| subtype1 | 120 | 18 | 0.1 - 189.0 (23.5) |
| subtype2 | 151 | 17 | 0.2 - 129.7 (19.9) |
| subtype3 | 109 | 9 | 0.2 - 173.0 (25.3) |
Figure S26. Get High-res Image Clustering Approach #6: 'RPPA cHierClus subtypes' versus Clinical Feature #1: 'Time to Death'
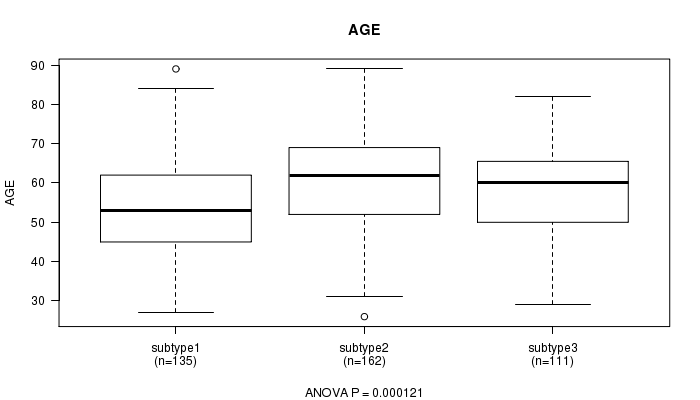
P value = 0.000121 (ANOVA)
Table S33. Clustering Approach #6: 'RPPA cHierClus subtypes' versus Clinical Feature #2: 'AGE'
| nPatients | Mean (Std.Dev) | |
|---|---|---|
| ALL | 408 | 57.9 (13.1) |
| subtype1 | 135 | 54.3 (13.0) |
| subtype2 | 162 | 60.7 (13.4) |
| subtype3 | 111 | 58.0 (11.7) |
Figure S27. Get High-res Image Clustering Approach #6: 'RPPA cHierClus subtypes' versus Clinical Feature #2: 'AGE'
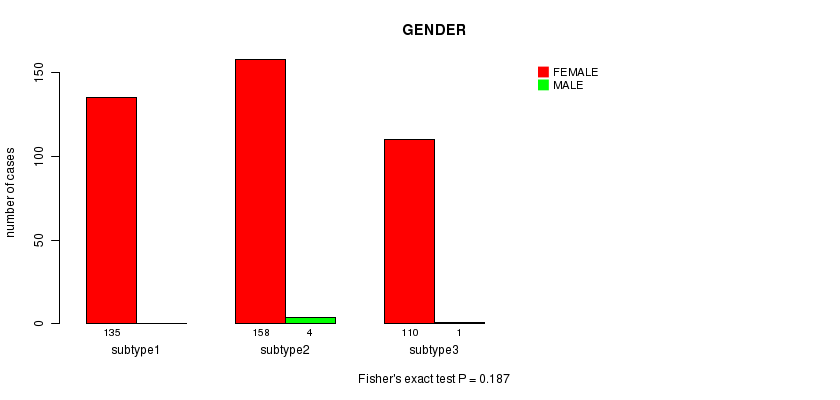
P value = 0.187 (Fisher's exact test)
Table S34. Clustering Approach #6: 'RPPA cHierClus subtypes' versus Clinical Feature #3: 'GENDER'
| nPatients | FEMALE | MALE |
|---|---|---|
| ALL | 403 | 5 |
| subtype1 | 135 | 0 |
| subtype2 | 158 | 4 |
| subtype3 | 110 | 1 |
Figure S28. Get High-res Image Clustering Approach #6: 'RPPA cHierClus subtypes' versus Clinical Feature #3: 'GENDER'
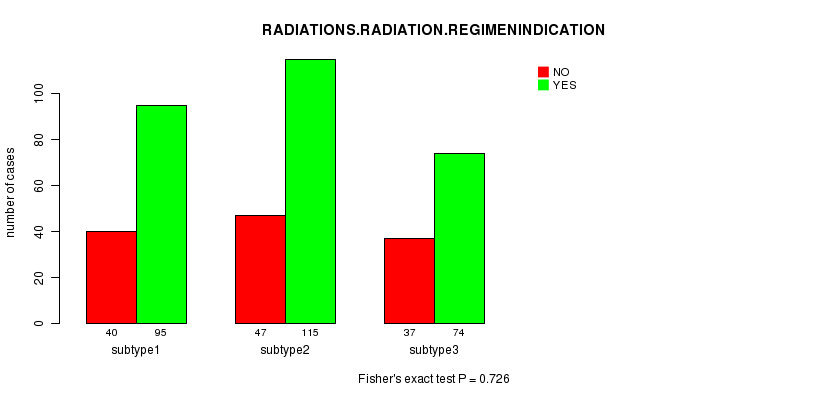
P value = 0.726 (Fisher's exact test)
Table S35. Clustering Approach #6: 'RPPA cHierClus subtypes' versus Clinical Feature #4: 'RADIATIONS.RADIATION.REGIMENINDICATION'
| nPatients | NO | YES |
|---|---|---|
| ALL | 124 | 284 |
| subtype1 | 40 | 95 |
| subtype2 | 47 | 115 |
| subtype3 | 37 | 74 |
Figure S29. Get High-res Image Clustering Approach #6: 'RPPA cHierClus subtypes' versus Clinical Feature #4: 'RADIATIONS.RADIATION.REGIMENINDICATION'
P value = 0.307 (Fisher's exact test)
Table S36. Clustering Approach #6: 'RPPA cHierClus subtypes' versus Clinical Feature #5: 'NEOADJUVANT.THERAPY'
| nPatients | NO | YES |
|---|---|---|
| ALL | 188 | 220 |
| subtype1 | 55 | 80 |
| subtype2 | 80 | 82 |
| subtype3 | 53 | 58 |
Figure S30. Get High-res Image Clustering Approach #6: 'RPPA cHierClus subtypes' versus Clinical Feature #5: 'NEOADJUVANT.THERAPY'
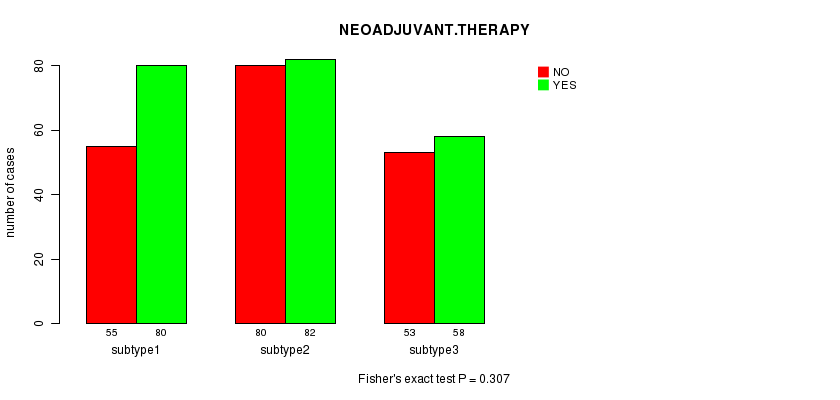
Table S37. Get Full Table Description of clustering approach #7: 'RNAseq CNMF subtypes'
| Cluster Labels | 1 | 2 | 3 |
|---|---|---|---|
| Number of samples | 234 | 147 | 422 |
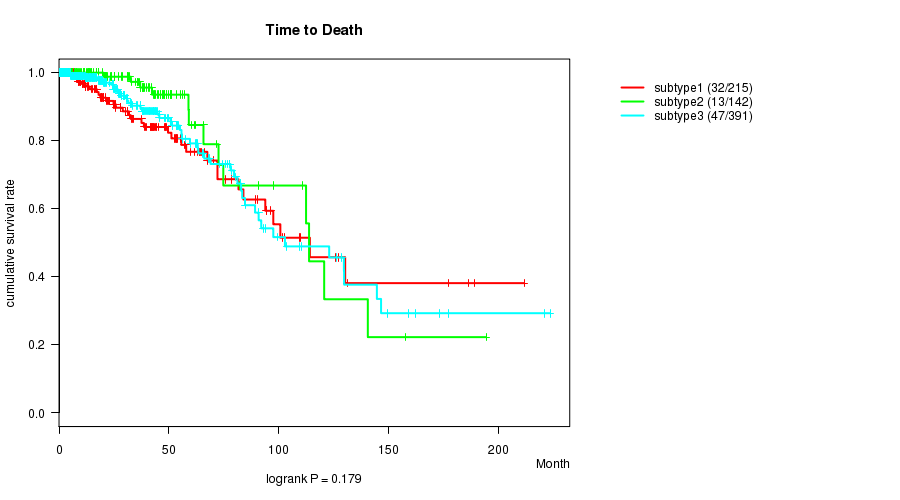
P value = 0.179 (logrank test)
Table S38. Clustering Approach #7: 'RNAseq CNMF subtypes' versus Clinical Feature #1: 'Time to Death'
| nPatients | nDeath | Duration Range (Median), Month | |
|---|---|---|---|
| ALL | 748 | 92 | 0.0 - 223.4 (19.0) |
| subtype1 | 215 | 32 | 0.0 - 211.5 (19.2) |
| subtype2 | 142 | 13 | 0.3 - 194.3 (28.6) |
| subtype3 | 391 | 47 | 0.0 - 223.4 (17.0) |
Figure S31. Get High-res Image Clustering Approach #7: 'RNAseq CNMF subtypes' versus Clinical Feature #1: 'Time to Death'
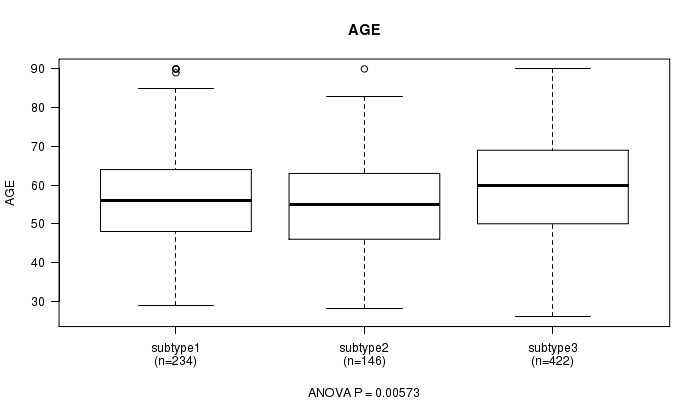
P value = 0.00573 (ANOVA)
Table S39. Clustering Approach #7: 'RNAseq CNMF subtypes' versus Clinical Feature #2: 'AGE'
| nPatients | Mean (Std.Dev) | |
|---|---|---|
| ALL | 802 | 58.0 (13.1) |
| subtype1 | 234 | 57.0 (12.8) |
| subtype2 | 146 | 55.7 (12.3) |
| subtype3 | 422 | 59.3 (13.5) |
Figure S32. Get High-res Image Clustering Approach #7: 'RNAseq CNMF subtypes' versus Clinical Feature #2: 'AGE'
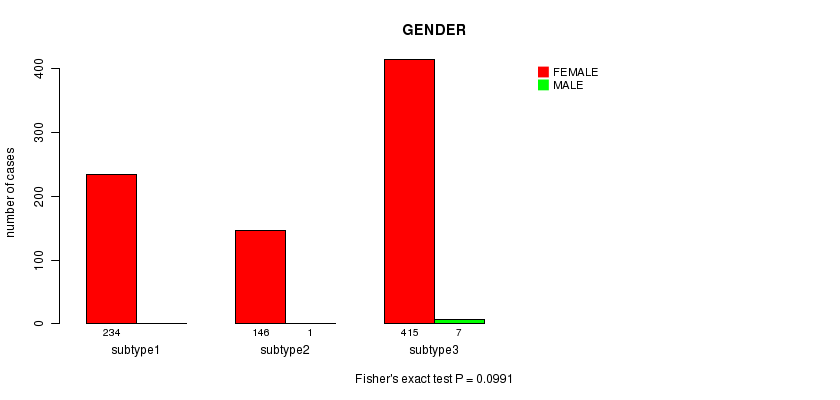
P value = 0.0991 (Fisher's exact test)
Table S40. Clustering Approach #7: 'RNAseq CNMF subtypes' versus Clinical Feature #3: 'GENDER'
| nPatients | FEMALE | MALE |
|---|---|---|
| ALL | 795 | 8 |
| subtype1 | 234 | 0 |
| subtype2 | 146 | 1 |
| subtype3 | 415 | 7 |
Figure S33. Get High-res Image Clustering Approach #7: 'RNAseq CNMF subtypes' versus Clinical Feature #3: 'GENDER'
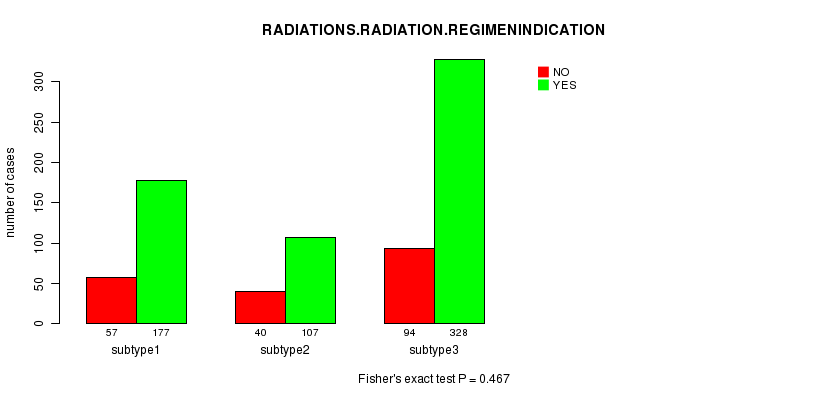
P value = 0.467 (Fisher's exact test)
Table S41. Clustering Approach #7: 'RNAseq CNMF subtypes' versus Clinical Feature #4: 'RADIATIONS.RADIATION.REGIMENINDICATION'
| nPatients | NO | YES |
|---|---|---|
| ALL | 191 | 612 |
| subtype1 | 57 | 177 |
| subtype2 | 40 | 107 |
| subtype3 | 94 | 328 |
Figure S34. Get High-res Image Clustering Approach #7: 'RNAseq CNMF subtypes' versus Clinical Feature #4: 'RADIATIONS.RADIATION.REGIMENINDICATION'
P value = 0.184 (Fisher's exact test)
Table S42. Clustering Approach #7: 'RNAseq CNMF subtypes' versus Clinical Feature #5: 'NEOADJUVANT.THERAPY'
| nPatients | NO | YES |
|---|---|---|
| ALL | 298 | 505 |
| subtype1 | 86 | 148 |
| subtype2 | 64 | 83 |
| subtype3 | 148 | 274 |
Figure S35. Get High-res Image Clustering Approach #7: 'RNAseq CNMF subtypes' versus Clinical Feature #5: 'NEOADJUVANT.THERAPY'
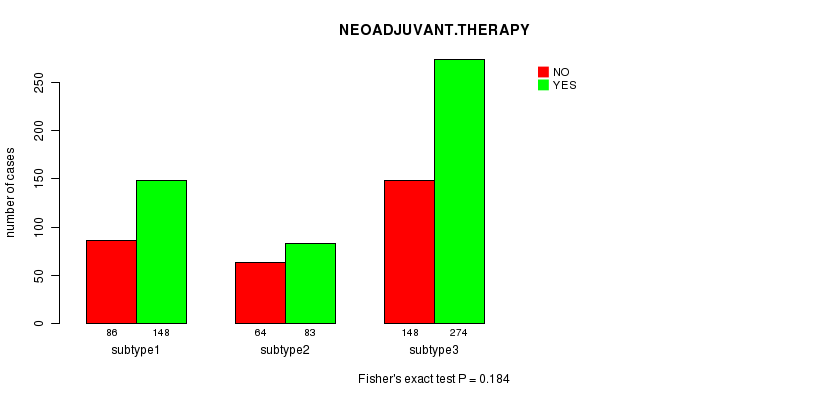
Table S43. Get Full Table Description of clustering approach #8: 'RNAseq cHierClus subtypes'
| Cluster Labels | 1 | 2 | 3 |
|---|---|---|---|
| Number of samples | 235 | 376 | 192 |
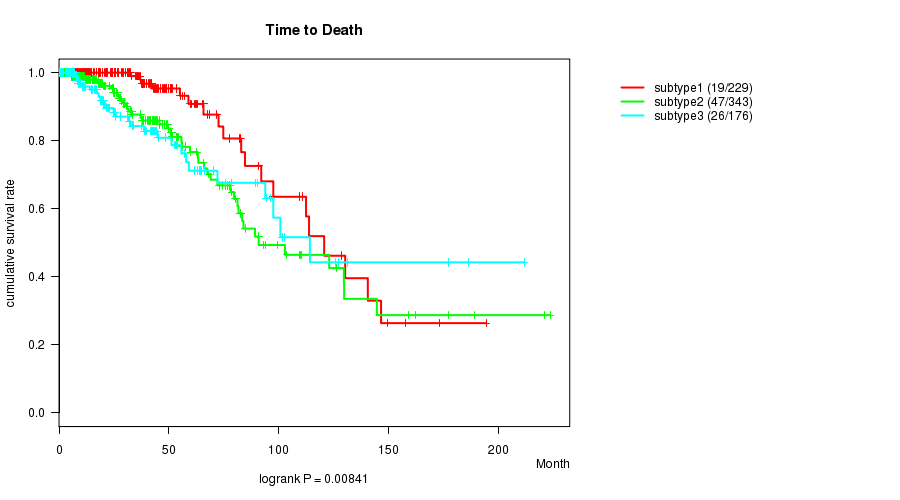
P value = 0.00841 (logrank test)
Table S44. Clustering Approach #8: 'RNAseq cHierClus subtypes' versus Clinical Feature #1: 'Time to Death'
| nPatients | nDeath | Duration Range (Median), Month | |
|---|---|---|---|
| ALL | 748 | 92 | 0.0 - 223.4 (19.0) |
| subtype1 | 229 | 19 | 0.1 - 194.3 (25.4) |
| subtype2 | 343 | 47 | 0.0 - 223.4 (17.0) |
| subtype3 | 176 | 26 | 0.0 - 211.5 (19.1) |
Figure S36. Get High-res Image Clustering Approach #8: 'RNAseq cHierClus subtypes' versus Clinical Feature #1: 'Time to Death'
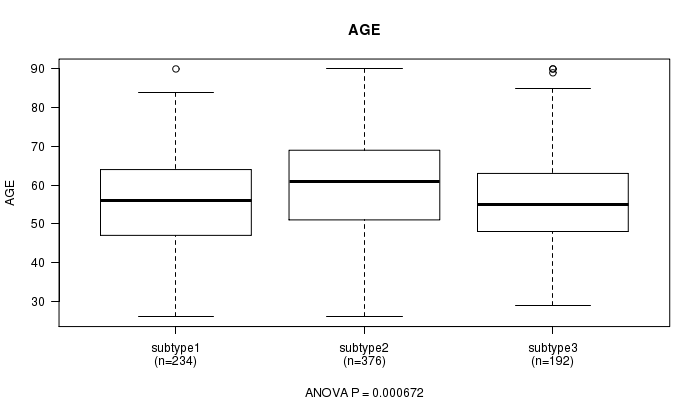
P value = 0.000672 (ANOVA)
Table S45. Clustering Approach #8: 'RNAseq cHierClus subtypes' versus Clinical Feature #2: 'AGE'
| nPatients | Mean (Std.Dev) | |
|---|---|---|
| ALL | 802 | 58.0 (13.1) |
| subtype1 | 234 | 56.2 (12.2) |
| subtype2 | 376 | 59.9 (13.6) |
| subtype3 | 192 | 56.4 (12.8) |
Figure S37. Get High-res Image Clustering Approach #8: 'RNAseq cHierClus subtypes' versus Clinical Feature #2: 'AGE'
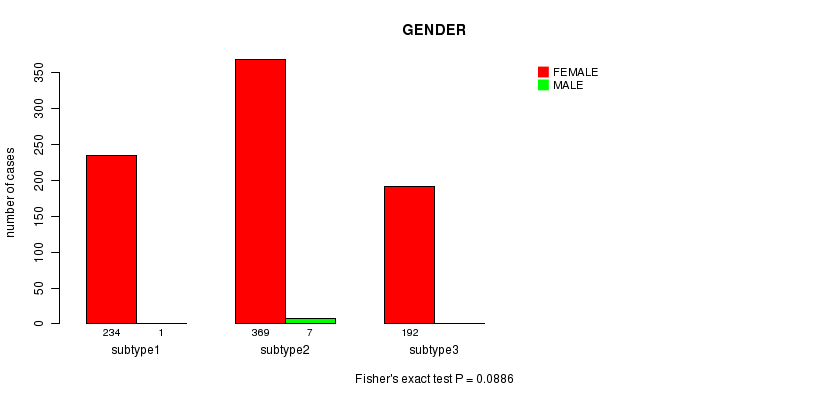
P value = 0.0886 (Fisher's exact test)
Table S46. Clustering Approach #8: 'RNAseq cHierClus subtypes' versus Clinical Feature #3: 'GENDER'
| nPatients | FEMALE | MALE |
|---|---|---|
| ALL | 795 | 8 |
| subtype1 | 234 | 1 |
| subtype2 | 369 | 7 |
| subtype3 | 192 | 0 |
Figure S38. Get High-res Image Clustering Approach #8: 'RNAseq cHierClus subtypes' versus Clinical Feature #3: 'GENDER'
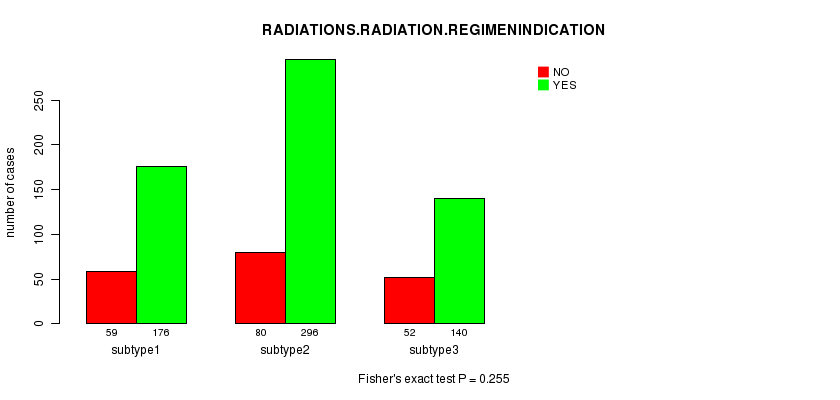
P value = 0.255 (Fisher's exact test)
Table S47. Clustering Approach #8: 'RNAseq cHierClus subtypes' versus Clinical Feature #4: 'RADIATIONS.RADIATION.REGIMENINDICATION'
| nPatients | NO | YES |
|---|---|---|
| ALL | 191 | 612 |
| subtype1 | 59 | 176 |
| subtype2 | 80 | 296 |
| subtype3 | 52 | 140 |
Figure S39. Get High-res Image Clustering Approach #8: 'RNAseq cHierClus subtypes' versus Clinical Feature #4: 'RADIATIONS.RADIATION.REGIMENINDICATION'
P value = 0.0533 (Fisher's exact test)
Table S48. Clustering Approach #8: 'RNAseq cHierClus subtypes' versus Clinical Feature #5: 'NEOADJUVANT.THERAPY'
| nPatients | NO | YES |
|---|---|---|
| ALL | 298 | 505 |
| subtype1 | 101 | 134 |
| subtype2 | 125 | 251 |
| subtype3 | 72 | 120 |
Figure S40. Get High-res Image Clustering Approach #8: 'RNAseq cHierClus subtypes' versus Clinical Feature #5: 'NEOADJUVANT.THERAPY'
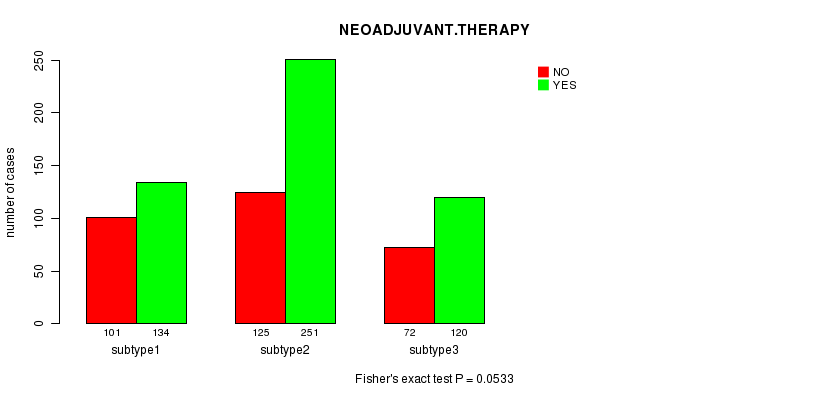
Table S49. Get Full Table Description of clustering approach #9: 'MIRseq CNMF subtypes'
| Cluster Labels | 1 | 2 | 3 |
|---|---|---|---|
| Number of samples | 222 | 378 | 217 |
P value = 0.00857 (logrank test)
Table S50. Clustering Approach #9: 'MIRseq CNMF subtypes' versus Clinical Feature #1: 'Time to Death'
| nPatients | nDeath | Duration Range (Median), Month | |
|---|---|---|---|
| ALL | 758 | 94 | 0.0 - 223.4 (19.0) |
| subtype1 | 211 | 23 | 0.3 - 159.1 (23.8) |
| subtype2 | 349 | 38 | 0.0 - 223.4 (17.9) |
| subtype3 | 198 | 33 | 0.0 - 211.5 (18.0) |
Figure S41. Get High-res Image Clustering Approach #9: 'MIRseq CNMF subtypes' versus Clinical Feature #1: 'Time to Death'
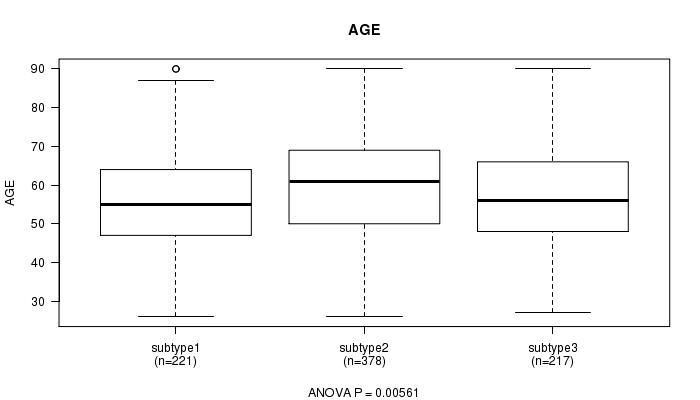
P value = 0.00561 (ANOVA)
Table S51. Clustering Approach #9: 'MIRseq CNMF subtypes' versus Clinical Feature #2: 'AGE'
| nPatients | Mean (Std.Dev) | |
|---|---|---|
| ALL | 816 | 58.3 (13.3) |
| subtype1 | 221 | 56.4 (12.7) |
| subtype2 | 378 | 59.8 (13.6) |
| subtype3 | 217 | 57.4 (13.1) |
Figure S42. Get High-res Image Clustering Approach #9: 'MIRseq CNMF subtypes' versus Clinical Feature #2: 'AGE'
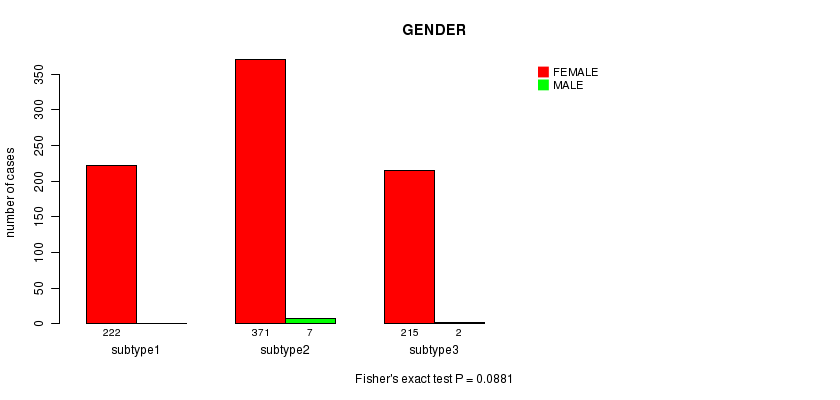
P value = 0.0881 (Fisher's exact test)
Table S52. Clustering Approach #9: 'MIRseq CNMF subtypes' versus Clinical Feature #3: 'GENDER'
| nPatients | FEMALE | MALE |
|---|---|---|
| ALL | 808 | 9 |
| subtype1 | 222 | 0 |
| subtype2 | 371 | 7 |
| subtype3 | 215 | 2 |
Figure S43. Get High-res Image Clustering Approach #9: 'MIRseq CNMF subtypes' versus Clinical Feature #3: 'GENDER'
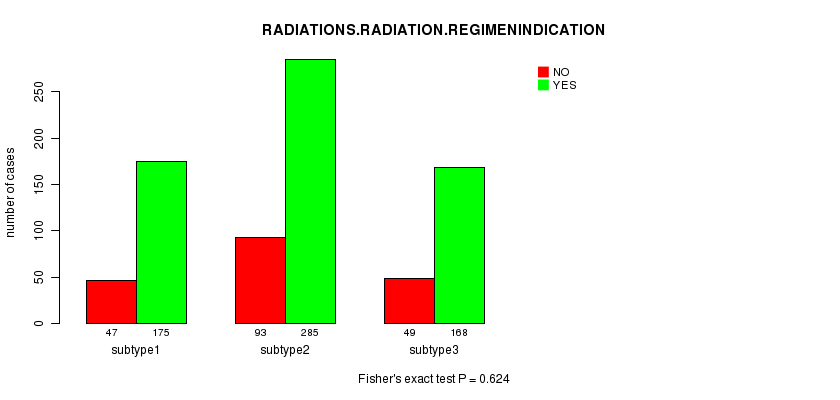
P value = 0.624 (Fisher's exact test)
Table S53. Clustering Approach #9: 'MIRseq CNMF subtypes' versus Clinical Feature #4: 'RADIATIONS.RADIATION.REGIMENINDICATION'
| nPatients | NO | YES |
|---|---|---|
| ALL | 189 | 628 |
| subtype1 | 47 | 175 |
| subtype2 | 93 | 285 |
| subtype3 | 49 | 168 |
Figure S44. Get High-res Image Clustering Approach #9: 'MIRseq CNMF subtypes' versus Clinical Feature #4: 'RADIATIONS.RADIATION.REGIMENINDICATION'
P value = 0.273 (Fisher's exact test)
Table S54. Clustering Approach #9: 'MIRseq CNMF subtypes' versus Clinical Feature #5: 'NEOADJUVANT.THERAPY'
| nPatients | NO | YES |
|---|---|---|
| ALL | 299 | 518 |
| subtype1 | 87 | 135 |
| subtype2 | 142 | 236 |
| subtype3 | 70 | 147 |
Figure S45. Get High-res Image Clustering Approach #9: 'MIRseq CNMF subtypes' versus Clinical Feature #5: 'NEOADJUVANT.THERAPY'
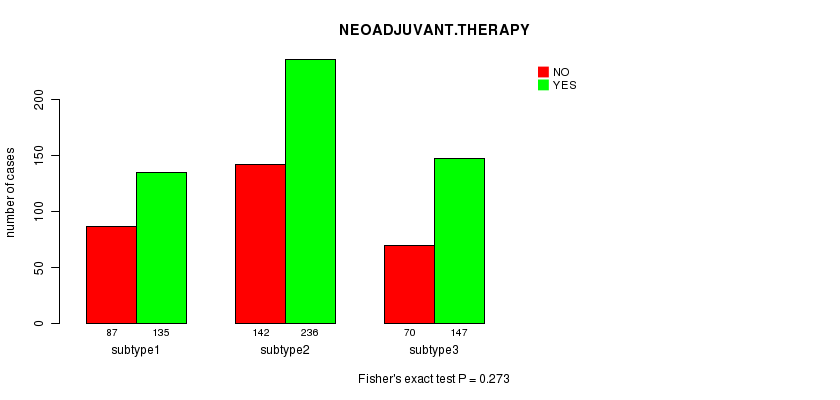
Table S55. Get Full Table Description of clustering approach #10: 'MIRseq cHierClus subtypes'
| Cluster Labels | 1 | 2 | 3 |
|---|---|---|---|
| Number of samples | 67 | 189 | 561 |
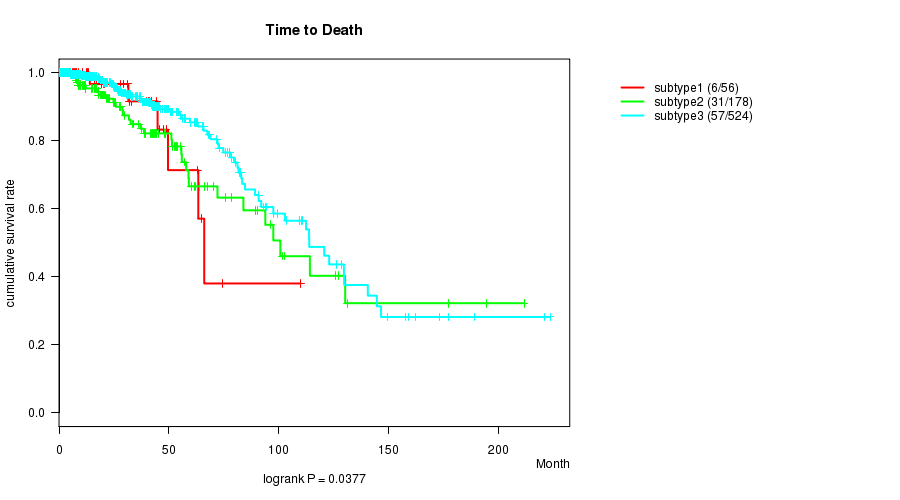
P value = 0.0377 (logrank test)
Table S56. Clustering Approach #10: 'MIRseq cHierClus subtypes' versus Clinical Feature #1: 'Time to Death'
| nPatients | nDeath | Duration Range (Median), Month | |
|---|---|---|---|
| ALL | 758 | 94 | 0.0 - 223.4 (19.0) |
| subtype1 | 56 | 6 | 0.0 - 109.9 (16.1) |
| subtype2 | 178 | 31 | 0.1 - 211.5 (20.1) |
| subtype3 | 524 | 57 | 0.1 - 223.4 (18.6) |
Figure S46. Get High-res Image Clustering Approach #10: 'MIRseq cHierClus subtypes' versus Clinical Feature #1: 'Time to Death'
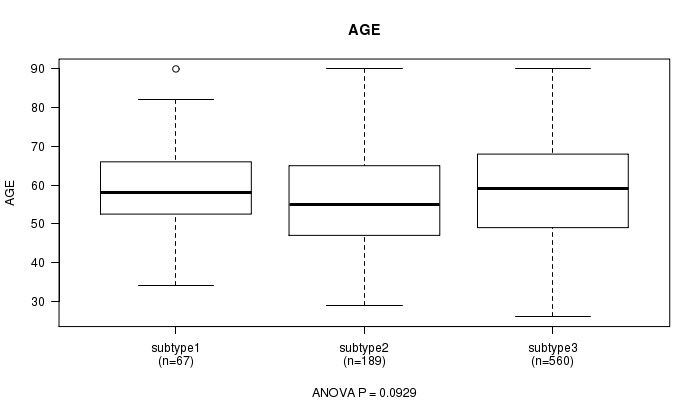
P value = 0.0929 (ANOVA)
Table S57. Clustering Approach #10: 'MIRseq cHierClus subtypes' versus Clinical Feature #2: 'AGE'
| nPatients | Mean (Std.Dev) | |
|---|---|---|
| ALL | 816 | 58.3 (13.3) |
| subtype1 | 67 | 59.1 (11.3) |
| subtype2 | 189 | 56.4 (13.0) |
| subtype3 | 560 | 58.8 (13.5) |
Figure S47. Get High-res Image Clustering Approach #10: 'MIRseq cHierClus subtypes' versus Clinical Feature #2: 'AGE'
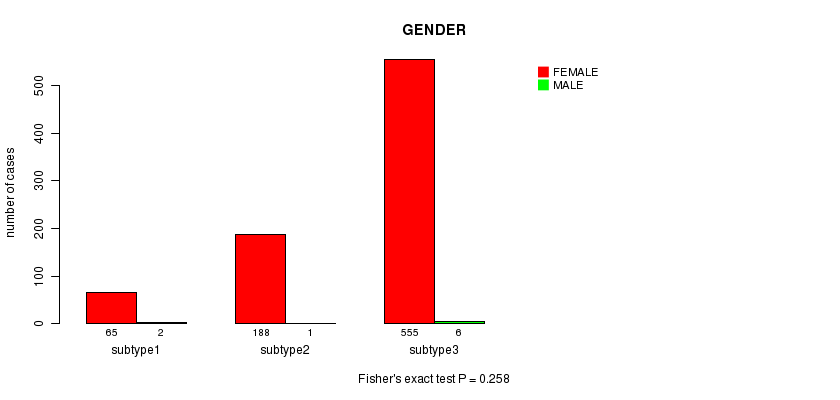
P value = 0.258 (Fisher's exact test)
Table S58. Clustering Approach #10: 'MIRseq cHierClus subtypes' versus Clinical Feature #3: 'GENDER'
| nPatients | FEMALE | MALE |
|---|---|---|
| ALL | 808 | 9 |
| subtype1 | 65 | 2 |
| subtype2 | 188 | 1 |
| subtype3 | 555 | 6 |
Figure S48. Get High-res Image Clustering Approach #10: 'MIRseq cHierClus subtypes' versus Clinical Feature #3: 'GENDER'
P value = 0.883 (Fisher's exact test)
Table S59. Clustering Approach #10: 'MIRseq cHierClus subtypes' versus Clinical Feature #4: 'RADIATIONS.RADIATION.REGIMENINDICATION'
| nPatients | NO | YES |
|---|---|---|
| ALL | 189 | 628 |
| subtype1 | 17 | 50 |
| subtype2 | 44 | 145 |
| subtype3 | 128 | 433 |
Figure S49. Get High-res Image Clustering Approach #10: 'MIRseq cHierClus subtypes' versus Clinical Feature #4: 'RADIATIONS.RADIATION.REGIMENINDICATION'
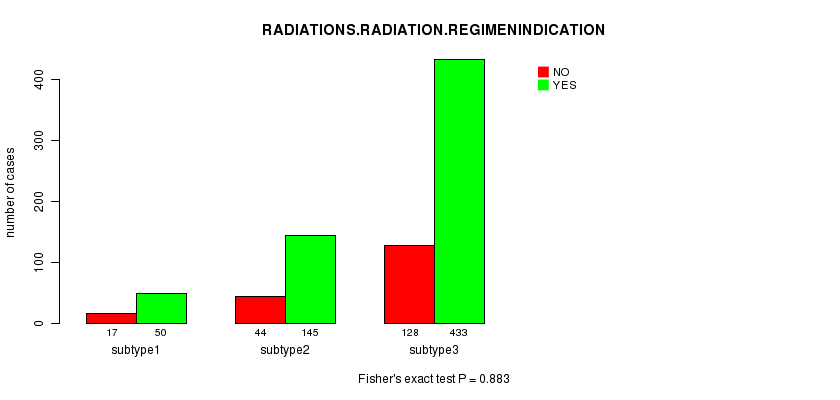
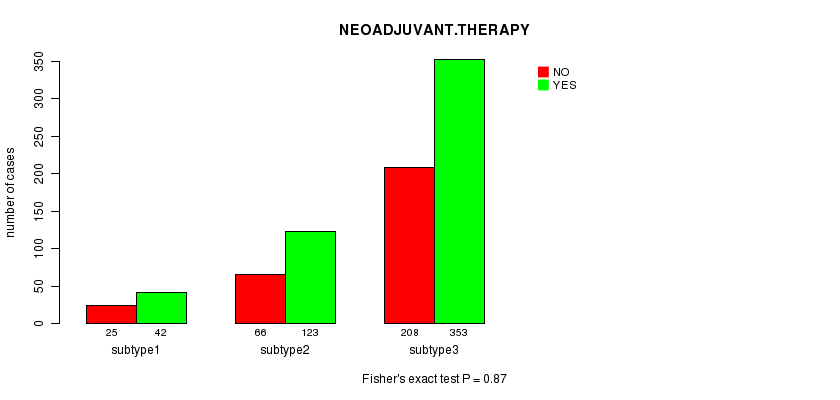
P value = 0.87 (Fisher's exact test)
Table S60. Clustering Approach #10: 'MIRseq cHierClus subtypes' versus Clinical Feature #5: 'NEOADJUVANT.THERAPY'
| nPatients | NO | YES |
|---|---|---|
| ALL | 299 | 518 |
| subtype1 | 25 | 42 |
| subtype2 | 66 | 123 |
| subtype3 | 208 | 353 |
Figure S50. Get High-res Image Clustering Approach #10: 'MIRseq cHierClus subtypes' versus Clinical Feature #5: 'NEOADJUVANT.THERAPY'
-
Cluster data file = BRCA.mergedcluster.txt
-
Clinical data file = BRCA.clin.merged.picked.txt
-
Number of patients = 862
-
Number of clustering approaches = 10
-
Number of selected clinical features = 5
-
Exclude small clusters that include fewer than K patients, K = 3
consensus non-negative matrix factorization clustering approach (Brunet et al. 2004)
Resampling-based clustering method (Monti et al. 2003)
For survival clinical features, the Kaplan-Meier survival curves of tumors with and without gene mutations were plotted and the statistical significance P values were estimated by logrank test (Bland and Altman 2004) using the 'survdiff' function in R
For continuous numerical clinical features, one-way analysis of variance (Howell 2002) was applied to compare the clinical values between tumor subtypes using 'anova' function in R
For multi-class clinical features (nominal or ordinal), Chi-square tests (Greenwood and Nikulin 1996) were used to estimate the P values using the 'chisq.test' function in R
For binary clinical features, two-tailed Fisher's exact tests (Fisher 1922) were used to estimate the P values using the 'fisher.test' function in R
This is an experimental feature. The full results of the analysis summarized in this report can be downloaded from the TCGA Data Coordination Center.