This report serves to describe the mutational landscape and properties of a given individual set, as well as rank genes and genesets according to mutational significance. MutSig v2.0 was used to generate the results found in this report.
-
Working with individual set: CESC
-
Number of patients in set: 36
The input for this pipeline is a set of individuals with the following files associated for each:
-
An annotated .maf file describing the mutations called for the respective individual, and their properties.
-
A .wig file that contains information about the coverage of the sample.
-
MAF used for this analysis:CESC.final_analysis_set.maf
-
Significantly mutated genes (q ≤ 0.1): 3
-
Mutations seen in COSMIC: 31
-
Significantly mutated genes in COSMIC territory: 1
-
Genes with clustered mutations (≤ 3 aa apart): 0
-
Significantly mutated genesets: 7
-
Significantly mutated genesets: (excluding sig. mutated genes):0
-
Read 36 MAFs of type "Broad"
-
Total number of mutations in input MAFs: 9967
-
After removing 2681 noncoding mutations: 7286
-
After collapsing adjacent/redundant mutations: 7271
-
Number of mutations before filtering: 7271
-
After removing 41 mutations outside gene set: 7230
-
After removing 9 mutations outside category set: 7221
Table 1. Get Full Table Table representing breakdown of mutations by type.
| type | count |
|---|---|
| Frame_Shift_Del | 19 |
| Frame_Shift_Ins | 17 |
| In_Frame_Del | 9 |
| In_Frame_Ins | 1 |
| Missense_Mutation | 4748 |
| Nonsense_Mutation | 449 |
| Nonstop_Mutation | 11 |
| Silent | 1883 |
| Splice_Site | 84 |
| Total | 7221 |
Table 2. Get Full Table A breakdown of mutation rates per category discovered for this individual set.
| category | n | N | rate | rate_per_mb | relative_rate | exp_ns_s_ratio |
|---|---|---|---|---|---|---|
| Tp*C->(T/G) | 3265 | 138808933 | 0.000024 | 24 | 4.6 | 3 |
| Tp*C->A | 172 | 138808933 | 1.2e-06 | 1.2 | 0.24 | 4 |
| (A/C/G)p*C->mut | 1022 | 391812501 | 2.6e-06 | 2.6 | 0.51 | 3.2 |
| A->mut | 287 | 513858559 | 5.6e-07 | 0.56 | 0.11 | 3.9 |
| indel+null | 583 | 1044479993 | 5.6e-07 | 0.56 | 0.11 | NaN |
| double_null | 9 | 1044479993 | 8.6e-09 | 0.0086 | 0.0017 | NaN |
| Total | 5338 | 1044479993 | 5.1e-06 | 5.1 | 1 | 3.5 |
The x axis represents the samples. The y axis represents the exons, one row per exon, and they are sorted by average coverage across samples. For exons with exactly the same average coverage, they are sorted next by the %GC of the exon. (The secondary sort is especially useful for the zero-coverage exons at the bottom).
Figure 1.
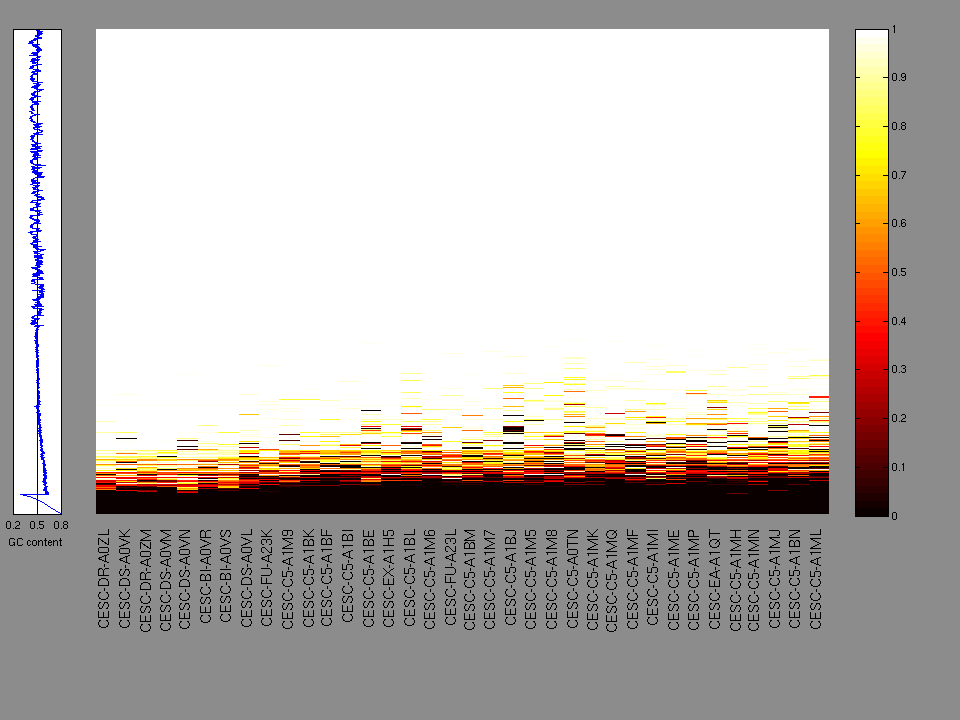
Figure 2. Patients counts and rates file used to generate this plot: CESC.patients.counts_and_rates.txt
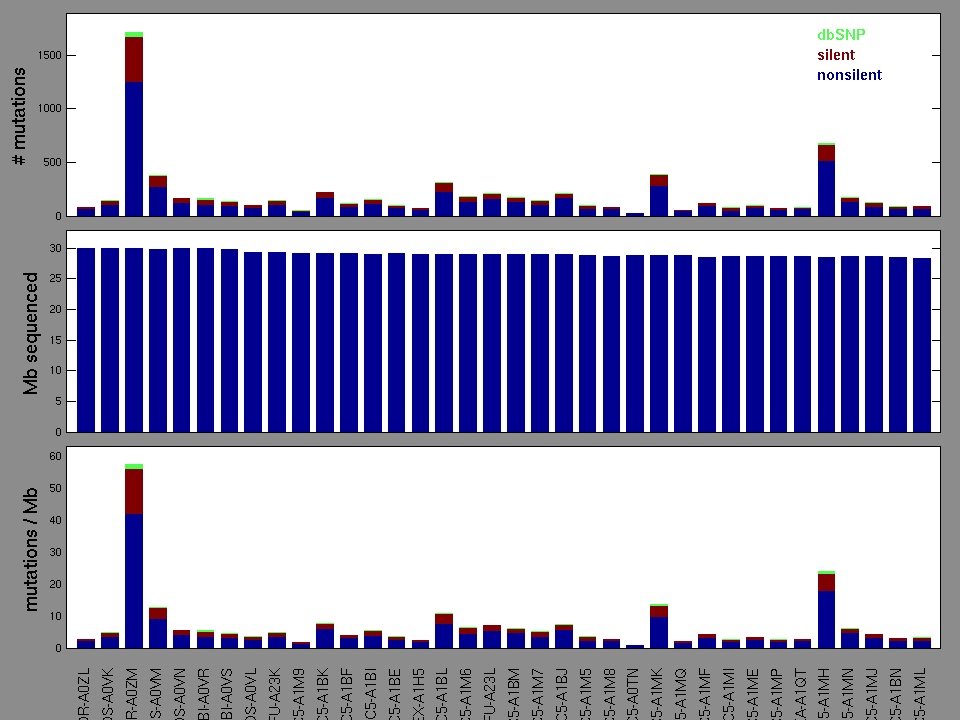
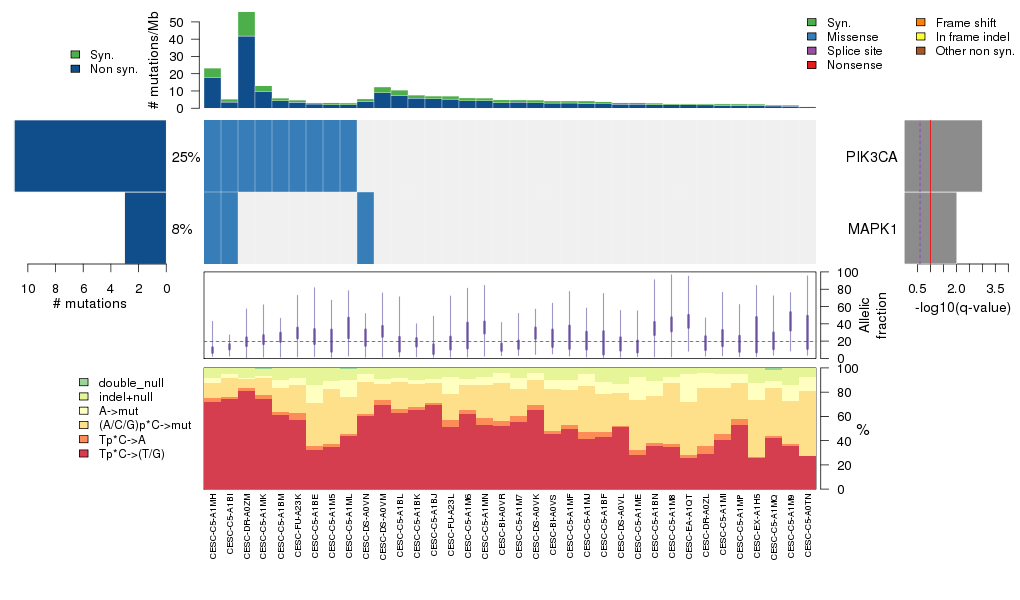
Figure 3. Get High-res Image The matrix in the center of the figure represents individual mutations in patient samples, color-coded by type of mutation, for the significantly mutated genes. The rate of synonymous and non-synonymous mutations is displayed at the top of the matrix. The barplot on the left of the matrix shows the number of mutations in each gene. The percentages represent the fraction of tumors with at least one mutation in the specified gene. The barplot to the right of the matrix displays the q-values for the most significantly mutated genes. The purple boxplots below the matrix (only displayed if required columns are present in the provided MAF) represent the distributions of allelic fractions observed in each sample. The plot at the bottom represents the base substitution distribution of individual samples, using the same categories that were used to calculate significance.
Column Descriptions:
-
N = number of sequenced bases in this gene across the individual set
-
n = number of (nonsilent) mutations in this gene across the individual set
-
npat = number of patients (individuals) with at least one nonsilent mutation
-
nsite = number of unique sites having a non-silent mutation
-
nsil = number of silent mutations in this gene across the individual set
-
n1 = number of nonsilent mutations of type: Tp*C->(T/G)
-
n2 = number of nonsilent mutations of type: Tp*C->A
-
n3 = number of nonsilent mutations of type: (A/C/G)p*C->mut
-
n4 = number of nonsilent mutations of type: A->mut
-
n5 = number of nonsilent mutations of type: indel+null
-
p_classic = p-value for the observed amount of nonsilent mutations being elevated in this gene
-
p_ns_s = p-value for the observed nonsilent/silent ratio being elevated in this gene
-
p_ks = p-value for clustering of mutations (Kolmogorov-Smirnoff test)
-
p_cons = p-value for enrichment of mutations at evolutionarily most-conserved sites in gene
-
p_joint = p-value for clustering + conservation
-
p = p-value (overall)
-
q = q-value, False Discovery Rate (Benjamini-Hochberg procedure)
Table 3. Get Full Table A Ranked List of Significantly Mutated Genes. Number of significant genes found: 3. Number of genes displayed: 35. Click on a gene name to display its stick figure depicting the distribution of mutations and mutation types across the chosen gene (this feature may not be available for all significant genes).
| rank | gene | description | N | n | npat | nsite | nsil | n1 | n2 | n3 | n4 | n5 | n6 | p_classic | p_ns_s | p_ks | p_cons | p_joint | p | q |
|---|---|---|---|---|---|---|---|---|---|---|---|---|---|---|---|---|---|---|---|---|
| 1 | PIK3CA | phosphoinositide-3-kinase, catalytic, alpha polypeptide | 118073 | 11 | 9 | 4 | 0 | 10 | 0 | 0 | 1 | 0 | 0 | 1.1e-08 | 0.12 | 5.2e-06 | 0.0087 | 0 | <1.00e-15 | <1.79e-11 |
| 2 | MAPK1 | mitogen-activated protein kinase 1 | 35708 | 3 | 3 | 1 | 0 | 3 | 0 | 0 | 0 | 0 | 0 | 0.00069 | 0.41 | 8e-05 | 0.15 | 8e-05 | 9.76e-07 | 0.0088 |
| 3 | NFYB | nuclear transcription factor Y, beta | 23472 | 2 | 2 | 1 | 0 | 0 | 0 | 0 | 0 | 2 | 0 | 0.00052 | 0.55 | 0.032 | 0.0016 | 0.0048 | 0.000034 | 0.16 |
| 4 | FAM49A | family with sequence similarity 49, member A | 36191 | 2 | 2 | 2 | 0 | 0 | 0 | 1 | 1 | 0 | 0 | 0.0015 | 0.64 | 0.0018 | 0.51 | 0.0018 | 0.000036 | 0.16 |
| 5 | NFE2L2 | nuclear factor (erythroid-derived 2)-like 2 | 64404 | 6 | 5 | 5 | 0 | 4 | 0 | 0 | 1 | 1 | 0 | 0.000017 | 0.34 | 0.78 | 0.052 | 0.27 | 0.000060 | 0.21 |
| 6 | CPNE3 | copine III | 59970 | 3 | 2 | 3 | 0 | 2 | 0 | 0 | 0 | 1 | 0 | 0.03 | 0.51 | 0.00033 | 0.97 | 0.00033 | 0.00012 | 0.36 |
| 7 | TADA2A | 50258 | 2 | 2 | 2 | 1 | 1 | 0 | 0 | 1 | 0 | 0 | 0.0072 | 0.88 | 0.0019 | 0.086 | 0.0019 | 0.00017 | 0.36 | |
| 8 | FCRL1 | Fc receptor-like 1 | 47973 | 3 | 3 | 3 | 0 | 1 | 0 | 0 | 2 | 0 | 0 | 0.0002 | 0.45 | 0.029 | 0.65 | 0.069 | 0.00017 | 0.36 |
| 9 | PTEN | phosphatase and tensin homolog (mutated in multiple advanced cancers 1) | 43485 | 3 | 3 | 3 | 0 | 0 | 0 | 0 | 0 | 3 | 0 | 0.000041 | 0.62 | 0.27 | 0.8 | 0.37 | 0.00018 | 0.36 |
| 10 | ALS2 | amyotrophic lateral sclerosis 2 (juvenile) | 181332 | 2 | 1 | 2 | 0 | 0 | 0 | 0 | 1 | 1 | 0 | 0.23 | 0.64 | 0.00057 | 0.071 | 0.000082 | 0.00022 | 0.36 |
| 11 | POU4F1 | POU class 4 homeobox 1 | 20132 | 3 | 3 | 2 | 0 | 1 | 0 | 0 | 0 | 2 | 0 | 4e-05 | 0.66 | 0.36 | 0.54 | 0.47 | 0.00022 | 0.36 |
| 12 | GPR153 | G protein-coupled receptor 153 | 37643 | 2 | 2 | 2 | 0 | 0 | 0 | 1 | 1 | 0 | 0 | 0.0015 | 0.61 | 0.13 | 0.03 | 0.015 | 0.00026 | 0.39 |
| 13 | TIE1 | tyrosine kinase with immunoglobulin-like and EGF-like domains 1 | 115718 | 4 | 3 | 4 | 0 | 0 | 1 | 2 | 0 | 1 | 0 | 0.0018 | 0.27 | 0.051 | 0.022 | 0.018 | 0.00036 | 0.44 |
| 14 | AQP2 | aquaporin 2 (collecting duct) | 27218 | 3 | 3 | 3 | 0 | 1 | 0 | 1 | 1 | 0 | 0 | 0.000063 | 0.34 | 0.44 | 0.11 | 0.5 | 0.00036 | 0.44 |
| 15 | C2CD3 | C2 calcium-dependent domain containing 3 | 215830 | 2 | 2 | 2 | 0 | 1 | 0 | 1 | 0 | 0 | 0 | 0.24 | 0.61 | 0.00014 | 0.33 | 0.00014 | 0.00037 | 0.44 |
| 16 | LRP1 | low density lipoprotein-related protein 1 (alpha-2-macroglobulin receptor) | 489294 | 2 | 2 | 2 | 2 | 1 | 0 | 1 | 0 | 0 | 0 | 1 | 0.96 | 0.01 | 0.00016 | 0.000054 | 0.00058 | 0.63 |
| 17 | DNAJB1 | DnaJ (Hsp40) homolog, subfamily B, member 1 | 36199 | 5 | 3 | 5 | 0 | 3 | 1 | 0 | 0 | 1 | 0 | 0.00018 | 0.22 | 0.45 | 0.14 | 0.33 | 0.00064 | 0.63 |
| 18 | ZNF645 | zinc finger protein 645 | 46152 | 2 | 2 | 1 | 0 | 0 | 0 | 2 | 0 | 0 | 0 | 0.0031 | 0.69 | 0.003 | 0.061 | 0.019 | 0.00064 | 0.63 |
| 19 | GGH | gamma-glutamyl hydrolase (conjugase, folylpolygammaglutamyl hydrolase) | 32271 | 2 | 2 | 2 | 0 | 1 | 0 | 1 | 0 | 0 | 0 | 0.0042 | 0.67 | 0.2 | 0.042 | 0.016 | 0.00073 | 0.63 |
| 20 | SVIP | 7089 | 1 | 1 | 1 | 0 | 0 | 0 | 0 | 0 | 1 | 0 | 0.00079 | 0.96 | NaN | NaN | NaN | 0.00079 | 0.63 | |
| 21 | TMEM51 | transmembrane protein 51 | 27562 | 3 | 3 | 3 | 0 | 1 | 0 | 1 | 1 | 0 | 0 | 0.0002 | 0.42 | 0.27 | 0.83 | 0.39 | 0.00082 | 0.63 |
| 22 | HOXA4 | homeobox A4 | 15624 | 2 | 2 | 2 | 1 | 2 | 0 | 0 | 0 | 0 | 0 | 0.0011 | 0.8 | 0.071 | 0.083 | 0.071 | 0.00084 | 0.63 |
| 23 | DALRD3 | DALR anticodon binding domain containing 3 | 43562 | 4 | 2 | 4 | 1 | 2 | 1 | 1 | 0 | 0 | 0 | 0.00078 | 0.51 | 0.038 | 0.6 | 0.1 | 0.00085 | 0.63 |
| 24 | FETUB | fetuin B | 42308 | 2 | 2 | 2 | 0 | 1 | 0 | 0 | 1 | 0 | 0 | 0.0073 | 0.6 | 0.083 | 0.024 | 0.012 | 0.00088 | 0.63 |
| 25 | USP26 | ubiquitin specific peptidase 26 | 98820 | 2 | 2 | 2 | 0 | 1 | 0 | 0 | 0 | 1 | 0 | 0.02 | 0.69 | 0.034 | 0.0052 | 0.0042 | 0.00089 | 0.63 |
| 26 | BAI1 | brain-specific angiogenesis inhibitor 1 | 80396 | 3 | 3 | 3 | 0 | 1 | 0 | 2 | 0 | 0 | 0 | 0.0008 | 0.32 | 0.038 | 0.63 | 0.11 | 0.00092 | 0.63 |
| 27 | RYR2 | ryanodine receptor 2 (cardiac) | 480994 | 8 | 7 | 8 | 1 | 4 | 0 | 2 | 1 | 1 | 0 | 0.0016 | 0.35 | 0.038 | 0.47 | 0.06 | 0.00100 | 0.65 |
| 28 | KPNA2 | karyopherin alpha 2 (RAG cohort 1, importin alpha 1) | 58680 | 3 | 3 | 3 | 1 | 2 | 1 | 0 | 0 | 0 | 0 | 0.00061 | 0.81 | 0.17 | 0.28 | 0.16 | 0.0010 | 0.65 |
| 29 | OR5H6 | olfactory receptor, family 5, subfamily H, member 6 | 35322 | 3 | 3 | 3 | 0 | 1 | 0 | 0 | 1 | 1 | 0 | 0.00011 | 0.39 | 0.78 | 0.64 | 0.98 | 0.0010 | 0.65 |
| 30 | SNTG2 | syntrophin, gamma 2 | 41640 | 2 | 2 | 2 | 0 | 2 | 0 | 0 | 0 | 0 | 0 | 0.0026 | 0.51 | 0.013 | 0.65 | 0.05 | 0.0013 | 0.79 |
| 31 | HRCT1 | 10323 | 1 | 1 | 1 | 0 | 0 | 0 | 0 | 1 | 0 | 0 | 0.0014 | 0.76 | NaN | NaN | NaN | 0.0014 | 0.82 | |
| 32 | NTNG2 | netrin G2 | 46701 | 3 | 3 | 3 | 0 | 2 | 0 | 1 | 0 | 0 | 0 | 0.0011 | 0.34 | 0.16 | 0.15 | 0.14 | 0.0015 | 0.82 |
| 33 | VWA3A | von Willebrand factor A domain containing 3A | 91313 | 3 | 3 | 3 | 1 | 1 | 0 | 0 | 1 | 1 | 0 | 0.0016 | 0.75 | 0.058 | 0.79 | 0.099 | 0.0015 | 0.82 |
| 34 | NCKAP1 | NCK-associated protein 1 | 123812 | 4 | 4 | 4 | 0 | 1 | 0 | 1 | 0 | 2 | 0 | 0.00071 | 0.48 | 0.24 | 0.71 | 0.24 | 0.0017 | 0.87 |
| 35 | ARID1A | AT rich interactive domain 1A (SWI-like) | 208460 | 5 | 4 | 5 | 0 | 1 | 0 | 1 | 0 | 2 | 1 | 0.00077 | 0.3 | 0.6 | 0.13 | 0.26 | 0.0019 | 0.99 |
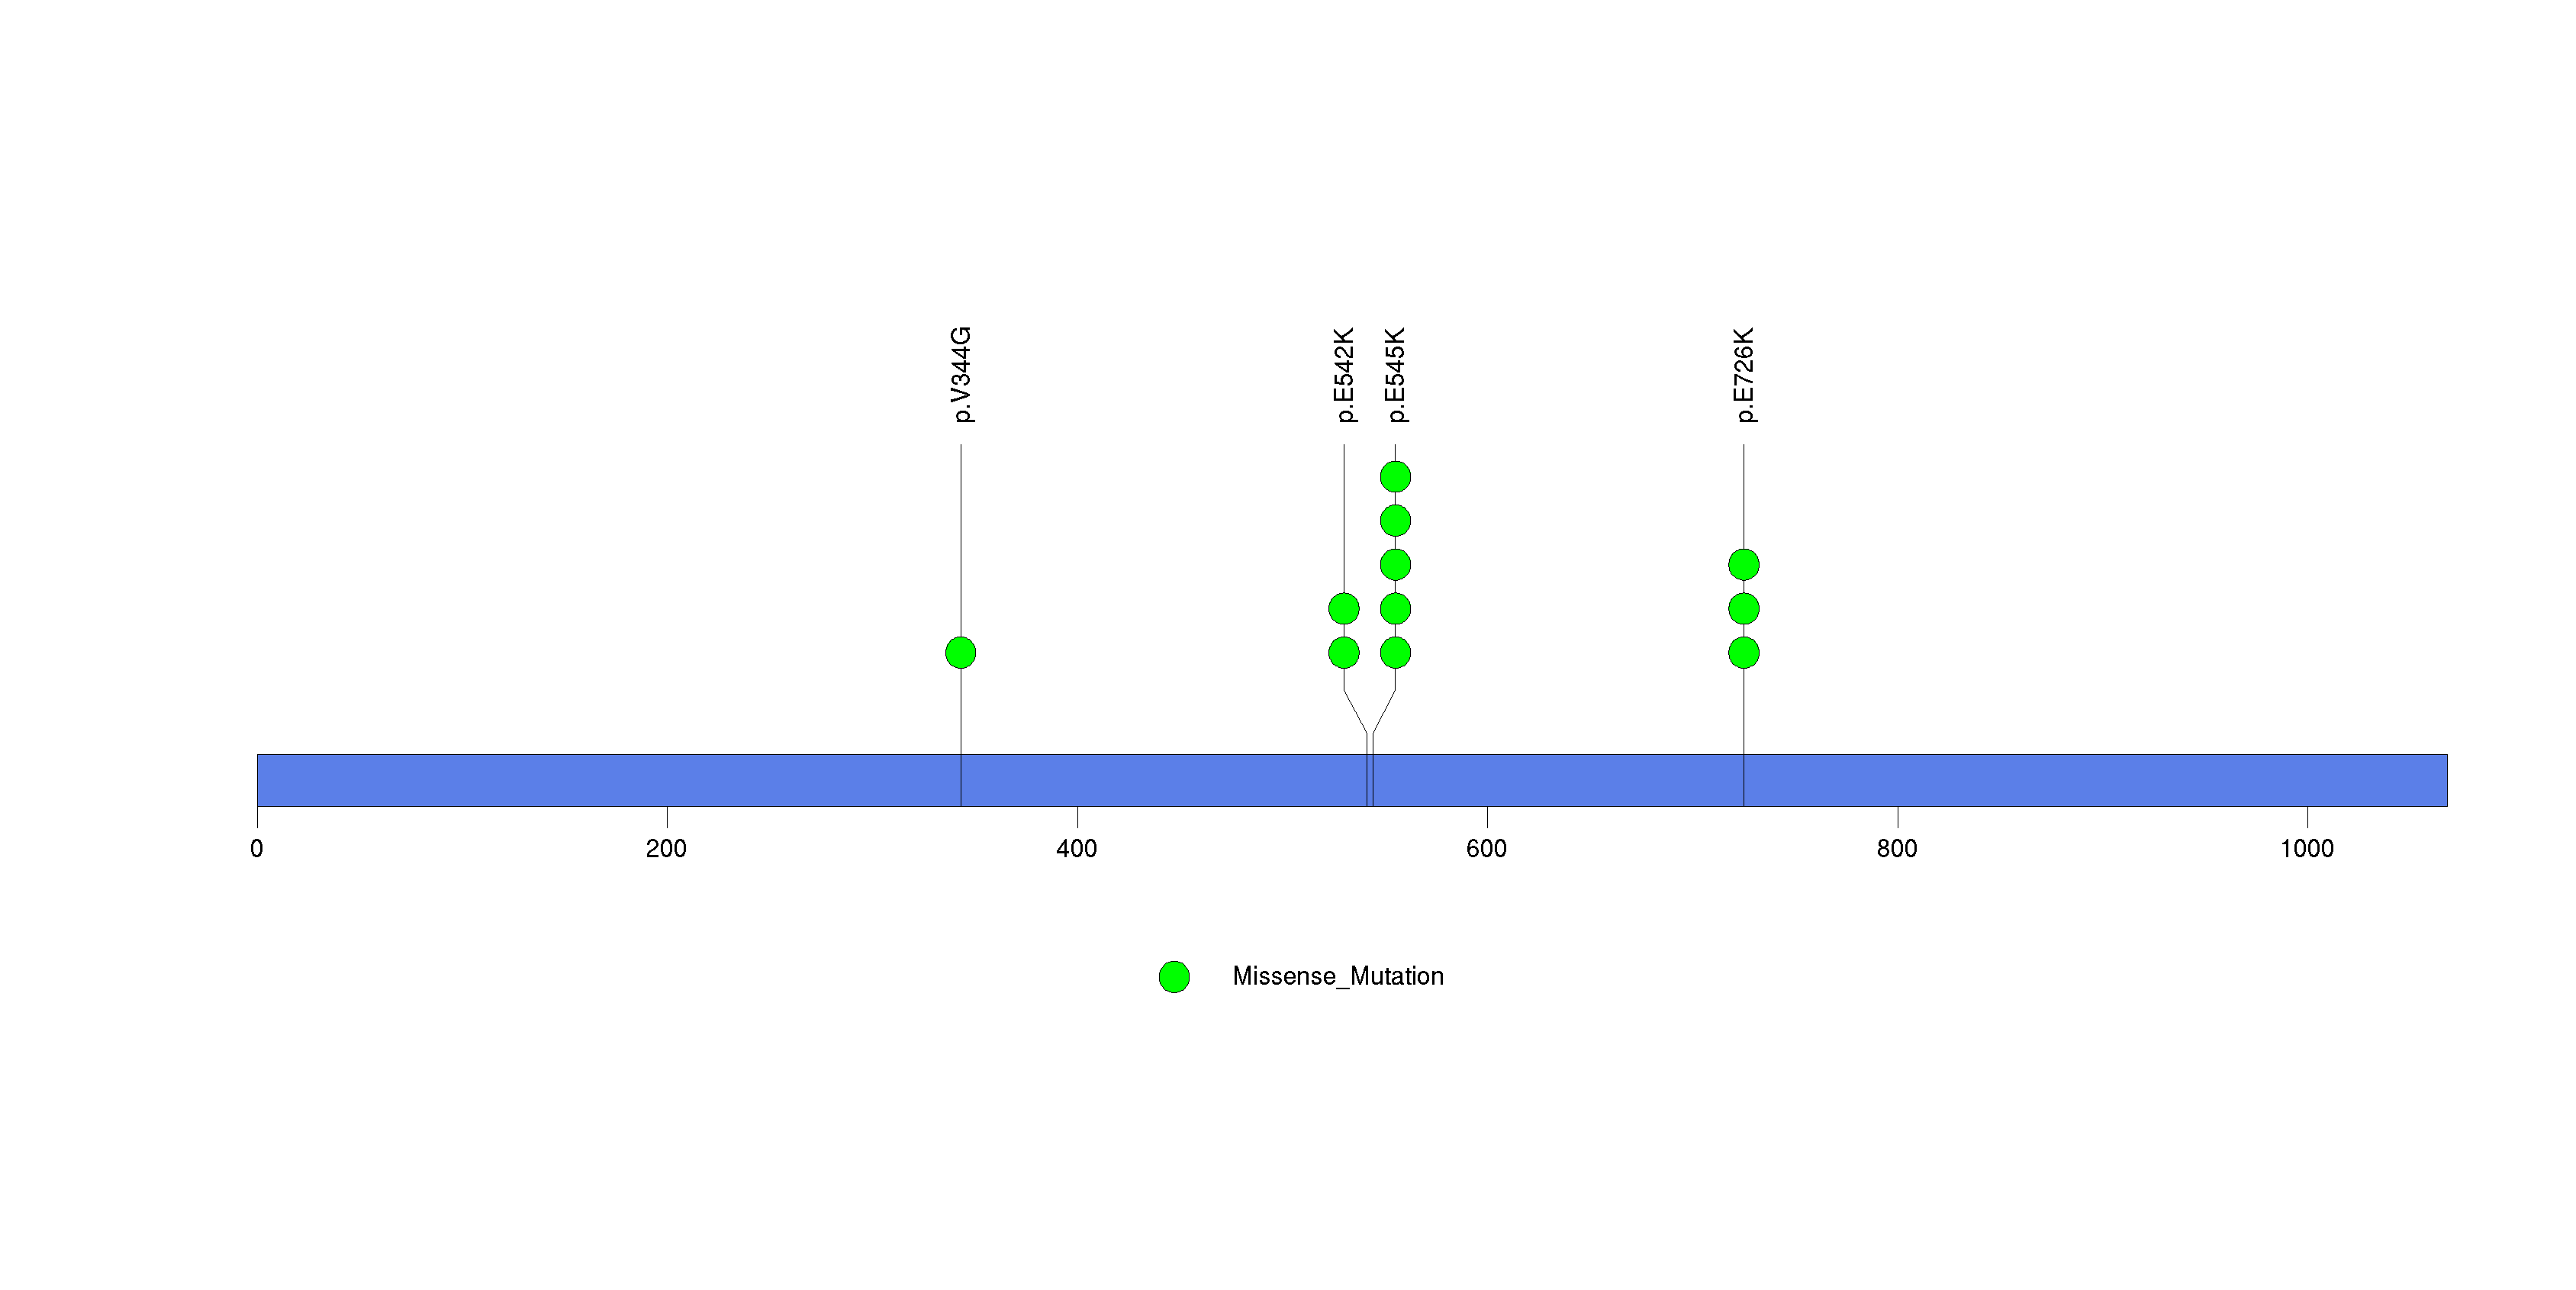
Figure S1. This figure depicts the distribution of mutations and mutation types across the PIK3CA significant gene.
In this analysis, COSMIC is used as a filter to increase power by restricting the territory of each gene. Cosmic version: v48.
Table 4. Get Full Table Significantly mutated genes (COSMIC territory only). To access the database please go to: COSMIC. Number of significant genes found: 1. Number of genes displayed: 10
| rank | gene | description | n | cos | n_cos | N_cos | cos_ev | p | q |
|---|---|---|---|---|---|---|---|---|---|
| 1 | PIK3CA | phosphoinositide-3-kinase, catalytic, alpha polypeptide | 11 | 184 | 8 | 6624 | 3939 | 1.9e-13 | 8.7e-10 |
| 2 | ATL2 | 1 | 1 | 1 | 36 | 1 | 0.00018 | 0.14 | |
| 3 | KIAA1024 | KIAA1024 | 2 | 1 | 1 | 36 | 1 | 0.00018 | 0.14 |
| 4 | LRRC8E | leucine rich repeat containing 8 family, member E | 1 | 1 | 1 | 36 | 1 | 0.00018 | 0.14 |
| 5 | MAPK11 | mitogen-activated protein kinase 11 | 1 | 1 | 1 | 36 | 1 | 0.00018 | 0.14 |
| 6 | SUV39H2 | suppressor of variegation 3-9 homolog 2 (Drosophila) | 1 | 1 | 1 | 36 | 2 | 0.00018 | 0.14 |
| 7 | PTEN | phosphatase and tensin homolog (mutated in multiple advanced cancers 1) | 3 | 728 | 3 | 26208 | 23 | 0.00036 | 0.19 |
| 8 | CHEK2 | CHK2 checkpoint homolog (S. pombe) | 1 | 2 | 1 | 72 | 1 | 0.00037 | 0.19 |
| 9 | ALS2 | amyotrophic lateral sclerosis 2 (juvenile) | 2 | 3 | 1 | 108 | 1 | 0.00055 | 0.19 |
| 10 | EPHA10 | EPH receptor A10 | 1 | 3 | 1 | 108 | 1 | 0.00055 | 0.19 |
Note:
n - number of (nonsilent) mutations in this gene across the individual set.
cos = number of unique mutated sites in this gene in COSMIC
n_cos = overlap between n and cos.
N_cos = number of individuals times cos.
cos_ev = total evidence: number of reports in COSMIC for mutations seen in this gene.
p = p-value for seeing the observed amount of overlap in this gene)
q = q-value, False Discovery Rate (Benjamini-Hochberg procedure)
There were no clustered mutations discovered.
Table 5. Get Full Table A Ranked List of Significantly Mutated Genesets. (Source: MSigDB GSEA Cannonical Pathway Set).Number of significant genesets found: 7. Number of genesets displayed: 10
| rank | geneset | description | genes | N_genes | mut_tally | N | n | npat | nsite | nsil | n1 | n2 | n3 | n4 | n5 | n6 | p_ns_s | p | q |
|---|---|---|---|---|---|---|---|---|---|---|---|---|---|---|---|---|---|---|---|
| 1 | PAR1PATHWAY | Activated extracellular thrombin cleaves and activates the G-protein coupled receptors PAR1 and PAR4, which activate platelets. | ADCY1, ARHA, ARHGEF1, F2, F2R, F2RL3, GNA12, GNA13, GNAI1, GNAQ, GNB1, GNGT1, MAP3K7, PIK3CA, PIK3R1, PLCB1, PPP1R12B, PRKCA, PRKCB1, PTK2B, ROCK1 | 19 | ADCY1(1), ARHGEF1(1), F2R(1), F2RL3(2), GNA13(1), PIK3CA(11), PIK3R1(1), PPP1R12B(1), PRKCA(1), ROCK1(3) | 1369418 | 23 | 13 | 16 | 1 | 16 | 0 | 4 | 2 | 0 | 1 | 0.012 | 0.00017 | 0.043 |
| 2 | GCRPATHWAY | Corticosteroids activate the glucocorticoid receptor (GR), which inhibits NF-kB and activates Annexin-1, thus inhibiting the inflammatory response. | ADRB2, AKT1, ANXA1, CALM1, CALM2, CALM3, CRN, GNAS, GNB1, GNGT1, HSPCA, NFKB1, NOS3, NPPA, NR3C1, PIK3CA, PIK3R1, RELA, SYT1 | 17 | CALM1(1), CALM3(1), NPPA(1), PIK3CA(11), PIK3R1(1), SYT1(1) | 943298 | 16 | 11 | 9 | 0 | 12 | 1 | 1 | 2 | 0 | 0 | 0.019 | 0.00021 | 0.043 |
| 3 | ACHPATHWAY | Nicotinic acetylcholine receptors are ligand-gated ion channels that primarily mediate neuromuscular signaling and may inhibit neuronal apoptosis via the AKT pathway. | AKT1, BAD, CHRNB1, CHRNG, FOXO3A, MUSK, PIK3CA, PIK3R1, PTK2, PTK2B, RAPSN, SRC, TERT, TNFSF6, YWHAH | 13 | CHRNG(1), MUSK(1), PIK3CA(11), PIK3R1(1), PTK2(1) | 864474 | 15 | 11 | 8 | 1 | 11 | 0 | 1 | 2 | 1 | 0 | 0.051 | 0.00021 | 0.043 |
| 4 | PTENPATHWAY | PTEN suppresses AKT-induced cell proliferation and antagonizes the action of PI3K. | AKT1, BCAR1, CDKN1B, FOXO3A, GRB2, ILK, ITGB1, MAPK1, MAPK3, PDK2, PDPK1, PIK3CA, PIK3R1, PTEN, PTK2, SHC1, SOS1, TNFSF6 | 16 | MAPK1(3), PIK3CA(11), PIK3R1(1), PTEN(3), PTK2(1), SOS1(1) | 1023962 | 20 | 11 | 11 | 0 | 15 | 0 | 0 | 2 | 3 | 0 | 0.0084 | 0.00036 | 0.056 |
| 5 | CTLA4PATHWAY | T cell activation requires interaction with an antigen-MHC-I complex on an antigen-presenting cell (APC), as well as CD28 interaction with the APC's CD80 or 86. | CD28, CD3D, CD3E, CD3G, CD3Z, CD80, CD86, CTLA4, GRB2, HLA-DRA, HLA-DRB1, ICOS, ICOSL, IL2, ITK, LCK, PIK3CA, PIK3R1, PTPN11, TRA@, TRB@ | 17 | CD86(1), ITK(1), PIK3CA(11), PIK3R1(1) | 686462 | 14 | 9 | 7 | 0 | 12 | 0 | 0 | 2 | 0 | 0 | 0.025 | 0.00093 | 0.097 |
| 6 | ERK5PATHWAY | Signaling between a tissue and its innervating axon stimulates retrograde transport via Trk receptors, which activate Erk5, which induces transcription of anti-apoptotic factors. | AKT1, CREB1, GRB2, HRAS, MAPK1, MAPK3, MAPK7, MEF2A, MEF2B, MEF2C, MEF2D, NTRK1, PIK3CA, PIK3R1, PLCG1, RPS6KA1, SHC1 | 17 | MAPK1(3), MAPK7(1), MEF2C(1), PIK3CA(11), PIK3R1(1), RPS6KA1(1) | 1008219 | 18 | 10 | 9 | 1 | 14 | 0 | 1 | 3 | 0 | 0 | 0.031 | 0.00097 | 0.097 |
| 7 | PLCPATHWAY | Phospholipase C hydrolyzes the membrane lipid PIP2 to DAG, which activates protein kinase C, and IP3, which causes calcium influx. | AKT1, PIK3CA, PIK3R1, PLCB1, PLCG1, PRKCA, PRKCB1, VAV1 | 7 | PIK3CA(11), PIK3R1(1), PRKCA(1) | 686172 | 13 | 9 | 6 | 1 | 11 | 0 | 0 | 2 | 0 | 0 | 0.13 | 0.0011 | 0.097 |
| 8 | ARENRF2PATHWAY | Nrf1 and nrf2 are transcription factors that bind to antioxidant response elements (AREs), promoters of genes involved in oxidative damage control. | CREB1, FOS, FXYD2, JUN, KEAP1, MAFF, MAFG, MAFK, MAPK1, MAPK14, MAPK8, NFE2L2, PRKCA, PRKCB1 | 12 | MAPK1(3), NFE2L2(6), PRKCA(1) | 460362 | 10 | 8 | 7 | 0 | 8 | 0 | 0 | 1 | 1 | 0 | 0.07 | 0.0028 | 0.2 |
| 9 | GSK3PATHWAY | Bacterial lipopolysaccharide activates AKT to promote the survival and activation of macrophages and inhibits Gsk3-beta to promote beta-catenin accumulation in the nucleus. | AKT1, APC, AXIN1, CCND1, CD14, CTNNB1, DVL1, FZD1, GJA1, GNAI1, GSK3B, IRAK1, LBP, LEF1, LY96, MYD88, NFKB1, PDPK1, PIK3CA, PIK3R1, PPP2CA, PRKR, RELA, TIRAP, TLR4, TOLLIP, WNT1 | 26 | APC(3), CTNNB1(1), FZD1(1), GJA1(1), IRAK1(1), LY96(1), PIK3CA(11), PIK3R1(1) | 1634345 | 20 | 13 | 13 | 1 | 16 | 1 | 0 | 2 | 1 | 0 | 0.039 | 0.0029 | 0.2 |
| 10 | TRKAPATHWAY | Nerve growth factor (NGF) promotes neuronal survival and proliferation by binding its receptor TrkA, which activates PI3K/AKT, Ras, and the MAP kinase pathway. | AKT1, DPM2, GRB2, HRAS, KLK2, NGFB, NTRK1, PIK3CA, PIK3R1, PLCG1, PRKCA, PRKCB1, SHC1, SOS1 | 12 | PIK3CA(11), PIK3R1(1), PRKCA(1), SOS1(1) | 833454 | 14 | 9 | 7 | 1 | 12 | 0 | 0 | 2 | 0 | 0 | 0.099 | 0.0032 | 0.2 |
Table 6. Get Full Table A Ranked List of Significantly Mutated Genesets (Excluding Significantly Mutated Genes). Number of significant genesets found: 0. Number of genesets displayed: 10
| rank | geneset | description | genes | N_genes | mut_tally | N | n | npat | nsite | nsil | n1 | n2 | n3 | n4 | n5 | n6 | p_ns_s | p | q |
|---|---|---|---|---|---|---|---|---|---|---|---|---|---|---|---|---|---|---|---|
| 1 | FIBRINOLYSISPATHWAY | Thrombin cleavage of fibrinogen results in rapid formation of fibrin threads that form a mesh to capture platelets and other blood cells into a clot. | CPB2, F13A1, F2, F2R, FGA, FGB, FGG, PLAT, PLAU, PLG, SERPINB2, SERPINE1 | 12 | CPB2(2), F2R(1), FGA(1), PLAT(1), PLAU(1), PLG(1) | 716620 | 7 | 7 | 7 | 1 | 2 | 1 | 2 | 2 | 0 | 0 | 0.44 | 0.0038 | 1 |
| 2 | ST_TYPE_I_INTERFERON_PATHWAY | Type I interferon is an antiviral cytokine that induces a JAK-STAT type pathway leading to ISGF3 activation and a cellular antiviral response. | IFNAR1, IFNB1, ISGF3G, JAK1, PTPRU, REG1A, STAT1, STAT2, TYK2 | 8 | IFNAR1(2), REG1A(1), STAT1(2), TYK2(3) | 668217 | 8 | 8 | 8 | 1 | 6 | 0 | 2 | 0 | 0 | 0 | 0.22 | 0.0056 | 1 |
| 3 | IFNGPATHWAY | IFN gamma signaling pathway | IFNG, IFNGR1, IFNGR2, JAK1, JAK2, STAT1 | 6 | IFNGR1(2), IFNGR2(1), JAK2(1), STAT1(2) | 441063 | 6 | 6 | 6 | 1 | 3 | 0 | 1 | 0 | 2 | 0 | 0.58 | 0.0077 | 1 |
| 4 | IFNAPATHWAY | Interferon alpha, active in the immune response, binds to the IFN receptor and activates Jak1 and Tyk2, which phosphorylate Stat1 and Stat2. | IFNA1, IFNAR1, IFNAR2, IFNB1, ISGF3G, JAK1, STAT1, STAT2, TYK2 | 8 | IFNA1(1), IFNAR1(2), IFNAR2(1), STAT1(2), TYK2(3) | 580812 | 9 | 8 | 9 | 1 | 8 | 0 | 1 | 0 | 0 | 0 | 0.19 | 0.0087 | 1 |
| 5 | PEPIPATHWAY | Proepithelin (PEPI) induces epithelial cells to secrete IL-8, which promotes elastase secretion by neutrophils. | ELA1, ELA2, ELA2A, ELA2B, ELA3B, GRN, IL8, SLPI | 3 | GRN(1), IL8(1) | 91703 | 2 | 2 | 2 | 0 | 0 | 1 | 1 | 0 | 0 | 0 | 0.63 | 0.015 | 1 |
| 6 | MSPPATHWAY | Macrophage stimulating protein is synthesized as pro-MSP by the liver and, on proteolysis, binds to monocyte receptor kinase RON to induce macrophage development. | CCL2, CSF1, IL1B, MST1, MST1R, TNF | 6 | MST1(1), MST1R(3) | 347109 | 4 | 4 | 4 | 0 | 2 | 0 | 2 | 0 | 0 | 0 | 0.27 | 0.018 | 1 |
| 7 | NOTCHPATHWAY | Proteolysis and Signaling Pathway of Notch | ADAM17, DLL1, FURIN, NOTCH1, PSEN1, RBPSUH | 5 | ADAM17(1), DLL1(1), NOTCH1(7), PSEN1(2) | 483236 | 11 | 8 | 11 | 3 | 5 | 1 | 2 | 1 | 2 | 0 | 0.64 | 0.02 | 1 |
| 8 | PAR1PATHWAY | Activated extracellular thrombin cleaves and activates the G-protein coupled receptors PAR1 and PAR4, which activate platelets. | ADCY1, ARHA, ARHGEF1, F2, F2R, F2RL3, GNA12, GNA13, GNAI1, GNAQ, GNB1, GNGT1, MAP3K7, PIK3CA, PIK3R1, PLCB1, PPP1R12B, PRKCA, PRKCB1, PTK2B, ROCK1 | 18 | ADCY1(1), ARHGEF1(1), F2R(1), F2RL3(2), GNA13(1), PIK3R1(1), PPP1R12B(1), PRKCA(1), ROCK1(3) | 1251345 | 12 | 9 | 12 | 1 | 6 | 0 | 4 | 1 | 0 | 1 | 0.13 | 0.021 | 1 |
| 9 | TGFBPATHWAY | The TGF-beta receptor responds to ligand binding by activating the SMAD family of transcriptional regulations, commonly blocking cell growth. | APC, CDH1, CREBBP, EP300, MADH2, MADH3, MADH4, MADH7, MADHIP, MAP2K1, MAP3K7, MAP3K7IP1, MAPK3, SKIL, TGFB1, TGFB2, TGFB3, TGFBR1, TGFBR2 | 13 | APC(3), CREBBP(4), EP300(2), SKIL(1), TGFB3(2) | 1372116 | 12 | 10 | 12 | 1 | 8 | 0 | 2 | 0 | 2 | 0 | 0.22 | 0.021 | 1 |
| 10 | HSA00130_UBIQUINONE_BIOSYNTHESIS | Genes involved in ubiquinone biosynthesis | COQ2, COQ3, COQ5, COQ6, COQ7, ND1, ND2, ND3, ND4, ND4L, ND5, ND6, NDUFA12, NDUFA13, NDUFB11 | 8 | COQ3(1), COQ5(1), COQ6(1) | 215602 | 3 | 3 | 3 | 0 | 2 | 0 | 1 | 0 | 0 | 0 | 0.46 | 0.022 | 1 |
In brief, we tabulate the number of mutations and the number of covered bases for each gene. The counts are broken down by mutation context category: four context categories that are discovered by MutSig, and one for indel and 'null' mutations, which include indels, nonsense mutations, splice-site mutations, and non-stop (read-through) mutations. For each gene, we calculate the probability of seeing the observed constellation of mutations, i.e. the product P1 x P2 x ... x Pm, or a more extreme one, given the background mutation rates calculated across the dataset. [1]
This is an experimental feature. The full results of the analysis summarized in this report can be downloaded from the TCGA Data Coordination Center.