This pipeline uses various statistical tests to identify mRNAs whose expression levels correlated to selected clinical features.
Testing the association between 17814 genes and 9 clinical features across 155 samples, statistically thresholded by Q value < 0.05, 5 clinical features related to at least one genes.
-
1 gene correlated to 'AGE'.
-
ANAPC1
-
21 genes correlated to 'GENDER'.
-
DDX3Y , JARID1D , EIF1AY , RPS4Y1 , CYORF15A , ...
-
153 genes correlated to 'HISTOLOGICAL.TYPE'.
-
C20ORF24 , DYNLRB1 , AGR2 , C20ORF4 , C10ORF65 , ...
-
1 gene correlated to 'PATHOLOGICSPREAD(M)'.
-
KCNC2
-
2 genes correlated to 'NEOADJUVANT.THERAPY'.
-
FAM100A , MYO10
-
No genes correlated to 'Time to Death', 'PATHOLOGY.T', 'PATHOLOGY.N', and 'TUMOR.STAGE'.
Complete statistical result table is provided in Supplement Table 1
Table 1. Get Full Table This table shows the clinical features, statistical methods used, and the number of genes that are significantly associated with each clinical feature at Q value < 0.05.
| Clinical feature | Statistical test | Significant genes | Associated with | Associated with | ||
|---|---|---|---|---|---|---|
| Time to Death | Cox regression test | N=0 | ||||
| AGE | Spearman correlation test | N=1 | older | N=0 | younger | N=1 |
| GENDER | t test | N=21 | male | N=13 | female | N=8 |
| HISTOLOGICAL TYPE | t test | N=153 | colon mucinous adenocarcinoma | N=48 | colon adenocarcinoma | N=105 |
| PATHOLOGY T | Spearman correlation test | N=0 | ||||
| PATHOLOGY N | Spearman correlation test | N=0 | ||||
| PATHOLOGICSPREAD(M) | ANOVA test | N=1 | ||||
| TUMOR STAGE | Spearman correlation test | N=0 | ||||
| NEOADJUVANT THERAPY | t test | N=2 | yes | N=2 | no | N=0 |
Table S1. Basic characteristics of clinical feature: 'Time to Death'
| Time to Death | Duration (Months) | 0.9-52 (median=5) |
| censored | N = 64 | |
| death | N = 11 | |
| Significant markers | N = 0 |
Table S2. Basic characteristics of clinical feature: 'AGE'
| AGE | Mean (SD) | 70.55 (12) |
| Significant markers | N = 1 | |
| pos. correlated | 0 | |
| neg. correlated | 1 |
Table S3. Get Full Table List of one gene significantly correlated to 'AGE' by Spearman correlation test
| SpearmanCorr | corrP | Q | |
|---|---|---|---|
| ANAPC1 | -0.385 | 7.58e-07 | 0.0135 |
Figure S1. Get High-res Image As an example, this figure shows the association of ANAPC1 to 'AGE'. P value = 7.58e-07 with Spearman correlation analysis. The straight line presents the best linear regression.
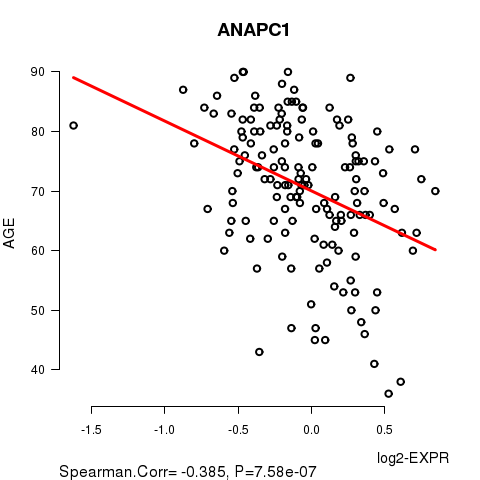
Table S4. Basic characteristics of clinical feature: 'GENDER'
| GENDER | Labels | N |
| FEMALE | 76 | |
| MALE | 79 | |
| Significant markers | N = 21 | |
| Higher in MALE | 13 | |
| Higher in FEMALE | 8 |
Table S5. Get Full Table List of top 10 genes differentially expressed by 'GENDER'
| T(pos if higher in 'MALE') | ttestP | Q | AUC | |
|---|---|---|---|---|
| DDX3Y | 22.53 | 2.909e-50 | 5.18e-46 | 0.9742 |
| JARID1D | 20.65 | 4.391e-46 | 7.82e-42 | 0.9787 |
| EIF1AY | 20.41 | 2.042e-45 | 3.64e-41 | 0.9654 |
| RPS4Y1 | 19.25 | 1.481e-42 | 2.64e-38 | 0.9509 |
| CYORF15A | 18.57 | 1.055e-40 | 1.88e-36 | 0.9557 |
| RPS4Y2 | 18.38 | 3.613e-40 | 6.43e-36 | 0.9625 |
| UTY | 17.81 | 3.766e-38 | 6.71e-34 | 0.957 |
| ZFY | 15.52 | 3.264e-33 | 5.81e-29 | 0.947 |
| CYORF15B | 15.52 | 9.991e-33 | 1.78e-28 | 0.9452 |
| USP9Y | 10.82 | 1.525e-20 | 2.72e-16 | 0.8946 |
Figure S2. Get High-res Image As an example, this figure shows the association of DDX3Y to 'GENDER'. P value = 2.91e-50 with T-test analysis.
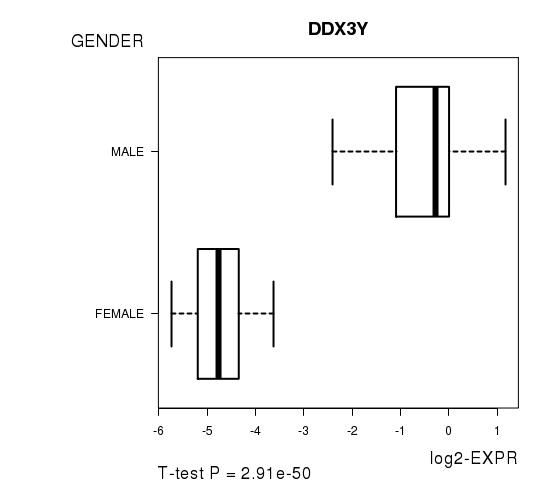
Table S6. Basic characteristics of clinical feature: 'HISTOLOGICAL.TYPE'
| HISTOLOGICAL.TYPE | Labels | N |
| COLON ADENOCARCINOMA | 128 | |
| COLON MUCINOUS ADENOCARCINOMA | 24 | |
| Significant markers | N = 153 | |
| Higher in COLON MUCINOUS ADENOCARCINOMA | 48 | |
| Higher in COLON ADENOCARCINOMA | 105 |
Table S7. Get Full Table List of top 10 genes differentially expressed by 'HISTOLOGICAL.TYPE'
| T(pos if higher in 'COLON MUCINOUS ADENOCARCINOMA') | ttestP | Q | AUC | |
|---|---|---|---|---|
| C20ORF24 | -8.52 | 1.126e-11 | 2.01e-07 | 0.8545 |
| DYNLRB1 | -8.19 | 3.266e-11 | 5.82e-07 | 0.8376 |
| AGR2 | 8.12 | 1.298e-10 | 2.31e-06 | 0.8721 |
| C20ORF4 | -7.68 | 4.344e-10 | 7.74e-06 | 0.8398 |
| C10ORF65 | -7.31 | 9.01e-10 | 1.6e-05 | 0.8115 |
| PLA2G12B | -7.55 | 1.006e-09 | 1.79e-05 | 0.8301 |
| RDHE2 | 7.41 | 1.669e-09 | 2.97e-05 | 0.8174 |
| ASXL1 | -7.45 | 1.882e-09 | 3.35e-05 | 0.847 |
| SLC5A6 | -7.37 | 2.279e-09 | 4.06e-05 | 0.8356 |
| EIF6 | -7.39 | 2.672e-09 | 4.76e-05 | 0.8363 |
Figure S3. Get High-res Image As an example, this figure shows the association of C20ORF24 to 'HISTOLOGICAL.TYPE'. P value = 1.13e-11 with T-test analysis.
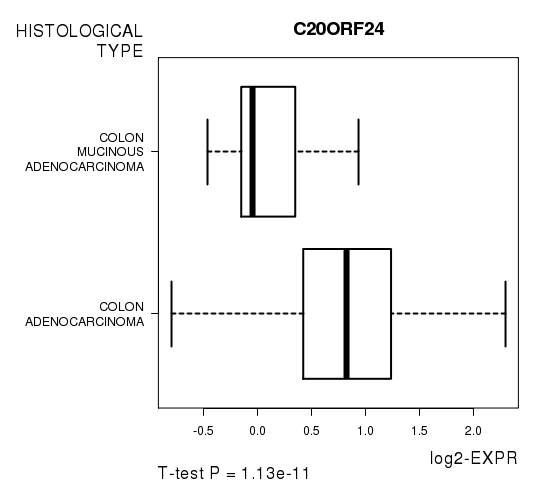
Table S8. Basic characteristics of clinical feature: 'PATHOLOGY.T'
| PATHOLOGY.T | Mean (SD) | 2.83 (0.6) |
| N | ||
| T1 | 4 | |
| T2 | 31 | |
| T3 | 105 | |
| T4 | 13 | |
| Significant markers | N = 0 |
Table S9. Basic characteristics of clinical feature: 'PATHOLOGY.N'
| PATHOLOGY.N | Mean (SD) | 0.59 (0.81) |
| N | ||
| N0 | 95 | |
| N1 | 28 | |
| N2 | 32 | |
| Significant markers | N = 0 |
Table S10. Basic characteristics of clinical feature: 'PATHOLOGICSPREAD(M)'
| PATHOLOGICSPREAD(M) | Labels | N |
| M0 | 129 | |
| M1 | 22 | |
| M1A | 1 | |
| Significant markers | N = 1 |
Table S11. Get Full Table List of one gene differentially expressed by 'PATHOLOGICSPREAD(M)'
| ANOVA_P | Q | |
|---|---|---|
| KCNC2 | 2.165e-14 | 3.86e-10 |
Figure S4. Get High-res Image As an example, this figure shows the association of KCNC2 to 'PATHOLOGICSPREAD(M)'. P value = 2.16e-14 with ANOVA analysis.
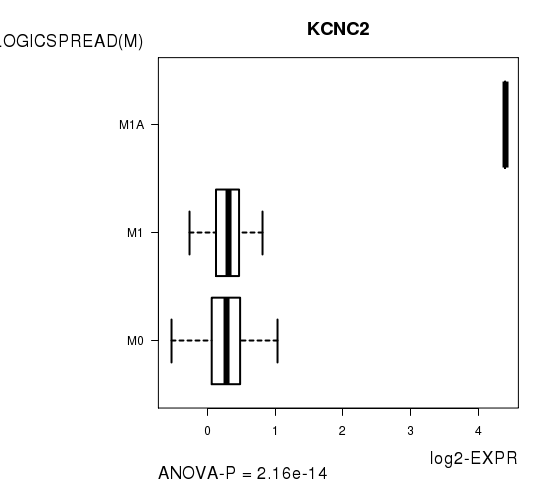
Table S12. Basic characteristics of clinical feature: 'TUMOR.STAGE'
| TUMOR.STAGE | Mean (SD) | 2.36 (0.95) |
| N | ||
| Stage 1 | 28 | |
| Stage 2 | 63 | |
| Stage 3 | 39 | |
| Stage 4 | 22 | |
| Significant markers | N = 0 |
Table S13. Basic characteristics of clinical feature: 'NEOADJUVANT.THERAPY'
| NEOADJUVANT.THERAPY | Labels | N |
| NO | 7 | |
| YES | 148 | |
| Significant markers | N = 2 | |
| Higher in YES | 2 | |
| Higher in NO | 0 |
Table S14. Get Full Table List of 2 genes differentially expressed by 'NEOADJUVANT.THERAPY'
| T(pos if higher in 'YES') | ttestP | Q | AUC | |
|---|---|---|---|---|
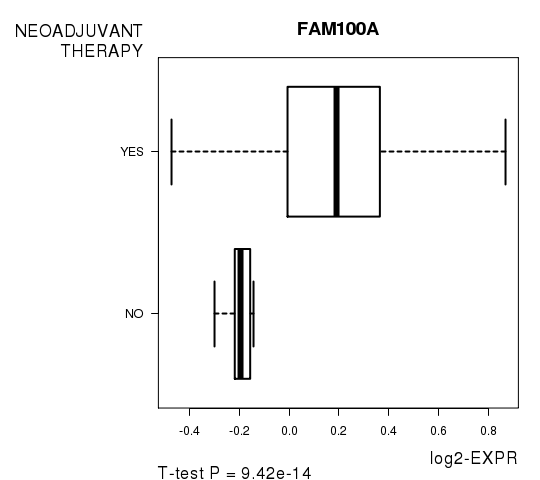
| FAM100A | 11.08 | 9.418e-14 | 1.68e-09 | 0.8919 |
| MYO10 | 7.88 | 1.691e-06 | 0.0301 | 0.8359 |
Figure S5. Get High-res Image As an example, this figure shows the association of FAM100A to 'NEOADJUVANT.THERAPY'. P value = 9.42e-14 with T-test analysis.
-
Expresson data file = COAD.medianexp.txt
-
Clinical data file = COAD.clin.merged.picked.txt
-
Number of patients = 155
-
Number of genes = 17814
-
Number of clinical features = 9
For survival clinical features, Wald's test in univariate Cox regression analysis with proportional hazards model (Andersen and Gill 1982) was used to estimate the P values using the 'coxph' function in R. Kaplan-Meier survival curves were plot using the four quartile subgroups of patients based on expression levels
For continuous numerical clinical features, Spearman's rank correlation coefficients (Spearman 1904) and two-tailed P values were estimated using 'cor.test' function in R
For two-class clinical features, two-tailed Student's t test with unequal variance (Lehmann and Romano 2005) was applied to compare the log2-expression levels between the two clinical classes using 't.test' function in R
For multi-class clinical features (ordinal or nominal), one-way analysis of variance (Howell 2002) was applied to compare the log2-expression levels between different clinical classes using 'anova' function in R
For multiple hypothesis correction, Q value is the False Discovery Rate (FDR) analogue of the P value (Benjamini and Hochberg 1995), defined as the minimum FDR at which the test may be called significant. We used the 'Benjamini and Hochberg' method of 'p.adjust' function in R to convert P values into Q values.
This is an experimental feature. The full results of the analysis summarized in this report can be downloaded from the TCGA Data Coordination Center.