This pipeline uses various statistical tests to identify miRs whose expression levels correlated to selected clinical features.
Testing the association between 415 genes and 9 clinical features across 378 samples, statistically thresholded by Q value < 0.05, 5 clinical features related to at least one genes.
-
8 genes correlated to 'AGE'.
-
HSA-MIR-153-2 , HSA-MIR-432 , HSA-MIR-26A-1 , HSA-MIR-141 , HSA-MIR-34A , ...
-
10 genes correlated to 'HISTOLOGICAL.TYPE'.
-
HSA-MIR-31 , HSA-MIR-92A-1 , HSA-MIR-592 , HSA-MIR-181D , HSA-MIR-92A-2 , ...
-
16 genes correlated to 'PATHOLOGICSPREAD(M)'.
-
HSA-MIR-142 , HSA-MIR-1180 , HSA-MIR-628 , HSA-MIR-106A , HSA-MIR-1975 , ...
-
2 genes correlated to 'TUMOR.STAGE'.
-
HSA-MIR-625 , HSA-MIR-146A
-
23 genes correlated to 'NEOADJUVANT.THERAPY'.
-
HSA-MIR-103-2 , HSA-MIR-1826 , HSA-MIR-331 , HSA-MIR-106A , HSA-MIR-26A-1 , ...
-
No genes correlated to 'Time to Death', 'GENDER', 'PATHOLOGY.T', and 'PATHOLOGY.N'.
Complete statistical result table is provided in Supplement Table 1
Table 1. Get Full Table This table shows the clinical features, statistical methods used, and the number of genes that are significantly associated with each clinical feature at Q value < 0.05.
| Clinical feature | Statistical test | Significant genes | Associated with | Associated with | ||
|---|---|---|---|---|---|---|
| Time to Death | Cox regression test | N=0 | ||||
| AGE | Spearman correlation test | N=8 | older | N=6 | younger | N=2 |
| GENDER | t test | N=0 | ||||
| HISTOLOGICAL TYPE | t test | N=10 | colon mucinous adenocarcinoma | N=2 | colon adenocarcinoma | N=8 |
| PATHOLOGY T | Spearman correlation test | N=0 | ||||
| PATHOLOGY N | Spearman correlation test | N=0 | ||||
| PATHOLOGICSPREAD(M) | ANOVA test | N=16 | ||||
| TUMOR STAGE | Spearman correlation test | N=2 | higher stage | N=0 | lower stage | N=2 |
| NEOADJUVANT THERAPY | t test | N=23 | yes | N=21 | no | N=2 |
Table S1. Basic characteristics of clinical feature: 'Time to Death'
| Time to Death | Duration (Months) | 0.1-135.5 (median=8.1) |
| censored | N = 231 | |
| death | N = 49 | |
| Significant markers | N = 0 |
Table S2. Basic characteristics of clinical feature: 'AGE'
| AGE | Mean (SD) | 67.37 (13) |
| Significant markers | N = 8 | |
| pos. correlated | 6 | |
| neg. correlated | 2 |
Table S3. Get Full Table List of 8 genes significantly correlated to 'AGE' by Spearman correlation test
| SpearmanCorr | corrP | Q | |
|---|---|---|---|
| HSA-MIR-153-2 | 0.2421 | 1.92e-06 | 0.000797 |
| HSA-MIR-432 | -0.2361 | 4.165e-06 | 0.00172 |
| HSA-MIR-26A-1 | 0.2325 | 4.927e-06 | 0.00204 |
| HSA-MIR-141 | 0.2284 | 7.256e-06 | 0.00299 |
| HSA-MIR-34A | 0.2165 | 2.173e-05 | 0.00893 |
| HSA-MIR-616 | 0.214 | 3.168e-05 | 0.013 |
| HSA-MIR-410 | -0.2015 | 8.49e-05 | 0.0347 |
| HSA-MIR-142 | 0.1982 | 0.0001049 | 0.0428 |
Figure S1. Get High-res Image As an example, this figure shows the association of HSA-MIR-153-2 to 'AGE'. P value = 1.92e-06 with Spearman correlation analysis. The straight line presents the best linear regression.
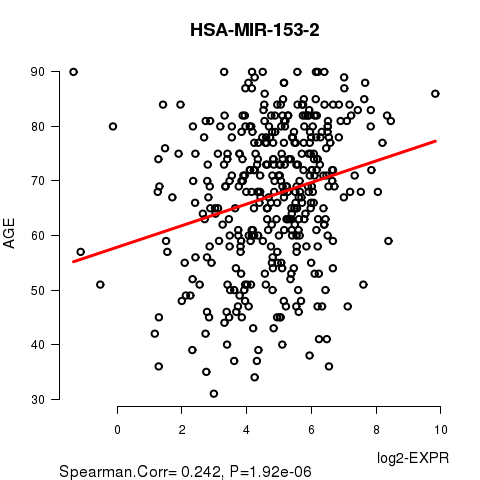
Table S4. Basic characteristics of clinical feature: 'GENDER'
| GENDER | Labels | N |
| FEMALE | 183 | |
| MALE | 195 | |
| Significant markers | N = 0 |
Table S5. Basic characteristics of clinical feature: 'HISTOLOGICAL.TYPE'
| HISTOLOGICAL.TYPE | Labels | N |
| COLON ADENOCARCINOMA | 327 | |
| COLON MUCINOUS ADENOCARCINOMA | 48 | |
| Significant markers | N = 10 | |
| Higher in COLON MUCINOUS ADENOCARCINOMA | 2 | |
| Higher in COLON ADENOCARCINOMA | 8 |
Table S6. Get Full Table List of 10 genes differentially expressed by 'HISTOLOGICAL.TYPE'
| T(pos if higher in 'COLON MUCINOUS ADENOCARCINOMA') | ttestP | Q | AUC | |
|---|---|---|---|---|
| HSA-MIR-31 | 5.71 | 2.887e-07 | 0.00012 | 0.7258 |
| HSA-MIR-92A-1 | -5.5 | 6.953e-07 | 0.000288 | 0.7229 |
| HSA-MIR-592 | -5.41 | 1.082e-06 | 0.000447 | 0.7302 |
| HSA-MIR-181D | -4.8 | 1.056e-05 | 0.00435 | 0.7024 |
| HSA-MIR-92A-2 | -4.45 | 3.781e-05 | 0.0155 | 0.6933 |
| HSA-MIR-574 | 4.41 | 4.081e-05 | 0.0167 | 0.6903 |
| HSA-MIR-196B | -4.34 | 5.329e-05 | 0.0218 | 0.6803 |
| HSA-MIR-181C | -4.3 | 6.576e-05 | 0.0268 | 0.6933 |
| HSA-MIR-1247 | -4.28 | 7.04e-05 | 0.0287 | 0.6908 |
| HSA-MIR-552 | -4.13 | 0.0001193 | 0.0484 | 0.715 |
Figure S2. Get High-res Image As an example, this figure shows the association of HSA-MIR-31 to 'HISTOLOGICAL.TYPE'. P value = 2.89e-07 with T-test analysis.
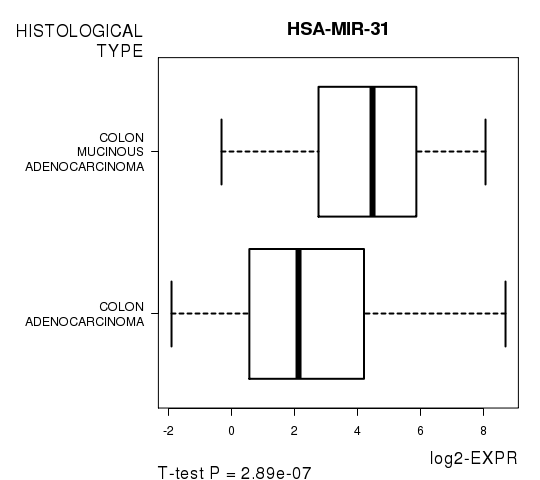
Table S7. Basic characteristics of clinical feature: 'PATHOLOGY.T'
| PATHOLOGY.T | Mean (SD) | 2.87 (0.61) |
| N | ||
| T0 | 1 | |
| T1 | 9 | |
| T2 | 64 | |
| T3 | 264 | |
| T4 | 37 | |
| Significant markers | N = 0 |
Table S8. Basic characteristics of clinical feature: 'PATHOLOGY.N'
| PATHOLOGY.N | Mean (SD) | 0.59 (0.77) |
| N | ||
| N0 | 222 | |
| N1 | 89 | |
| N2 | 66 | |
| Significant markers | N = 0 |
Table S9. Basic characteristics of clinical feature: 'PATHOLOGICSPREAD(M)'
| PATHOLOGICSPREAD(M) | Labels | N |
| M0 | 286 | |
| M1 | 49 | |
| M1A | 7 | |
| M1B | 1 | |
| MX | 28 | |
| Significant markers | N = 16 |
Table S10. Get Full Table List of top 10 genes differentially expressed by 'PATHOLOGICSPREAD(M)'
| ANOVA_P | Q | |
|---|---|---|
| HSA-MIR-142 | 2.172e-06 | 0.000901 |
| HSA-MIR-1180 | 2.749e-06 | 0.00114 |
| HSA-MIR-628 | 1.011e-05 | 0.00418 |
| HSA-MIR-106A | 1.355e-05 | 0.00558 |
| HSA-MIR-1975 | 1.976e-05 | 0.00812 |
| HSA-MIR-140 | 2.054e-05 | 0.00842 |
| HSA-MIR-539 | 2.587e-05 | 0.0106 |
| HSA-MIR-126 | 2.837e-05 | 0.0116 |
| HSA-LET-7F-2 | 4.438e-05 | 0.0181 |
| HSA-MIR-136 | 4.499e-05 | 0.0183 |
Figure S3. Get High-res Image As an example, this figure shows the association of HSA-MIR-142 to 'PATHOLOGICSPREAD(M)'. P value = 2.17e-06 with ANOVA analysis.
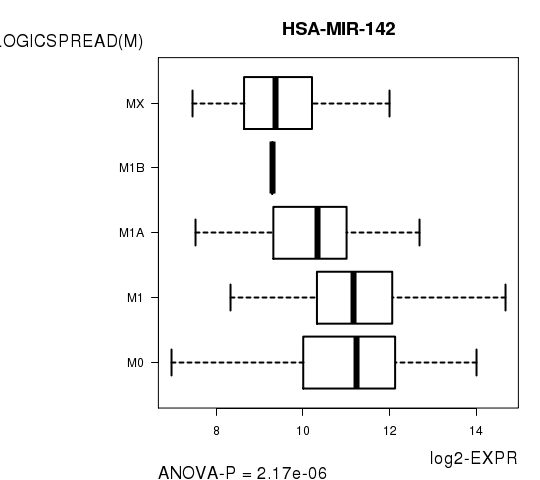
Table S11. Basic characteristics of clinical feature: 'TUMOR.STAGE'
| TUMOR.STAGE | Mean (SD) | 2.42 (0.94) |
| N | ||
| Stage 1 | 62 | |
| Stage 2 | 144 | |
| Stage 3 | 106 | |
| Stage 4 | 55 | |
| Significant markers | N = 2 | |
| pos. correlated | 0 | |
| neg. correlated | 2 |
Table S12. Get Full Table List of 2 genes significantly correlated to 'TUMOR.STAGE' by Spearman correlation test
| SpearmanCorr | corrP | Q | |
|---|---|---|---|
| HSA-MIR-625 | -0.208 | 5.925e-05 | 0.0246 |
| HSA-MIR-146A | -0.2067 | 6.618e-05 | 0.0274 |
Figure S4. Get High-res Image As an example, this figure shows the association of HSA-MIR-625 to 'TUMOR.STAGE'. P value = 5.93e-05 with Spearman correlation analysis.
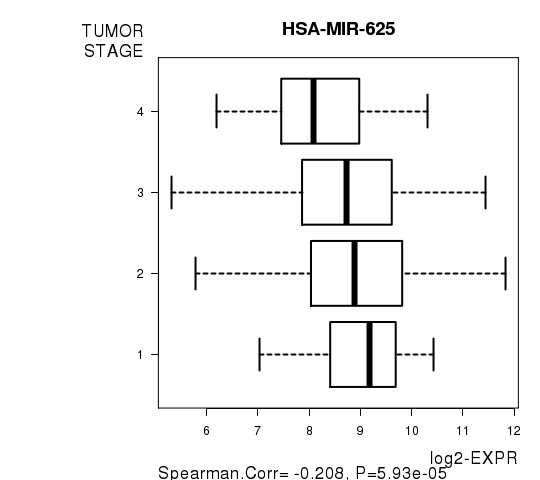
Table S13. Basic characteristics of clinical feature: 'NEOADJUVANT.THERAPY'
| NEOADJUVANT.THERAPY | Labels | N |
| NO | 55 | |
| YES | 323 | |
| Significant markers | N = 23 | |
| Higher in YES | 21 | |
| Higher in NO | 2 |
Table S14. Get Full Table List of top 10 genes differentially expressed by 'NEOADJUVANT.THERAPY'
| T(pos if higher in 'YES') | ttestP | Q | AUC | |
|---|---|---|---|---|
| HSA-MIR-103-2 | 6.62 | 1.966e-09 | 8.16e-07 | 0.7186 |
| HSA-MIR-1826 | 6.19 | 2.183e-08 | 9.04e-06 | 0.7322 |
| HSA-MIR-331 | 5.45 | 4.319e-07 | 0.000178 | 0.6946 |
| HSA-MIR-106A | 5.1 | 1.878e-06 | 0.000774 | 0.6786 |
| HSA-MIR-26A-1 | 4.95 | 3.914e-06 | 0.00161 | 0.6887 |
| HSA-MIR-1259 | 4.93 | 5.092e-06 | 0.00209 | 0.7025 |
| HSA-MIR-455 | 4.89 | 5.256e-06 | 0.00215 | 0.696 |
| HSA-LET-7F-2 | -4.75 | 7.897e-06 | 0.00322 | 0.6514 |
| HSA-MIR-7-1 | 4.69 | 9.867e-06 | 0.00402 | 0.6734 |
| HSA-MIR-141 | 4.63 | 1.393e-05 | 0.00566 | 0.7077 |
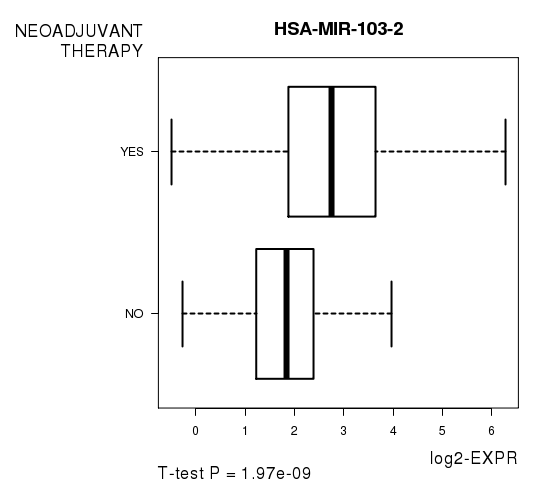
Figure S5. Get High-res Image As an example, this figure shows the association of HSA-MIR-103-2 to 'NEOADJUVANT.THERAPY'. P value = 1.97e-09 with T-test analysis.
-
Expresson data file = COAD.miRseq_RPKM_log2.txt
-
Clinical data file = COAD.clin.merged.picked.txt
-
Number of patients = 378
-
Number of genes = 415
-
Number of clinical features = 9
For survival clinical features, Wald's test in univariate Cox regression analysis with proportional hazards model (Andersen and Gill 1982) was used to estimate the P values using the 'coxph' function in R. Kaplan-Meier survival curves were plot using the four quartile subgroups of patients based on expression levels
For continuous numerical clinical features, Spearman's rank correlation coefficients (Spearman 1904) and two-tailed P values were estimated using 'cor.test' function in R
For two-class clinical features, two-tailed Student's t test with unequal variance (Lehmann and Romano 2005) was applied to compare the log2-expression levels between the two clinical classes using 't.test' function in R
For multi-class clinical features (ordinal or nominal), one-way analysis of variance (Howell 2002) was applied to compare the log2-expression levels between different clinical classes using 'anova' function in R
For multiple hypothesis correction, Q value is the False Discovery Rate (FDR) analogue of the P value (Benjamini and Hochberg 1995), defined as the minimum FDR at which the test may be called significant. We used the 'Benjamini and Hochberg' method of 'p.adjust' function in R to convert P values into Q values.
This is an experimental feature. The full results of the analysis summarized in this report can be downloaded from the TCGA Data Coordination Center.