This pipeline computes the correlation between cancer subtypes identified by different molecular patterns and selected clinical features.
Testing the association between subtypes identified by 8 different clustering approaches and 10 clinical features across 422 patients, 20 significant findings detected with P value < 0.05.
-
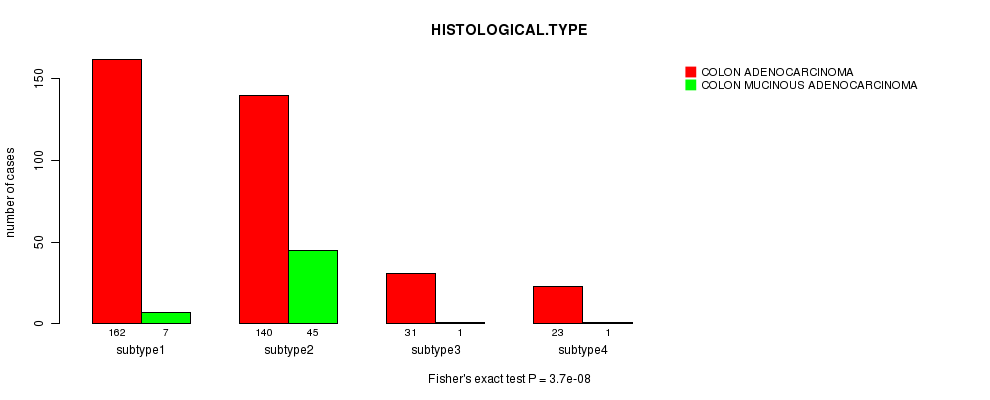
CNMF clustering analysis on array-based mRNA expression data identified 4 subtypes that correlate to 'HISTOLOGICAL.TYPE', 'PATHOLOGY.N', and 'TUMOR.STAGE'.
-
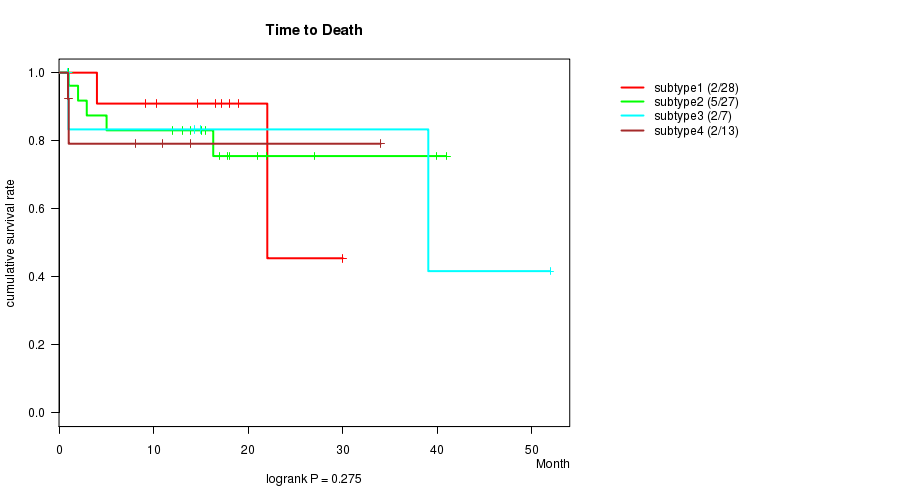
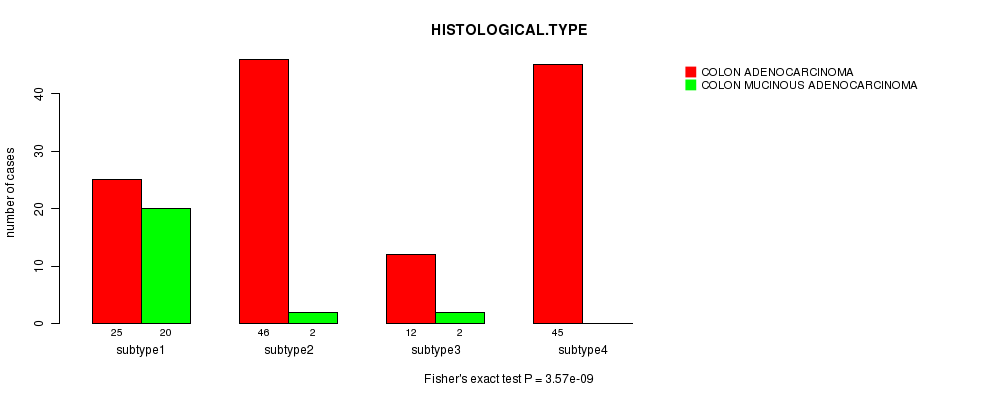
Consensus hierarchical clustering analysis on array-based mRNA expression data identified 4 subtypes that correlate to 'HISTOLOGICAL.TYPE'.
-
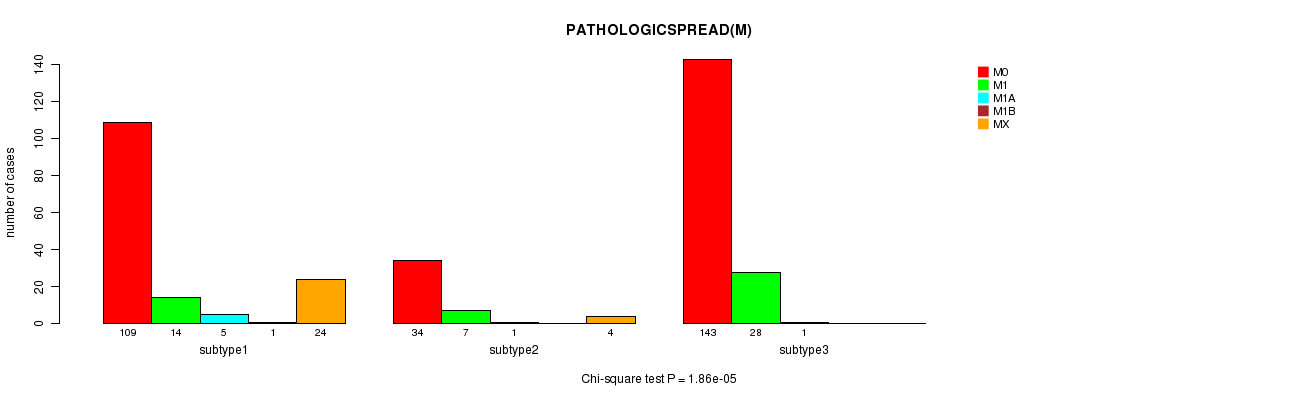
4 subtypes identified in current cancer cohort by 'CN CNMF'. These subtypes correlate to 'HISTOLOGICAL.TYPE', 'PATHOLOGY.N', 'PATHOLOGICSPREAD(M)', and 'TUMOR.STAGE'.
-
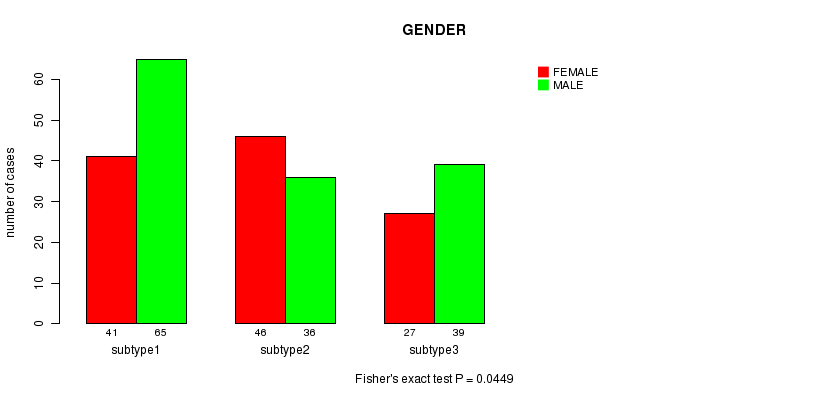
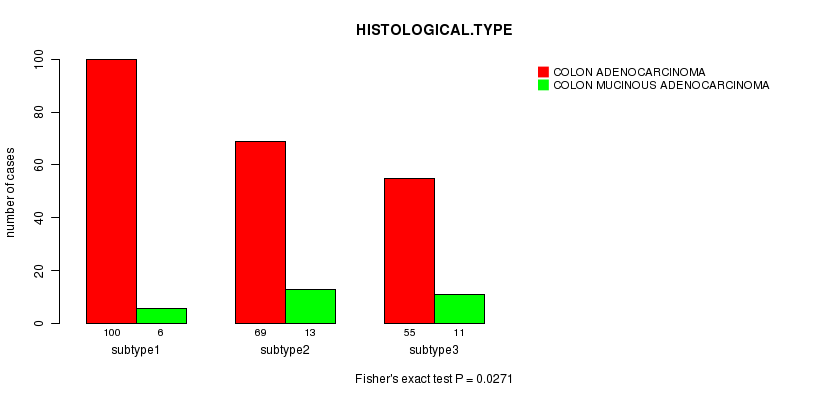
3 subtypes identified in current cancer cohort by 'METHLYATION CNMF'. These subtypes correlate to 'AGE', 'GENDER', 'HISTOLOGICAL.TYPE', and 'TUMOR.STAGE'.
-
CNMF clustering analysis on RPPA data identified 4 subtypes that correlate to 'HISTOLOGICAL.TYPE'.
-
Consensus hierarchical clustering analysis on RPPA data identified 4 subtypes that correlate to 'PATHOLOGICSPREAD(M)'.
-
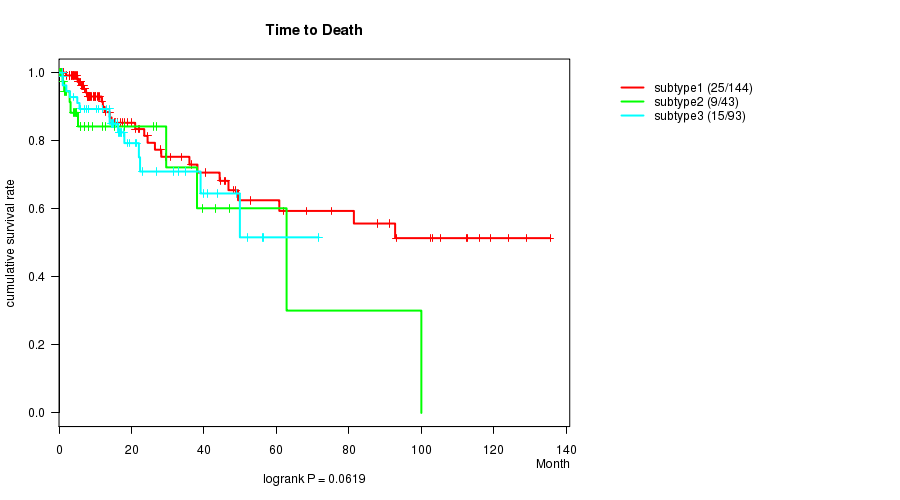
CNMF clustering analysis on sequencing-based miR expression data identified 3 subtypes that correlate to 'AGE', 'PATHOLOGICSPREAD(M)', and 'NEOADJUVANT.THERAPY'.
-
Consensus hierarchical clustering analysis on sequencing-based miR expression data identified 4 subtypes that correlate to 'AGE', 'PATHOLOGICSPREAD(M)', and 'NEOADJUVANT.THERAPY'.
Table 1. Get Full Table Overview of the association between subtypes identified by 8 different clustering approaches and 10 clinical features. Shown in the table are P values from statistical tests. Thresholded by P value < 0.05, 20 significant findings detected.
|
Clinical Features |
Statistical Tests |
mRNA CNMF subtypes |
mRNA cHierClus subtypes |
CN CNMF |
METHLYATION CNMF |
RPPA CNMF subtypes |
RPPA cHierClus subtypes |
MIRseq CNMF subtypes |
MIRseq cHierClus subtypes |
| Time to Death | logrank test | 0.0584 | 0.275 | 0.275 | 0.503 | 0.193 | 0.0562 | 0.0619 | 0.289 |
| AGE | ANOVA | 0.418 | 0.146 | 0.472 | 0.00333 | 0.501 | 0.169 | 0.00164 | 0.00948 |
| GENDER | Fisher's exact test | 0.0625 | 0.0978 | 0.487 | 0.0449 | 0.306 | 0.348 | 0.989 | 0.869 |
| HISTOLOGICAL TYPE | Fisher's exact test | 3.12e-06 | 3.57e-09 | 3.7e-08 | 0.0271 | 0.015 | 0.464 | 0.237 | 0.741 |
| PATHOLOGY T | Chi-square test | 0.89 | 0.561 | 0.944 | 0.24 | 0.23 | 0.28 | 0.494 | 0.491 |
| PATHOLOGY N | Chi-square test | 0.0267 | 0.58 | 0.00113 | 0.91 | 0.141 | 0.123 | 0.294 | 0.148 |
| PATHOLOGICSPREAD(M) | Chi-square test | 0.0549 | 0.848 | 0.00999 | 0.329 | 0.186 | 0.0432 | 1.86e-05 | 3.19e-05 |
| TUMOR STAGE | Chi-square test | 0.0374 | 0.509 | 3.6e-05 | 0.0284 | 0.117 | 0.0747 | 0.425 | 0.353 |
| RADIATIONS RADIATION REGIMENINDICATION | Fisher's exact test | 0.337 | 0.618 | 0.302 | 0.339 | 0.229 | 1 | ||
| NEOADJUVANT THERAPY | Fisher's exact test | 0.266 | 0.732 | 0.391 | 0.78 | 0.172 | 0.387 | 0.000649 | 0.00854 |
Table S1. Get Full Table Description of clustering approach #1: 'mRNA CNMF subtypes'
| Cluster Labels | 1 | 2 | 3 | 4 |
|---|---|---|---|---|
| Number of samples | 63 | 35 | 31 | 26 |
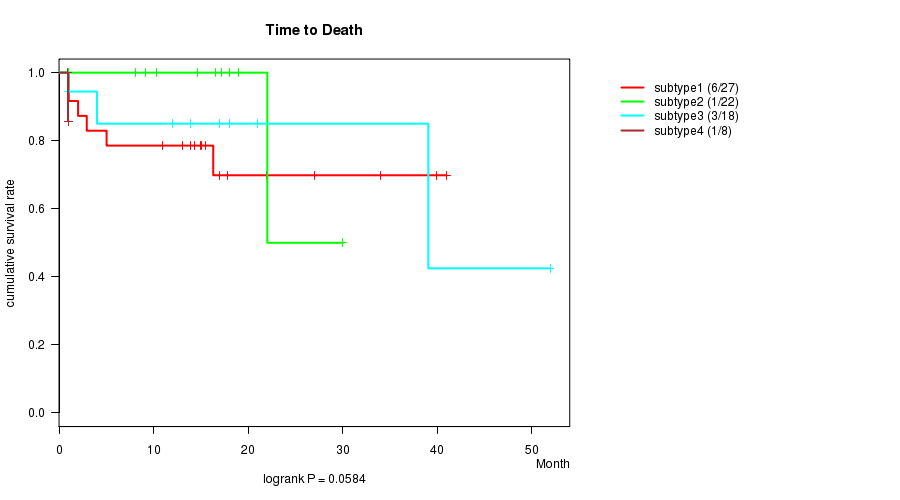
P value = 0.0584 (logrank test)
Table S2. Clustering Approach #1: 'mRNA CNMF subtypes' versus Clinical Feature #1: 'Time to Death'
| nPatients | nDeath | Duration Range (Median), Month | |
|---|---|---|---|
| ALL | 75 | 11 | 0.9 - 52.0 (5.0) |
| subtype1 | 27 | 6 | 1.0 - 41.0 (14.4) |
| subtype2 | 22 | 1 | 1.0 - 30.0 (1.0) |
| subtype3 | 18 | 3 | 1.0 - 52.0 (8.0) |
| subtype4 | 8 | 1 | 0.9 - 1.0 (1.0) |
Figure S1. Get High-res Image Clustering Approach #1: 'mRNA CNMF subtypes' versus Clinical Feature #1: 'Time to Death'
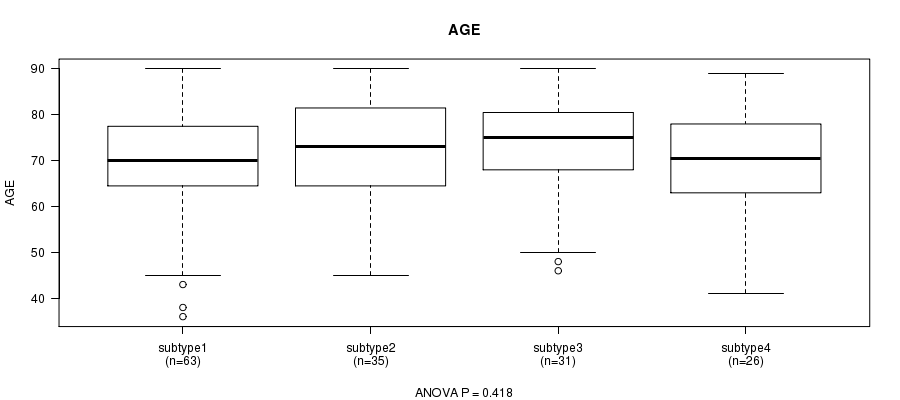
P value = 0.418 (ANOVA)
Table S3. Clustering Approach #1: 'mRNA CNMF subtypes' versus Clinical Feature #2: 'AGE'
| nPatients | Mean (Std.Dev) | |
|---|---|---|
| ALL | 155 | 70.6 (11.7) |
| subtype1 | 63 | 69.2 (11.9) |
| subtype2 | 35 | 72.1 (11.7) |
| subtype3 | 31 | 72.7 (10.9) |
| subtype4 | 26 | 69.3 (12.1) |
Figure S2. Get High-res Image Clustering Approach #1: 'mRNA CNMF subtypes' versus Clinical Feature #2: 'AGE'
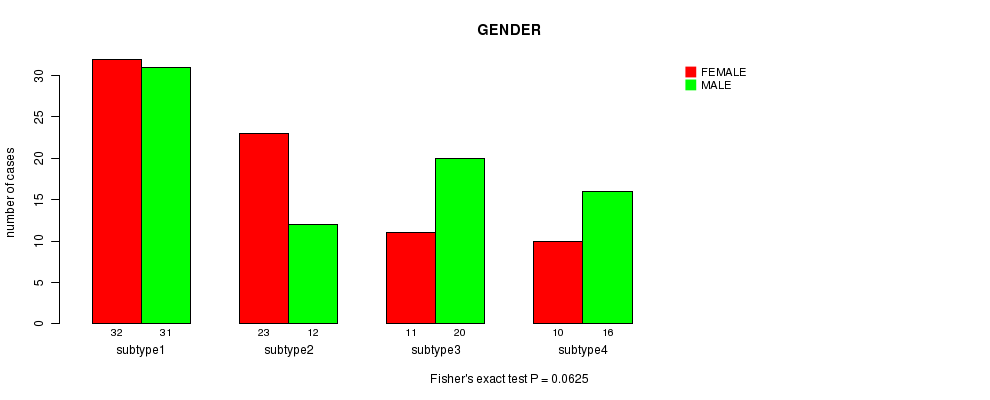
P value = 0.0625 (Fisher's exact test)
Table S4. Clustering Approach #1: 'mRNA CNMF subtypes' versus Clinical Feature #3: 'GENDER'
| nPatients | FEMALE | MALE |
|---|---|---|
| ALL | 76 | 79 |
| subtype1 | 32 | 31 |
| subtype2 | 23 | 12 |
| subtype3 | 11 | 20 |
| subtype4 | 10 | 16 |
Figure S3. Get High-res Image Clustering Approach #1: 'mRNA CNMF subtypes' versus Clinical Feature #3: 'GENDER'
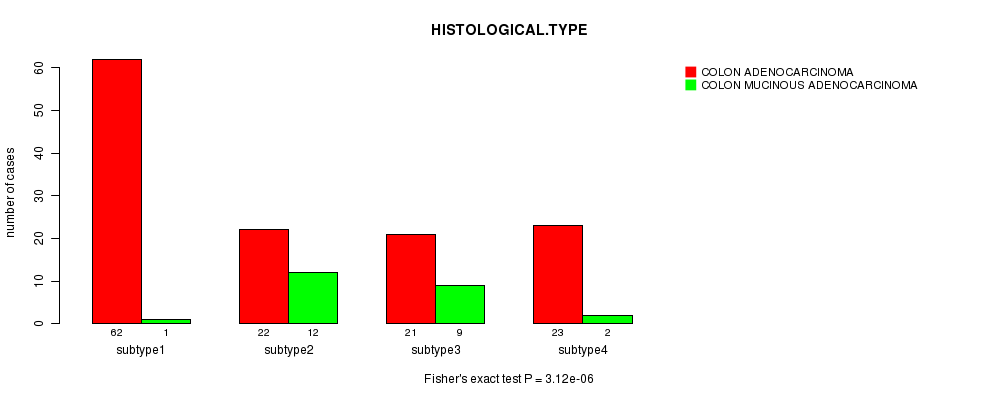
P value = 3.12e-06 (Fisher's exact test)
Table S5. Clustering Approach #1: 'mRNA CNMF subtypes' versus Clinical Feature #4: 'HISTOLOGICAL.TYPE'
| nPatients | COLON ADENOCARCINOMA | COLON MUCINOUS ADENOCARCINOMA |
|---|---|---|
| ALL | 128 | 24 |
| subtype1 | 62 | 1 |
| subtype2 | 22 | 12 |
| subtype3 | 21 | 9 |
| subtype4 | 23 | 2 |
Figure S4. Get High-res Image Clustering Approach #1: 'mRNA CNMF subtypes' versus Clinical Feature #4: 'HISTOLOGICAL.TYPE'
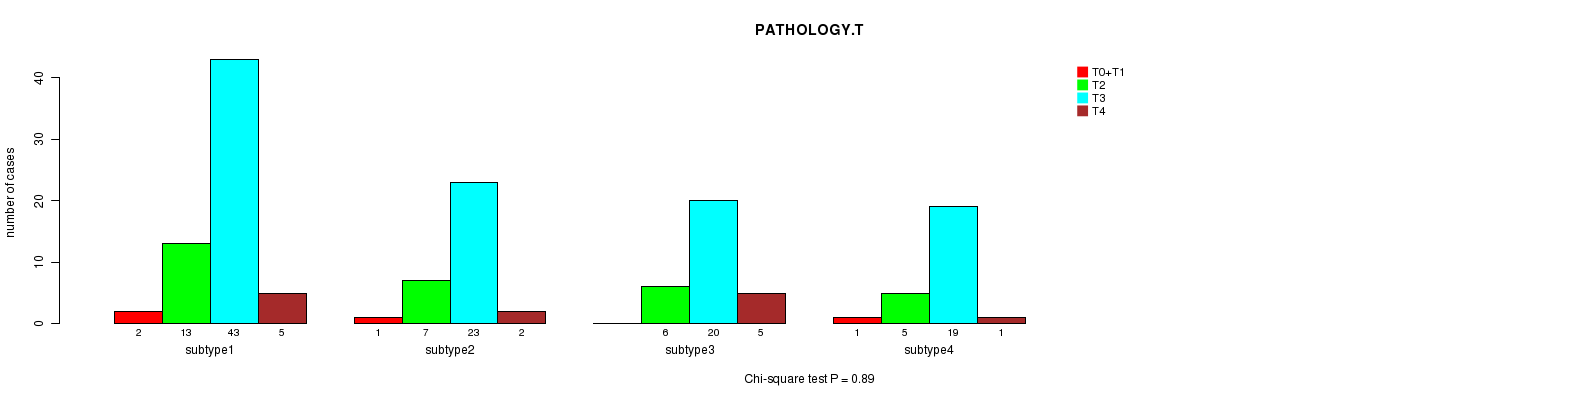
P value = 0.89 (Chi-square test)
Table S6. Clustering Approach #1: 'mRNA CNMF subtypes' versus Clinical Feature #5: 'PATHOLOGY.T'
| nPatients | T0+T1 | T2 | T3 | T4 |
|---|---|---|---|---|
| ALL | 4 | 31 | 105 | 13 |
| subtype1 | 2 | 13 | 43 | 5 |
| subtype2 | 1 | 7 | 23 | 2 |
| subtype3 | 0 | 6 | 20 | 5 |
| subtype4 | 1 | 5 | 19 | 1 |
Figure S5. Get High-res Image Clustering Approach #1: 'mRNA CNMF subtypes' versus Clinical Feature #5: 'PATHOLOGY.T'
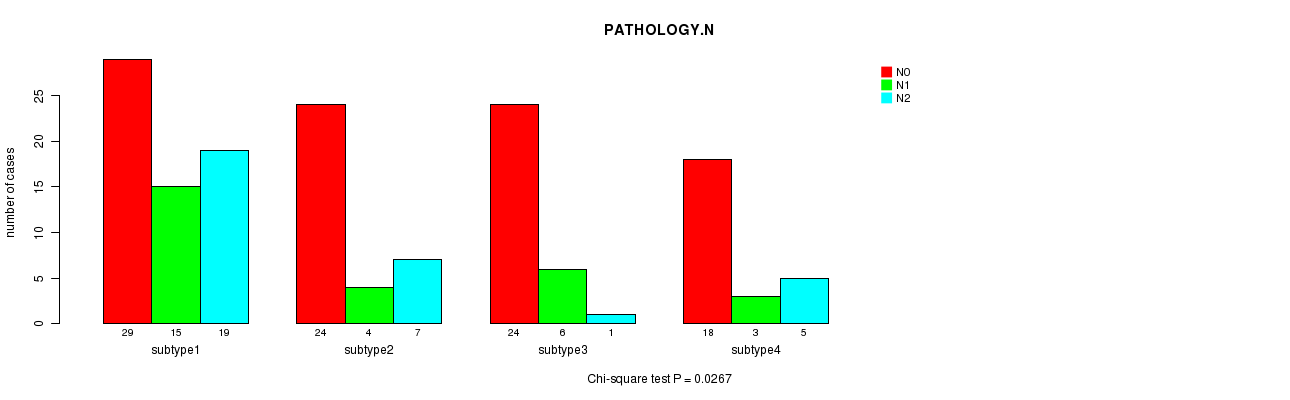
P value = 0.0267 (Chi-square test)
Table S7. Clustering Approach #1: 'mRNA CNMF subtypes' versus Clinical Feature #6: 'PATHOLOGY.N'
| nPatients | N0 | N1 | N2 |
|---|---|---|---|
| ALL | 95 | 28 | 32 |
| subtype1 | 29 | 15 | 19 |
| subtype2 | 24 | 4 | 7 |
| subtype3 | 24 | 6 | 1 |
| subtype4 | 18 | 3 | 5 |
Figure S6. Get High-res Image Clustering Approach #1: 'mRNA CNMF subtypes' versus Clinical Feature #6: 'PATHOLOGY.N'
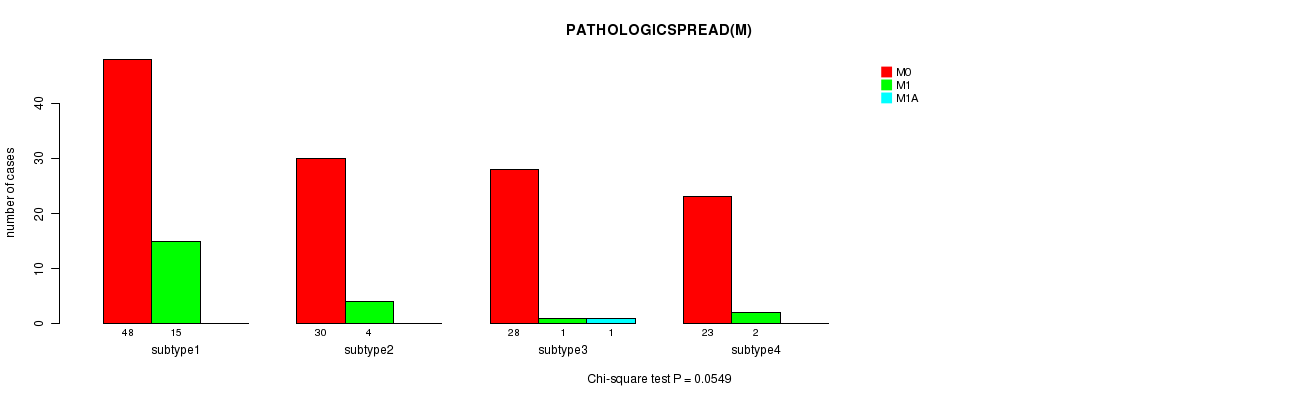
P value = 0.0549 (Chi-square test)
Table S8. Clustering Approach #1: 'mRNA CNMF subtypes' versus Clinical Feature #7: 'PATHOLOGICSPREAD(M)'
| nPatients | M0 | M1 | M1A |
|---|---|---|---|
| ALL | 129 | 22 | 1 |
| subtype1 | 48 | 15 | 0 |
| subtype2 | 30 | 4 | 0 |
| subtype3 | 28 | 1 | 1 |
| subtype4 | 23 | 2 | 0 |
Figure S7. Get High-res Image Clustering Approach #1: 'mRNA CNMF subtypes' versus Clinical Feature #7: 'PATHOLOGICSPREAD(M)'
P value = 0.0374 (Chi-square test)
Table S9. Clustering Approach #1: 'mRNA CNMF subtypes' versus Clinical Feature #8: 'TUMOR.STAGE'
| nPatients | I | II | III | IV |
|---|---|---|---|---|
| ALL | 28 | 63 | 39 | 22 |
| subtype1 | 12 | 15 | 21 | 15 |
| subtype2 | 6 | 17 | 7 | 3 |
| subtype3 | 5 | 18 | 5 | 2 |
| subtype4 | 5 | 13 | 6 | 2 |
Figure S8. Get High-res Image Clustering Approach #1: 'mRNA CNMF subtypes' versus Clinical Feature #8: 'TUMOR.STAGE'
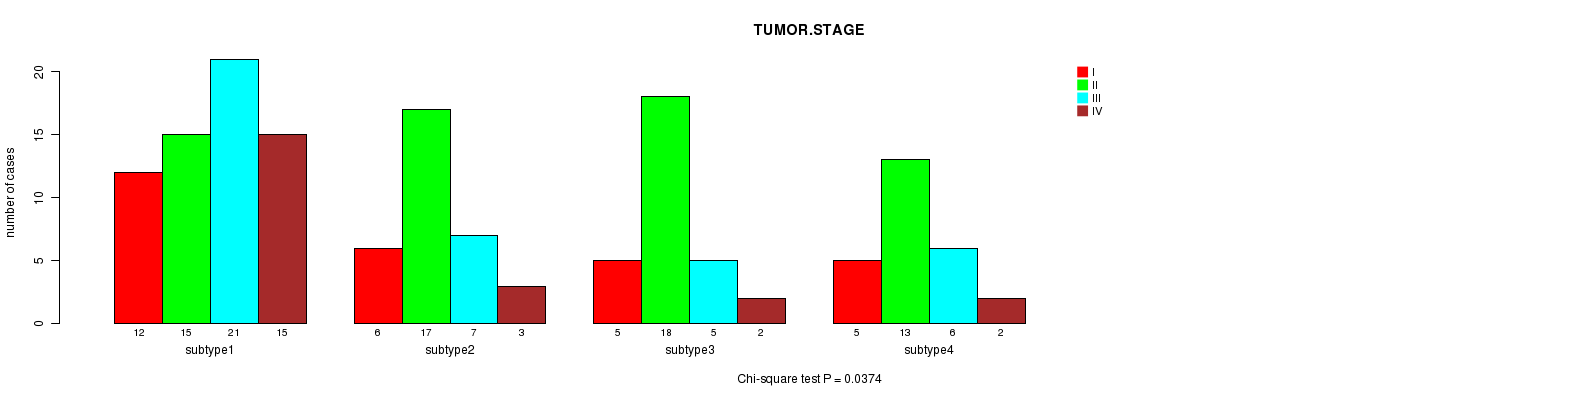
Table S10. Get Full Table Description of clustering approach #2: 'mRNA cHierClus subtypes'
| Cluster Labels | 1 | 2 | 3 | 4 |
|---|---|---|---|---|
| Number of samples | 47 | 48 | 14 | 46 |
P value = 0.275 (logrank test)
Table S11. Clustering Approach #2: 'mRNA cHierClus subtypes' versus Clinical Feature #1: 'Time to Death'
| nPatients | nDeath | Duration Range (Median), Month | |
|---|---|---|---|
| ALL | 75 | 11 | 0.9 - 52.0 (5.0) |
| subtype1 | 28 | 2 | 1.0 - 30.0 (1.0) |
| subtype2 | 27 | 5 | 1.0 - 41.0 (15.0) |
| subtype3 | 7 | 2 | 0.9 - 52.0 (14.4) |
| subtype4 | 13 | 2 | 0.9 - 34.0 (1.0) |
Figure S9. Get High-res Image Clustering Approach #2: 'mRNA cHierClus subtypes' versus Clinical Feature #1: 'Time to Death'
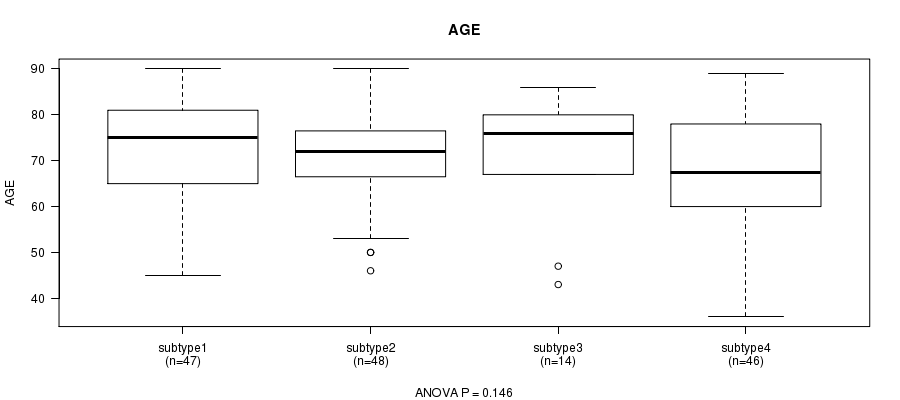
P value = 0.146 (ANOVA)
Table S12. Clustering Approach #2: 'mRNA cHierClus subtypes' versus Clinical Feature #2: 'AGE'
| nPatients | Mean (Std.Dev) | |
|---|---|---|
| ALL | 155 | 70.6 (11.7) |
| subtype1 | 47 | 73.1 (11.5) |
| subtype2 | 48 | 70.7 (9.6) |
| subtype3 | 14 | 71.6 (12.8) |
| subtype4 | 46 | 67.5 (13.0) |
Figure S10. Get High-res Image Clustering Approach #2: 'mRNA cHierClus subtypes' versus Clinical Feature #2: 'AGE'
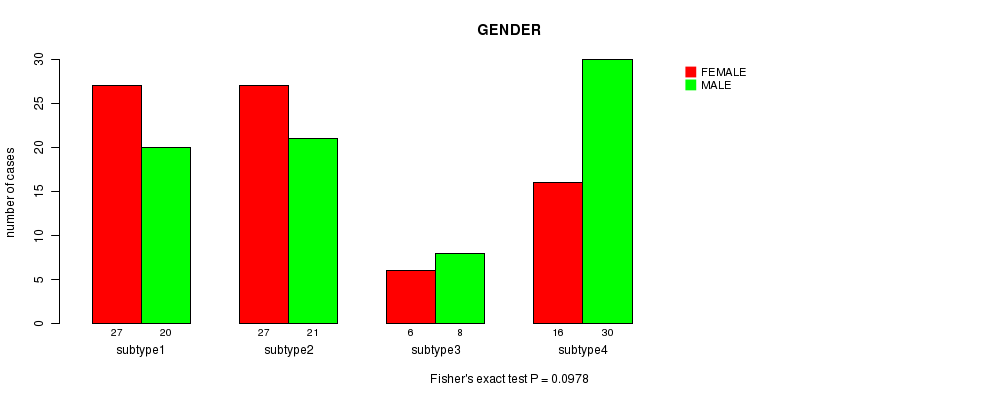
P value = 0.0978 (Fisher's exact test)
Table S13. Clustering Approach #2: 'mRNA cHierClus subtypes' versus Clinical Feature #3: 'GENDER'
| nPatients | FEMALE | MALE |
|---|---|---|
| ALL | 76 | 79 |
| subtype1 | 27 | 20 |
| subtype2 | 27 | 21 |
| subtype3 | 6 | 8 |
| subtype4 | 16 | 30 |
Figure S11. Get High-res Image Clustering Approach #2: 'mRNA cHierClus subtypes' versus Clinical Feature #3: 'GENDER'
P value = 3.57e-09 (Fisher's exact test)
Table S14. Clustering Approach #2: 'mRNA cHierClus subtypes' versus Clinical Feature #4: 'HISTOLOGICAL.TYPE'
| nPatients | COLON ADENOCARCINOMA | COLON MUCINOUS ADENOCARCINOMA |
|---|---|---|
| ALL | 128 | 24 |
| subtype1 | 25 | 20 |
| subtype2 | 46 | 2 |
| subtype3 | 12 | 2 |
| subtype4 | 45 | 0 |
Figure S12. Get High-res Image Clustering Approach #2: 'mRNA cHierClus subtypes' versus Clinical Feature #4: 'HISTOLOGICAL.TYPE'
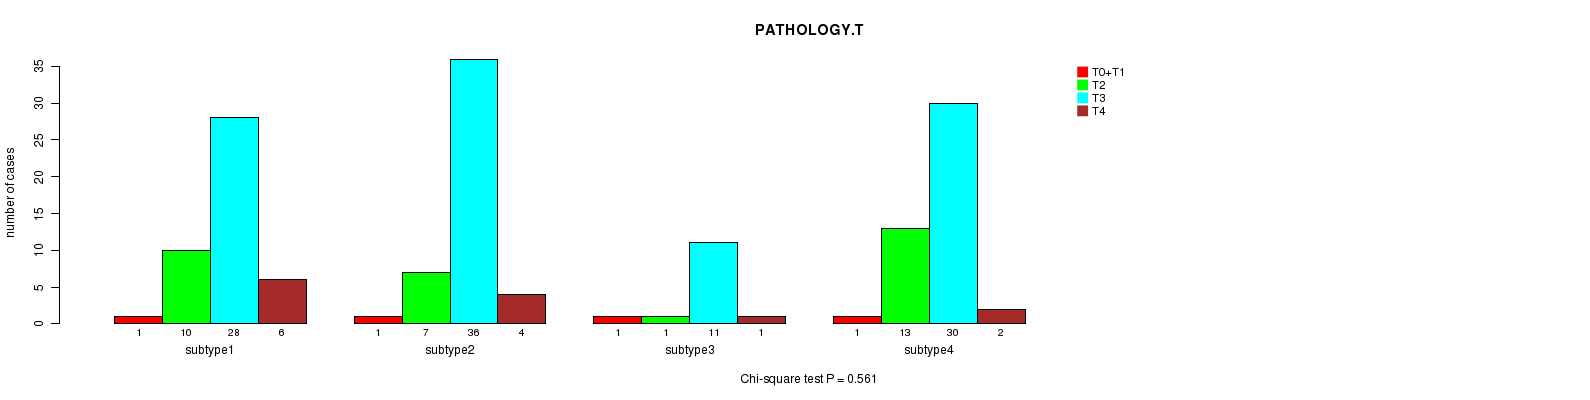
P value = 0.561 (Chi-square test)
Table S15. Clustering Approach #2: 'mRNA cHierClus subtypes' versus Clinical Feature #5: 'PATHOLOGY.T'
| nPatients | T0+T1 | T2 | T3 | T4 |
|---|---|---|---|---|
| ALL | 4 | 31 | 105 | 13 |
| subtype1 | 1 | 10 | 28 | 6 |
| subtype2 | 1 | 7 | 36 | 4 |
| subtype3 | 1 | 1 | 11 | 1 |
| subtype4 | 1 | 13 | 30 | 2 |
Figure S13. Get High-res Image Clustering Approach #2: 'mRNA cHierClus subtypes' versus Clinical Feature #5: 'PATHOLOGY.T'
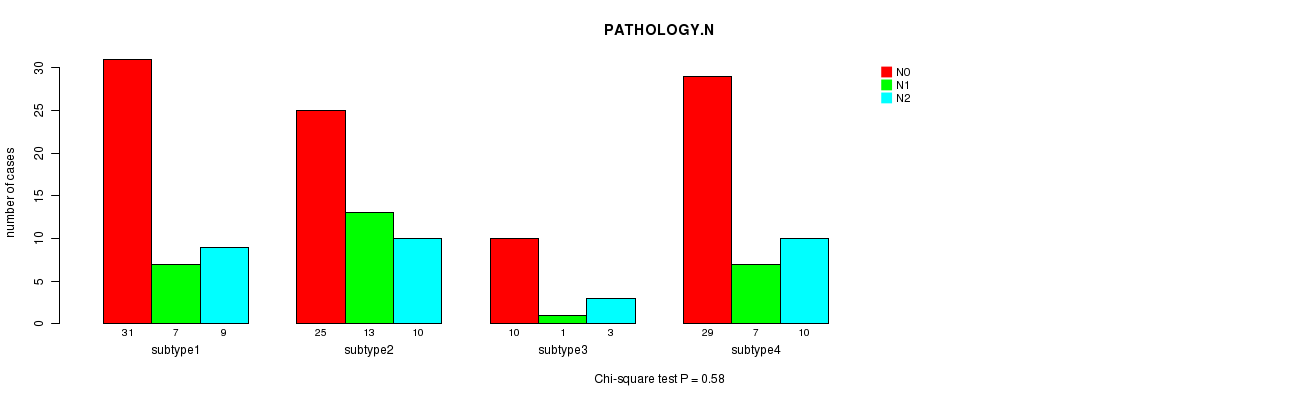
P value = 0.58 (Chi-square test)
Table S16. Clustering Approach #2: 'mRNA cHierClus subtypes' versus Clinical Feature #6: 'PATHOLOGY.N'
| nPatients | N0 | N1 | N2 |
|---|---|---|---|
| ALL | 95 | 28 | 32 |
| subtype1 | 31 | 7 | 9 |
| subtype2 | 25 | 13 | 10 |
| subtype3 | 10 | 1 | 3 |
| subtype4 | 29 | 7 | 10 |
Figure S14. Get High-res Image Clustering Approach #2: 'mRNA cHierClus subtypes' versus Clinical Feature #6: 'PATHOLOGY.N'
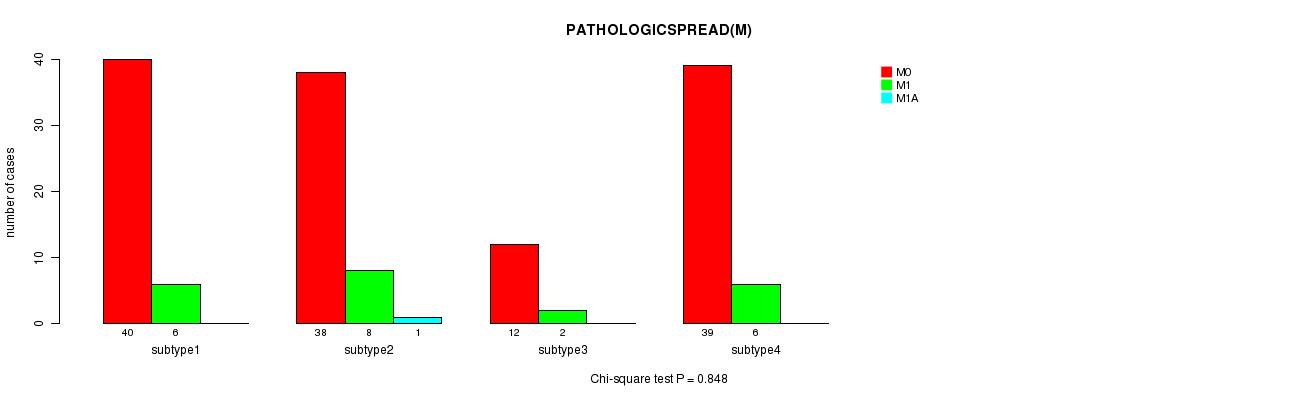
P value = 0.848 (Chi-square test)
Table S17. Clustering Approach #2: 'mRNA cHierClus subtypes' versus Clinical Feature #7: 'PATHOLOGICSPREAD(M)'
| nPatients | M0 | M1 | M1A |
|---|---|---|---|
| ALL | 129 | 22 | 1 |
| subtype1 | 40 | 6 | 0 |
| subtype2 | 38 | 8 | 1 |
| subtype3 | 12 | 2 | 0 |
| subtype4 | 39 | 6 | 0 |
Figure S15. Get High-res Image Clustering Approach #2: 'mRNA cHierClus subtypes' versus Clinical Feature #7: 'PATHOLOGICSPREAD(M)'
P value = 0.509 (Chi-square test)
Table S18. Clustering Approach #2: 'mRNA cHierClus subtypes' versus Clinical Feature #8: 'TUMOR.STAGE'
| nPatients | I | II | III | IV |
|---|---|---|---|---|
| ALL | 28 | 63 | 39 | 22 |
| subtype1 | 9 | 21 | 10 | 5 |
| subtype2 | 5 | 17 | 16 | 9 |
| subtype3 | 2 | 8 | 2 | 2 |
| subtype4 | 12 | 17 | 11 | 6 |
Figure S16. Get High-res Image Clustering Approach #2: 'mRNA cHierClus subtypes' versus Clinical Feature #8: 'TUMOR.STAGE'
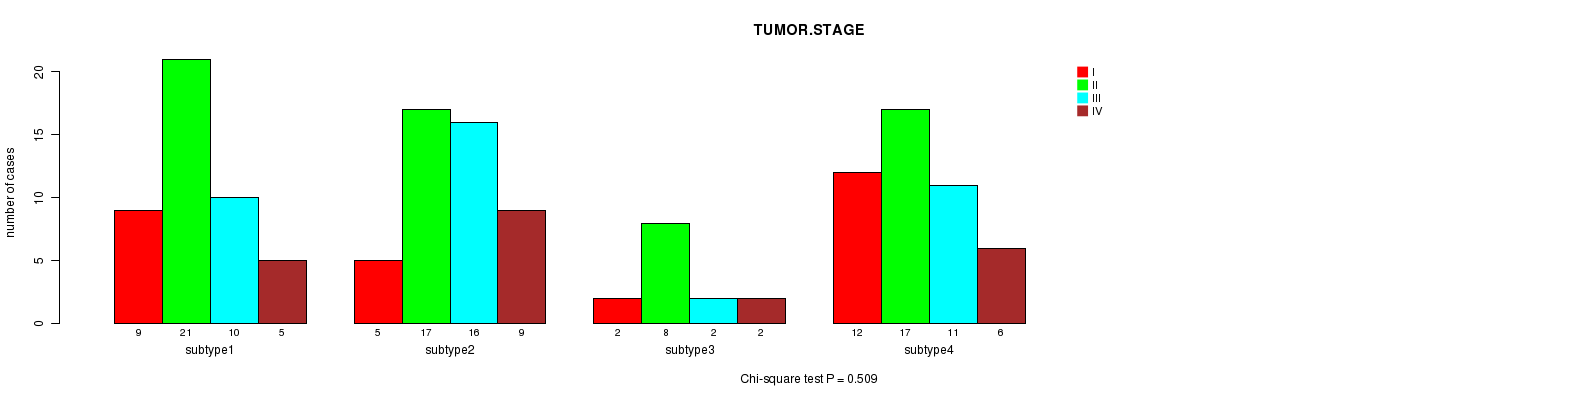
Table S19. Get Full Table Description of clustering approach #3: 'CN CNMF'
| Cluster Labels | 1 | 2 | 3 | 4 |
|---|---|---|---|---|
| Number of samples | 170 | 187 | 32 | 24 |
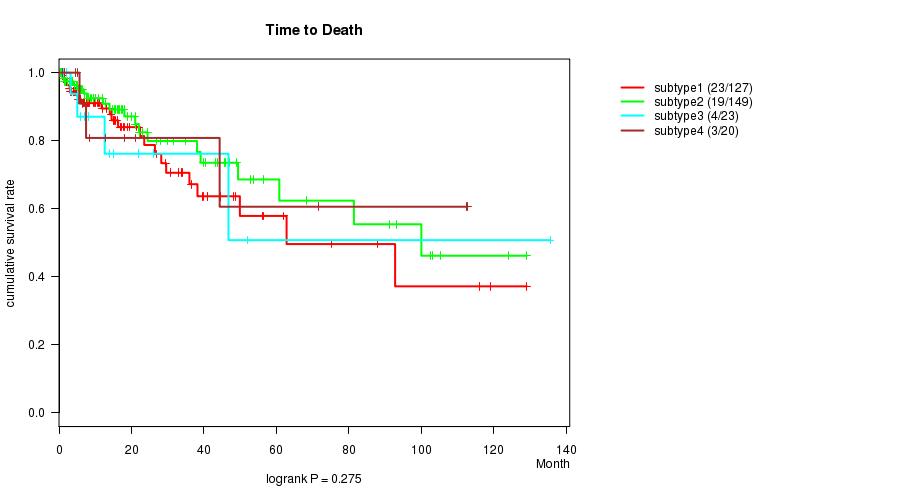
P value = 0.275 (logrank test)
Table S20. Clustering Approach #3: 'CN CNMF' versus Clinical Feature #1: 'Time to Death'
| nPatients | nDeath | Duration Range (Median), Month | |
|---|---|---|---|
| ALL | 319 | 49 | 0.1 - 135.5 (7.7) |
| subtype1 | 127 | 23 | 0.1 - 129.1 (10.0) |
| subtype2 | 149 | 19 | 0.1 - 129.1 (6.1) |
| subtype3 | 23 | 4 | 0.3 - 135.5 (7.0) |
| subtype4 | 20 | 3 | 0.2 - 112.7 (6.0) |
Figure S17. Get High-res Image Clustering Approach #3: 'CN CNMF' versus Clinical Feature #1: 'Time to Death'
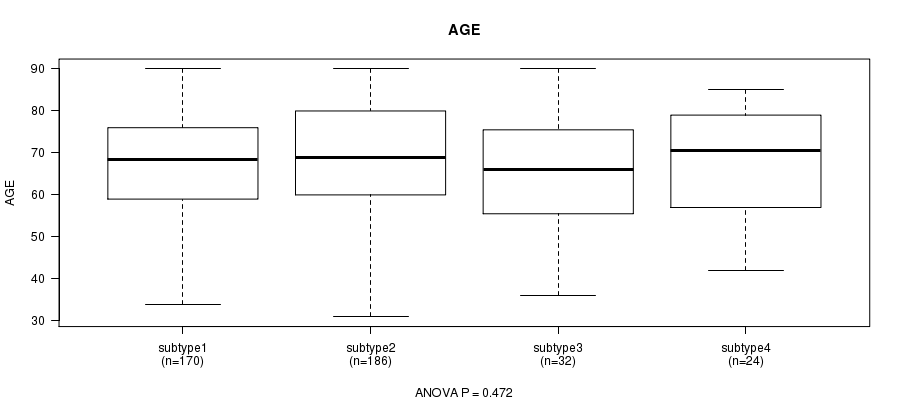
P value = 0.472 (ANOVA)
Table S21. Clustering Approach #3: 'CN CNMF' versus Clinical Feature #2: 'AGE'
| nPatients | Mean (Std.Dev) | |
|---|---|---|
| ALL | 412 | 67.3 (13.0) |
| subtype1 | 170 | 66.4 (12.4) |
| subtype2 | 186 | 68.3 (13.7) |
| subtype3 | 32 | 66.0 (13.0) |
| subtype4 | 24 | 68.2 (12.0) |
Figure S18. Get High-res Image Clustering Approach #3: 'CN CNMF' versus Clinical Feature #2: 'AGE'
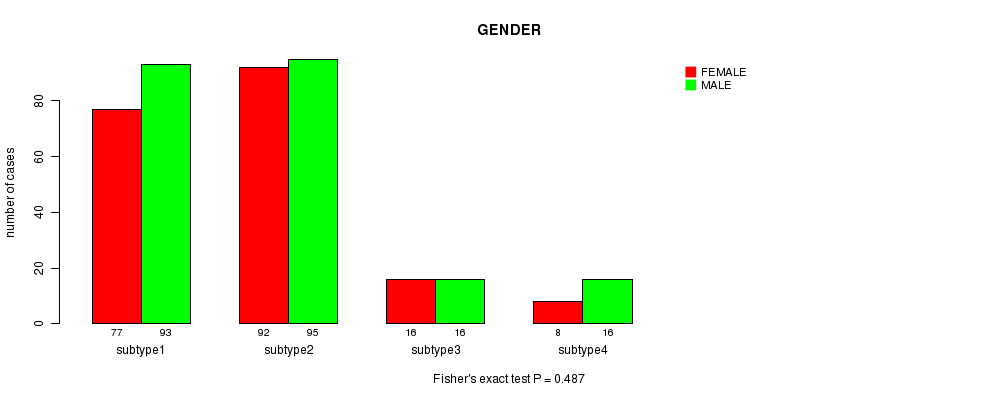
P value = 0.487 (Fisher's exact test)
Table S22. Clustering Approach #3: 'CN CNMF' versus Clinical Feature #3: 'GENDER'
| nPatients | FEMALE | MALE |
|---|---|---|
| ALL | 193 | 220 |
| subtype1 | 77 | 93 |
| subtype2 | 92 | 95 |
| subtype3 | 16 | 16 |
| subtype4 | 8 | 16 |
Figure S19. Get High-res Image Clustering Approach #3: 'CN CNMF' versus Clinical Feature #3: 'GENDER'
P value = 3.7e-08 (Fisher's exact test)
Table S23. Clustering Approach #3: 'CN CNMF' versus Clinical Feature #4: 'HISTOLOGICAL.TYPE'
| nPatients | COLON ADENOCARCINOMA | COLON MUCINOUS ADENOCARCINOMA |
|---|---|---|
| ALL | 356 | 54 |
| subtype1 | 162 | 7 |
| subtype2 | 140 | 45 |
| subtype3 | 31 | 1 |
| subtype4 | 23 | 1 |
Figure S20. Get High-res Image Clustering Approach #3: 'CN CNMF' versus Clinical Feature #4: 'HISTOLOGICAL.TYPE'
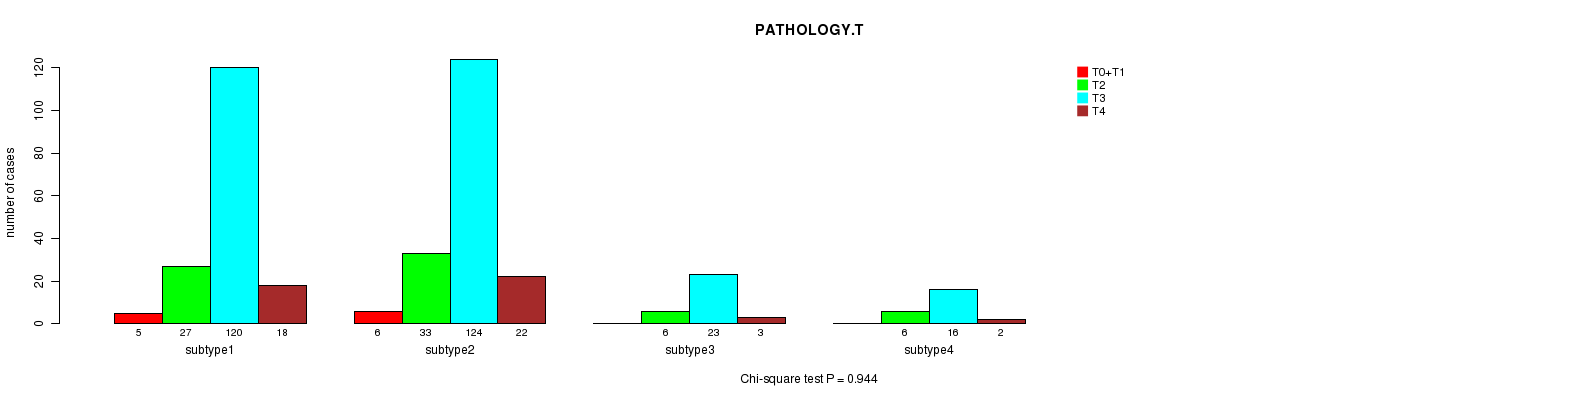
P value = 0.944 (Chi-square test)
Table S24. Clustering Approach #3: 'CN CNMF' versus Clinical Feature #5: 'PATHOLOGY.T'
| nPatients | T0+T1 | T2 | T3 | T4 |
|---|---|---|---|---|
| ALL | 11 | 72 | 283 | 45 |
| subtype1 | 5 | 27 | 120 | 18 |
| subtype2 | 6 | 33 | 124 | 22 |
| subtype3 | 0 | 6 | 23 | 3 |
| subtype4 | 0 | 6 | 16 | 2 |
Figure S21. Get High-res Image Clustering Approach #3: 'CN CNMF' versus Clinical Feature #5: 'PATHOLOGY.T'
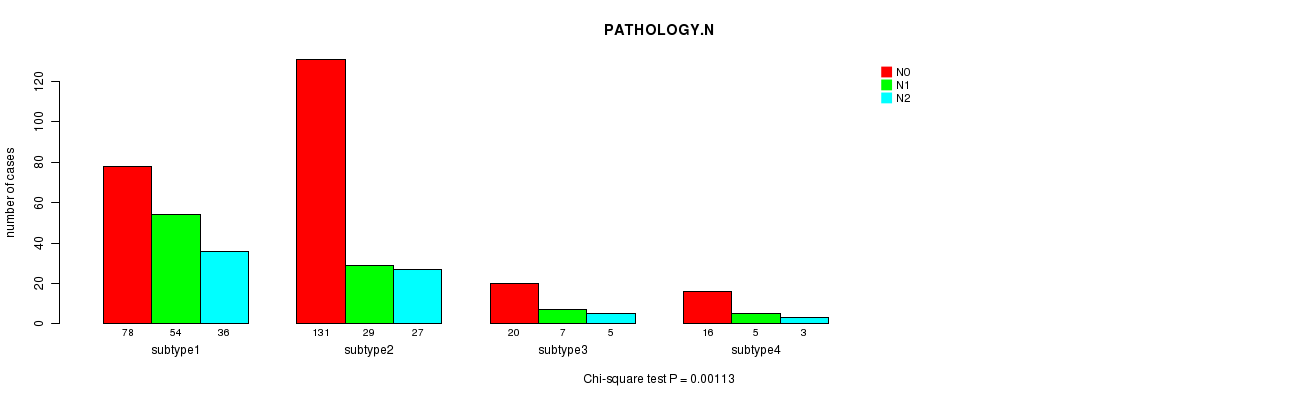
P value = 0.00113 (Chi-square test)
Table S25. Clustering Approach #3: 'CN CNMF' versus Clinical Feature #6: 'PATHOLOGY.N'
| nPatients | N0 | N1 | N2 |
|---|---|---|---|
| ALL | 245 | 95 | 71 |
| subtype1 | 78 | 54 | 36 |
| subtype2 | 131 | 29 | 27 |
| subtype3 | 20 | 7 | 5 |
| subtype4 | 16 | 5 | 3 |
Figure S22. Get High-res Image Clustering Approach #3: 'CN CNMF' versus Clinical Feature #6: 'PATHOLOGY.N'
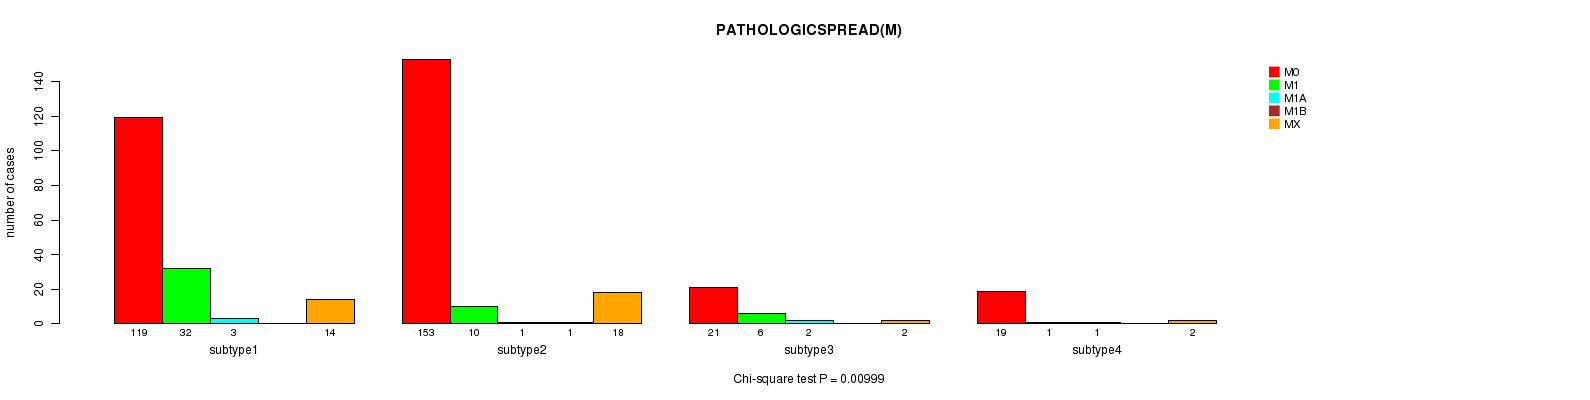
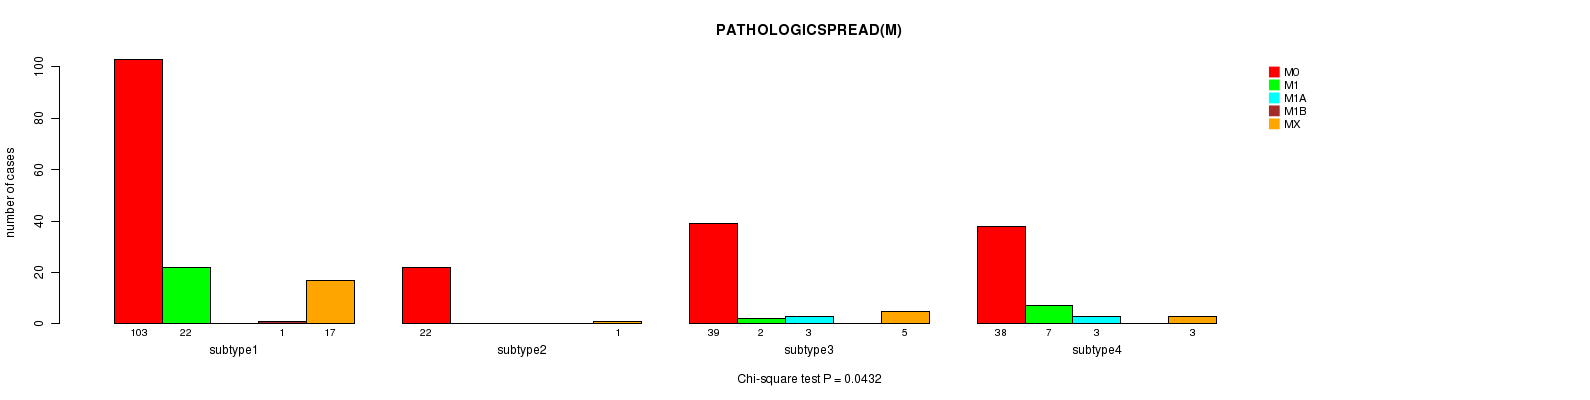
P value = 0.00999 (Chi-square test)
Table S26. Clustering Approach #3: 'CN CNMF' versus Clinical Feature #7: 'PATHOLOGICSPREAD(M)'
| nPatients | M0 | M1 | M1A | M1B | MX |
|---|---|---|---|---|---|
| ALL | 312 | 49 | 7 | 1 | 36 |
| subtype1 | 119 | 32 | 3 | 0 | 14 |
| subtype2 | 153 | 10 | 1 | 1 | 18 |
| subtype3 | 21 | 6 | 2 | 0 | 2 |
| subtype4 | 19 | 1 | 1 | 0 | 2 |
Figure S23. Get High-res Image Clustering Approach #3: 'CN CNMF' versus Clinical Feature #7: 'PATHOLOGICSPREAD(M)'
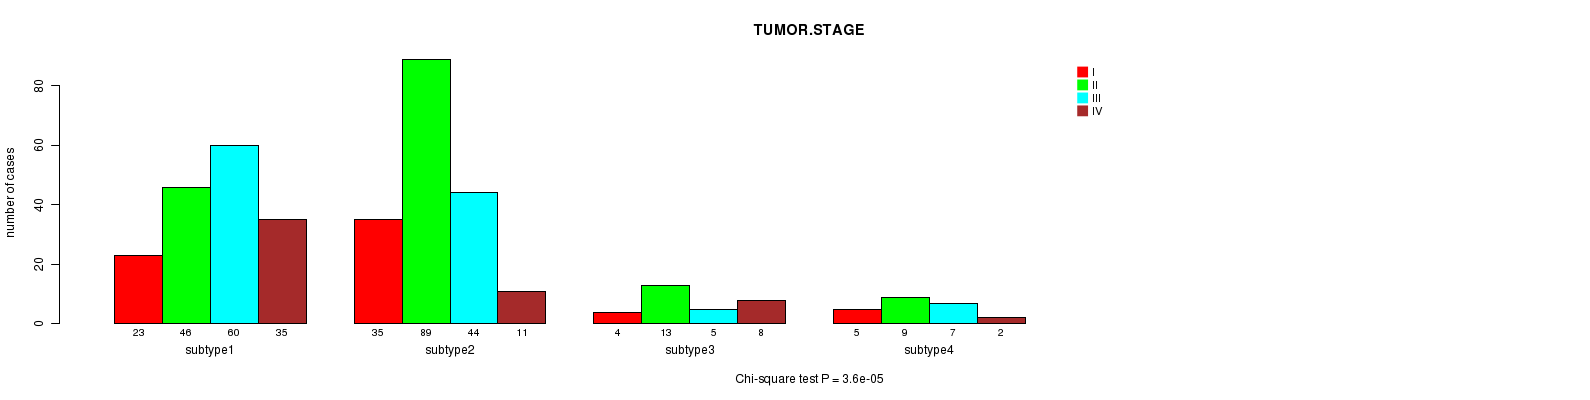
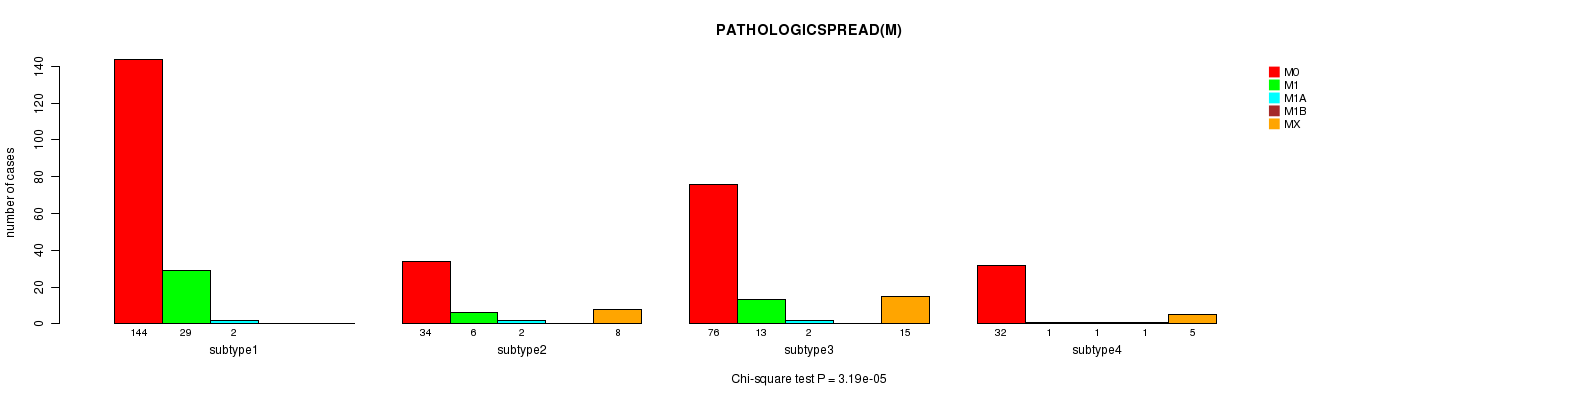
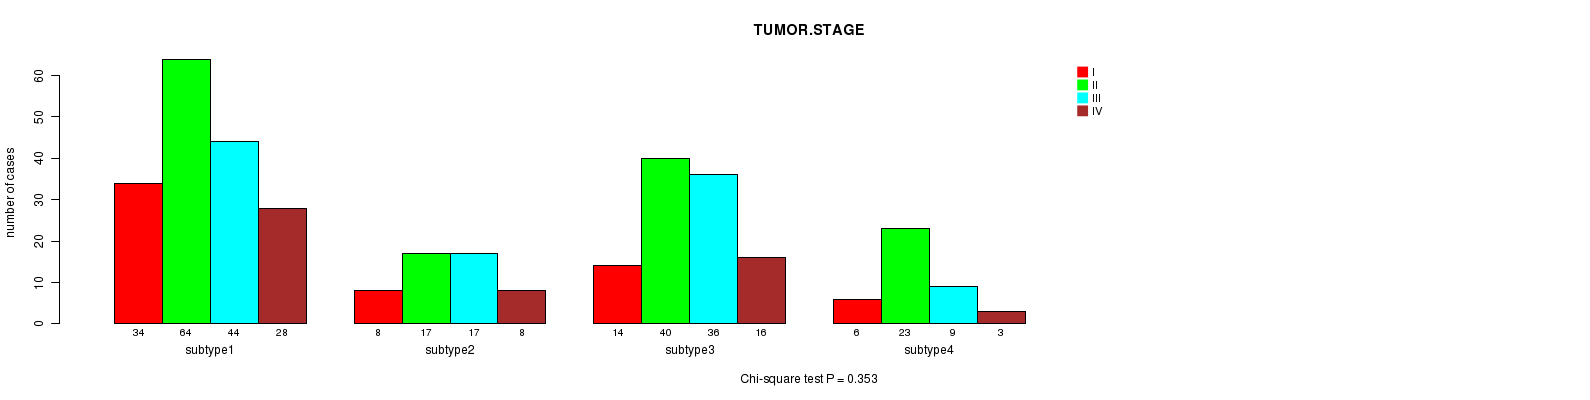
P value = 3.6e-05 (Chi-square test)
Table S27. Clustering Approach #3: 'CN CNMF' versus Clinical Feature #8: 'TUMOR.STAGE'
| nPatients | I | II | III | IV |
|---|---|---|---|---|
| ALL | 67 | 157 | 116 | 56 |
| subtype1 | 23 | 46 | 60 | 35 |
| subtype2 | 35 | 89 | 44 | 11 |
| subtype3 | 4 | 13 | 5 | 8 |
| subtype4 | 5 | 9 | 7 | 2 |
Figure S24. Get High-res Image Clustering Approach #3: 'CN CNMF' versus Clinical Feature #8: 'TUMOR.STAGE'
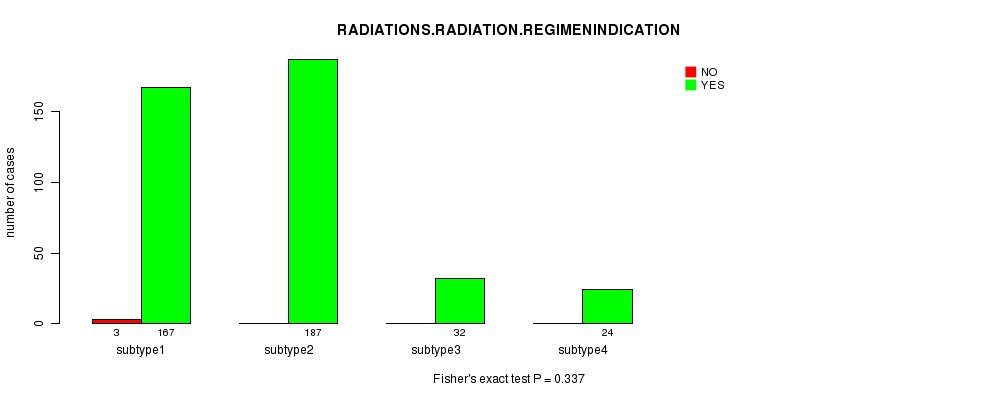
P value = 0.337 (Fisher's exact test)
Table S28. Clustering Approach #3: 'CN CNMF' versus Clinical Feature #9: 'RADIATIONS.RADIATION.REGIMENINDICATION'
| nPatients | NO | YES |
|---|---|---|
| ALL | 3 | 410 |
| subtype1 | 3 | 167 |
| subtype2 | 0 | 187 |
| subtype3 | 0 | 32 |
| subtype4 | 0 | 24 |
Figure S25. Get High-res Image Clustering Approach #3: 'CN CNMF' versus Clinical Feature #9: 'RADIATIONS.RADIATION.REGIMENINDICATION'
P value = 0.391 (Fisher's exact test)
Table S29. Clustering Approach #3: 'CN CNMF' versus Clinical Feature #10: 'NEOADJUVANT.THERAPY'
| nPatients | NO | YES |
|---|---|---|
| ALL | 58 | 355 |
| subtype1 | 28 | 142 |
| subtype2 | 26 | 161 |
| subtype3 | 3 | 29 |
| subtype4 | 1 | 23 |
Figure S26. Get High-res Image Clustering Approach #3: 'CN CNMF' versus Clinical Feature #10: 'NEOADJUVANT.THERAPY'
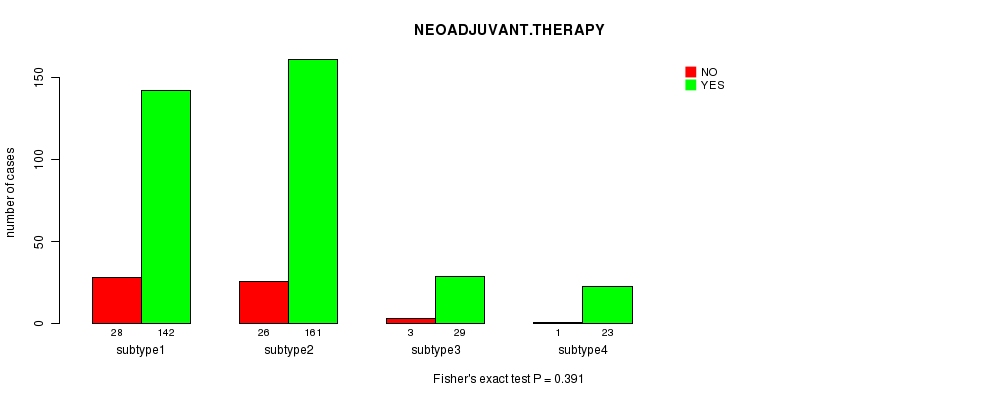
Table S30. Get Full Table Description of clustering approach #4: 'METHLYATION CNMF'
| Cluster Labels | 1 | 2 | 3 |
|---|---|---|---|
| Number of samples | 106 | 82 | 66 |
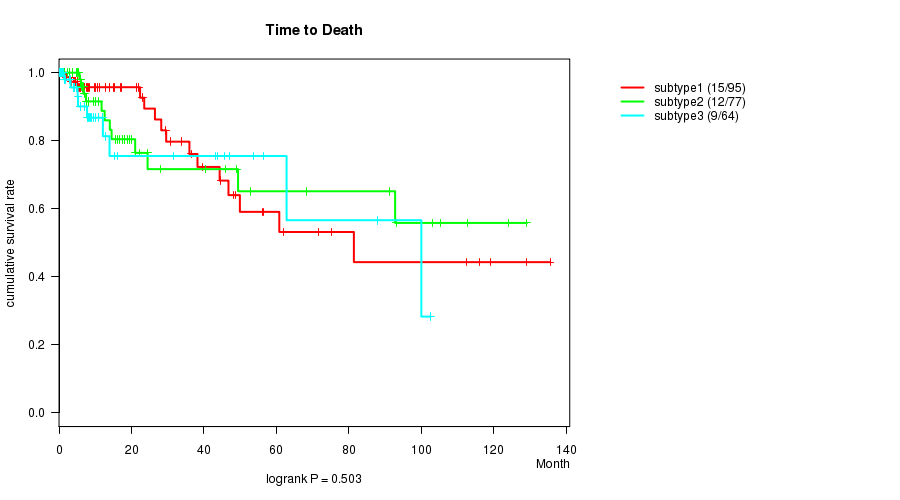
P value = 0.503 (logrank test)
Table S31. Clustering Approach #4: 'METHLYATION CNMF' versus Clinical Feature #1: 'Time to Death'
| nPatients | nDeath | Duration Range (Median), Month | |
|---|---|---|---|
| ALL | 236 | 36 | 0.1 - 135.5 (7.5) |
| subtype1 | 95 | 15 | 0.1 - 135.5 (8.0) |
| subtype2 | 77 | 12 | 0.1 - 129.1 (8.1) |
| subtype3 | 64 | 9 | 0.1 - 102.4 (5.5) |
Figure S27. Get High-res Image Clustering Approach #4: 'METHLYATION CNMF' versus Clinical Feature #1: 'Time to Death'
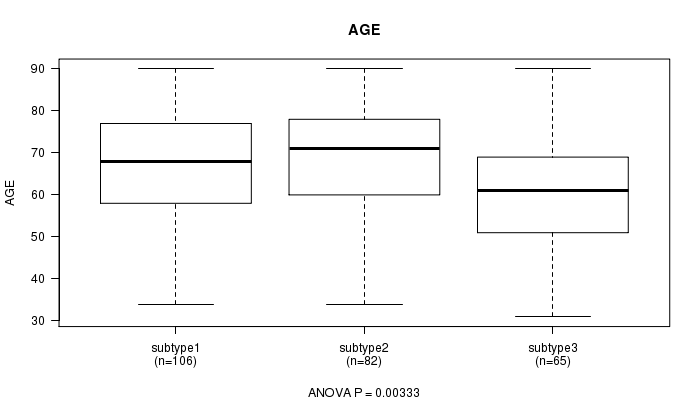
P value = 0.00333 (ANOVA)
Table S32. Clustering Approach #4: 'METHLYATION CNMF' versus Clinical Feature #2: 'AGE'
| nPatients | Mean (Std.Dev) | |
|---|---|---|
| ALL | 253 | 65.4 (13.3) |
| subtype1 | 106 | 66.6 (13.0) |
| subtype2 | 82 | 67.5 (13.2) |
| subtype3 | 65 | 60.7 (12.8) |
Figure S28. Get High-res Image Clustering Approach #4: 'METHLYATION CNMF' versus Clinical Feature #2: 'AGE'
P value = 0.0449 (Fisher's exact test)
Table S33. Clustering Approach #4: 'METHLYATION CNMF' versus Clinical Feature #3: 'GENDER'
| nPatients | FEMALE | MALE |
|---|---|---|
| ALL | 114 | 140 |
| subtype1 | 41 | 65 |
| subtype2 | 46 | 36 |
| subtype3 | 27 | 39 |
Figure S29. Get High-res Image Clustering Approach #4: 'METHLYATION CNMF' versus Clinical Feature #3: 'GENDER'
P value = 0.0271 (Fisher's exact test)
Table S34. Clustering Approach #4: 'METHLYATION CNMF' versus Clinical Feature #4: 'HISTOLOGICAL.TYPE'
| nPatients | COLON ADENOCARCINOMA | COLON MUCINOUS ADENOCARCINOMA |
|---|---|---|
| ALL | 224 | 30 |
| subtype1 | 100 | 6 |
| subtype2 | 69 | 13 |
| subtype3 | 55 | 11 |
Figure S30. Get High-res Image Clustering Approach #4: 'METHLYATION CNMF' versus Clinical Feature #4: 'HISTOLOGICAL.TYPE'
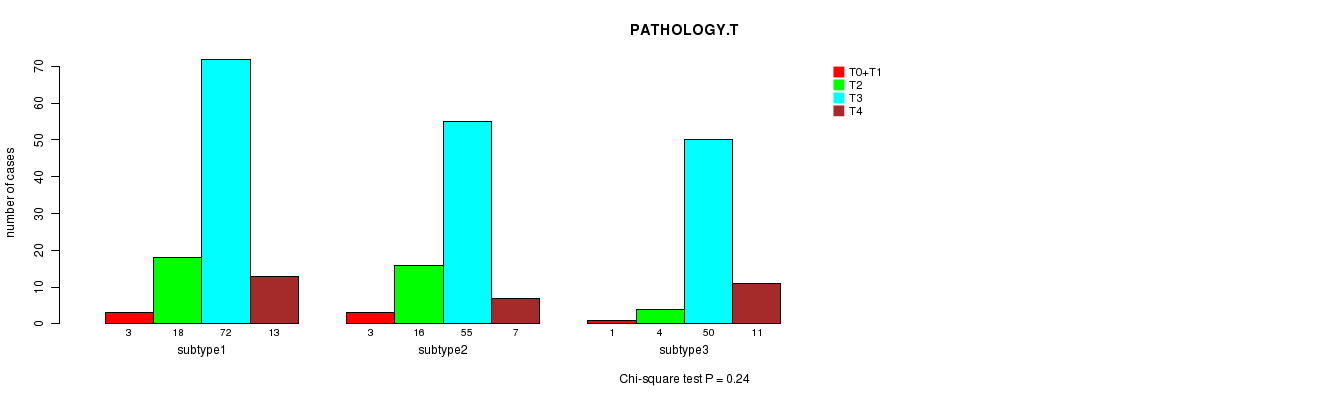
P value = 0.24 (Chi-square test)
Table S35. Clustering Approach #4: 'METHLYATION CNMF' versus Clinical Feature #5: 'PATHOLOGY.T'
| nPatients | T0+T1 | T2 | T3 | T4 |
|---|---|---|---|---|
| ALL | 7 | 38 | 177 | 31 |
| subtype1 | 3 | 18 | 72 | 13 |
| subtype2 | 3 | 16 | 55 | 7 |
| subtype3 | 1 | 4 | 50 | 11 |
Figure S31. Get High-res Image Clustering Approach #4: 'METHLYATION CNMF' versus Clinical Feature #5: 'PATHOLOGY.T'
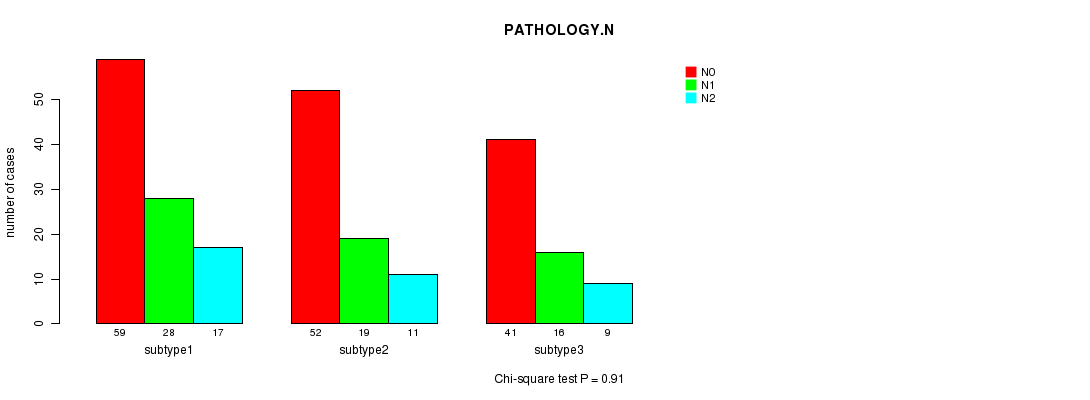
P value = 0.91 (Chi-square test)
Table S36. Clustering Approach #4: 'METHLYATION CNMF' versus Clinical Feature #6: 'PATHOLOGY.N'
| nPatients | N0 | N1 | N2 |
|---|---|---|---|
| ALL | 152 | 63 | 37 |
| subtype1 | 59 | 28 | 17 |
| subtype2 | 52 | 19 | 11 |
| subtype3 | 41 | 16 | 9 |
Figure S32. Get High-res Image Clustering Approach #4: 'METHLYATION CNMF' versus Clinical Feature #6: 'PATHOLOGY.N'
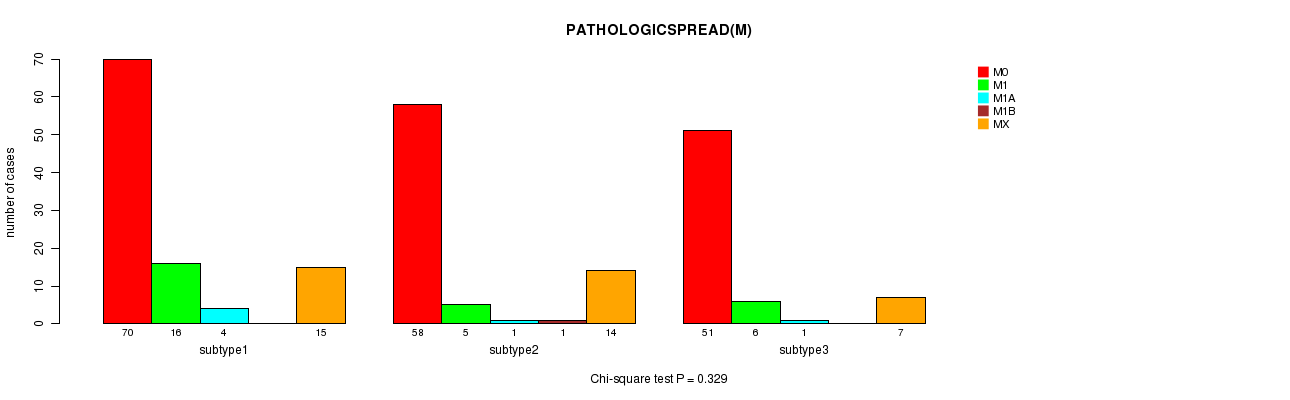
P value = 0.329 (Chi-square test)
Table S37. Clustering Approach #4: 'METHLYATION CNMF' versus Clinical Feature #7: 'PATHOLOGICSPREAD(M)'
| nPatients | M0 | M1 | M1A | M1B | MX |
|---|---|---|---|---|---|
| ALL | 179 | 27 | 6 | 1 | 36 |
| subtype1 | 70 | 16 | 4 | 0 | 15 |
| subtype2 | 58 | 5 | 1 | 1 | 14 |
| subtype3 | 51 | 6 | 1 | 0 | 7 |
Figure S33. Get High-res Image Clustering Approach #4: 'METHLYATION CNMF' versus Clinical Feature #7: 'PATHOLOGICSPREAD(M)'
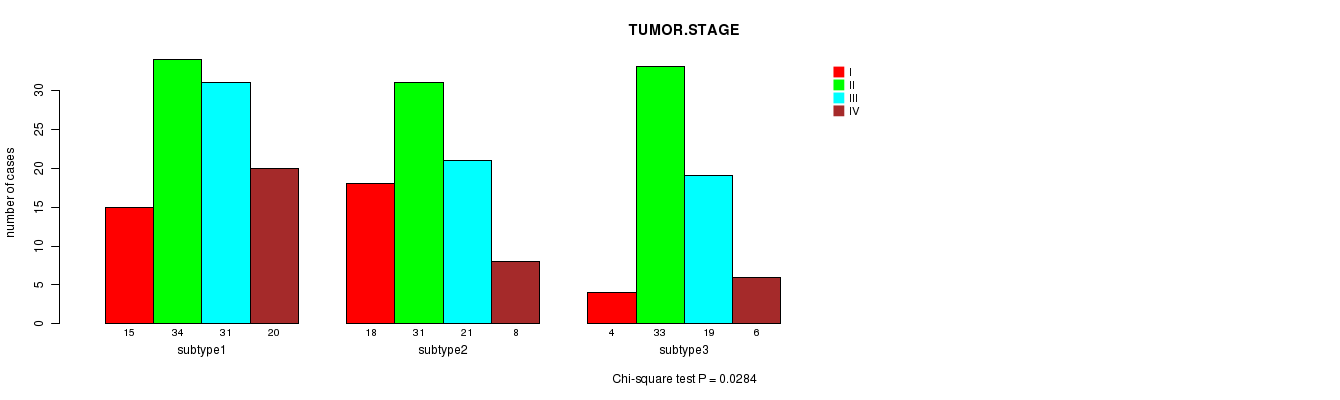
P value = 0.0284 (Chi-square test)
Table S38. Clustering Approach #4: 'METHLYATION CNMF' versus Clinical Feature #8: 'TUMOR.STAGE'
| nPatients | I | II | III | IV |
|---|---|---|---|---|
| ALL | 37 | 98 | 71 | 34 |
| subtype1 | 15 | 34 | 31 | 20 |
| subtype2 | 18 | 31 | 21 | 8 |
| subtype3 | 4 | 33 | 19 | 6 |
Figure S34. Get High-res Image Clustering Approach #4: 'METHLYATION CNMF' versus Clinical Feature #8: 'TUMOR.STAGE'
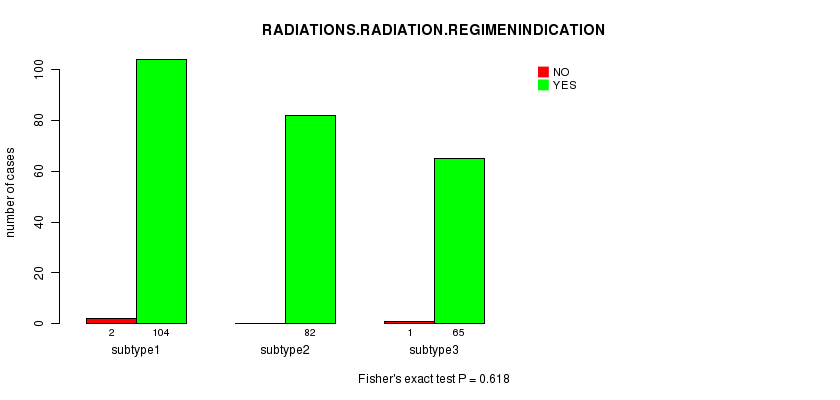
P value = 0.618 (Fisher's exact test)
Table S39. Clustering Approach #4: 'METHLYATION CNMF' versus Clinical Feature #9: 'RADIATIONS.RADIATION.REGIMENINDICATION'
| nPatients | NO | YES |
|---|---|---|
| ALL | 3 | 251 |
| subtype1 | 2 | 104 |
| subtype2 | 0 | 82 |
| subtype3 | 1 | 65 |
Figure S35. Get High-res Image Clustering Approach #4: 'METHLYATION CNMF' versus Clinical Feature #9: 'RADIATIONS.RADIATION.REGIMENINDICATION'
P value = 0.78 (Fisher's exact test)
Table S40. Clustering Approach #4: 'METHLYATION CNMF' versus Clinical Feature #10: 'NEOADJUVANT.THERAPY'
| nPatients | NO | YES |
|---|---|---|
| ALL | 51 | 203 |
| subtype1 | 19 | 87 |
| subtype2 | 18 | 64 |
| subtype3 | 14 | 52 |
Figure S36. Get High-res Image Clustering Approach #4: 'METHLYATION CNMF' versus Clinical Feature #10: 'NEOADJUVANT.THERAPY'
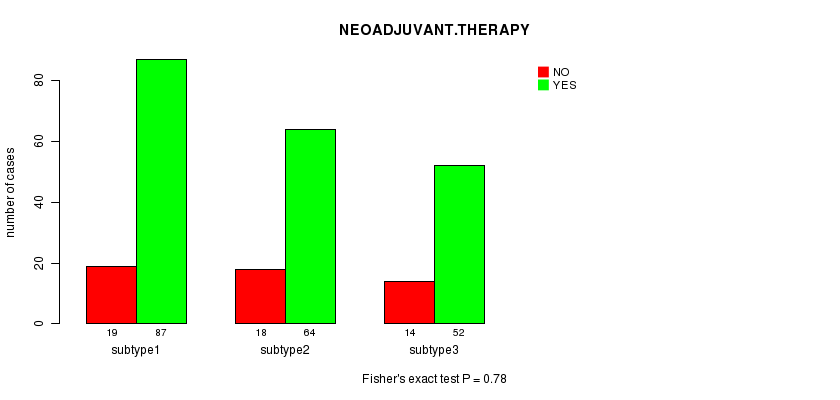
Table S41. Get Full Table Description of clustering approach #5: 'RPPA CNMF subtypes'
| Cluster Labels | 1 | 2 | 3 | 4 |
|---|---|---|---|---|
| Number of samples | 65 | 119 | 7 | 78 |
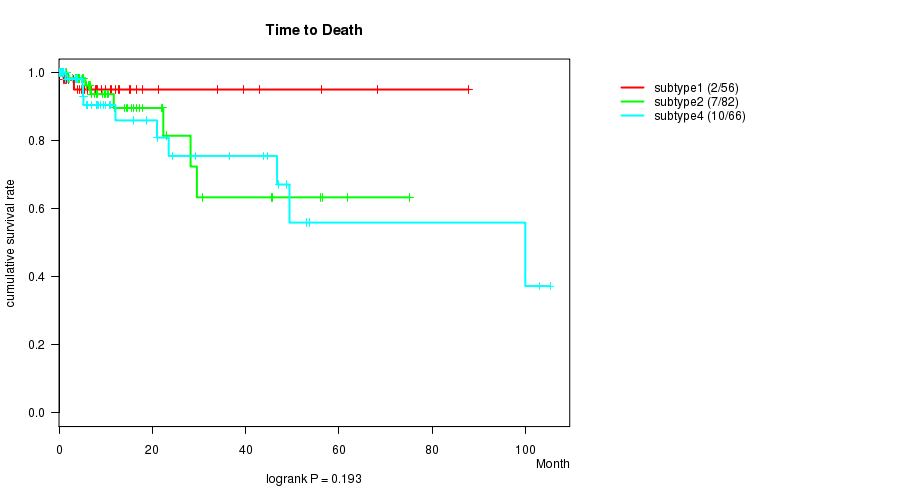
P value = 0.193 (logrank test)
Table S42. Clustering Approach #5: 'RPPA CNMF subtypes' versus Clinical Feature #1: 'Time to Death'
| nPatients | nDeath | Duration Range (Median), Month | |
|---|---|---|---|
| ALL | 206 | 19 | 0.1 - 105.3 (6.0) |
| subtype1 | 56 | 2 | 0.1 - 87.8 (5.2) |
| subtype2 | 82 | 7 | 0.1 - 75.2 (6.5) |
| subtype3 | 2 | 0 | 0.6 - 18.1 (9.4) |
| subtype4 | 66 | 10 | 0.1 - 105.3 (6.0) |
Figure S37. Get High-res Image Clustering Approach #5: 'RPPA CNMF subtypes' versus Clinical Feature #1: 'Time to Death'
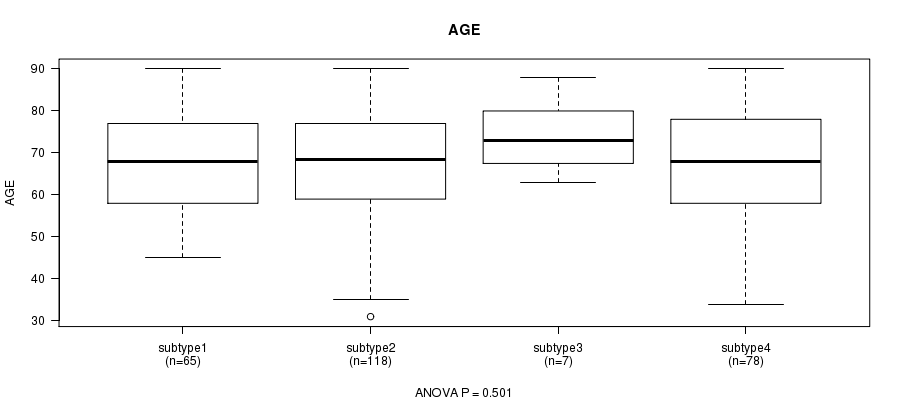
P value = 0.501 (ANOVA)
Table S43. Clustering Approach #5: 'RPPA CNMF subtypes' versus Clinical Feature #2: 'AGE'
| nPatients | Mean (Std.Dev) | |
|---|---|---|
| ALL | 268 | 66.6 (13.3) |
| subtype1 | 65 | 66.7 (12.0) |
| subtype2 | 118 | 66.2 (13.4) |
| subtype3 | 7 | 74.1 (9.4) |
| subtype4 | 78 | 66.3 (14.6) |
Figure S38. Get High-res Image Clustering Approach #5: 'RPPA CNMF subtypes' versus Clinical Feature #2: 'AGE'
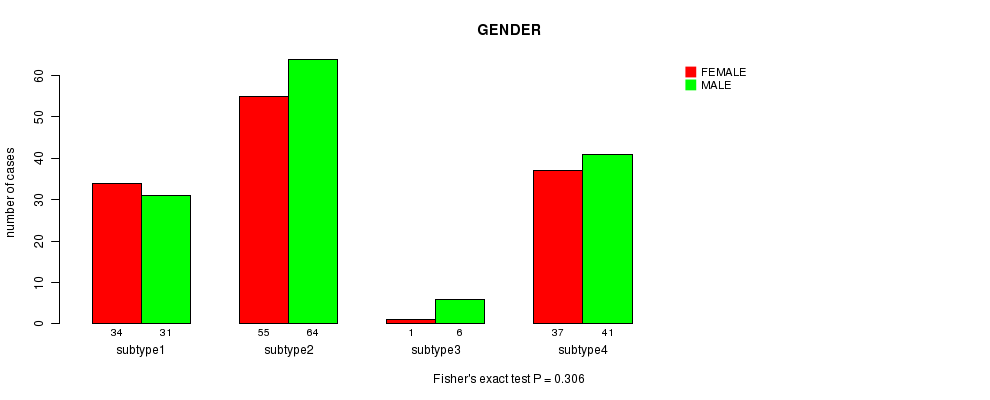
P value = 0.306 (Fisher's exact test)
Table S44. Clustering Approach #5: 'RPPA CNMF subtypes' versus Clinical Feature #3: 'GENDER'
| nPatients | FEMALE | MALE |
|---|---|---|
| ALL | 127 | 142 |
| subtype1 | 34 | 31 |
| subtype2 | 55 | 64 |
| subtype3 | 1 | 6 |
| subtype4 | 37 | 41 |
Figure S39. Get High-res Image Clustering Approach #5: 'RPPA CNMF subtypes' versus Clinical Feature #3: 'GENDER'
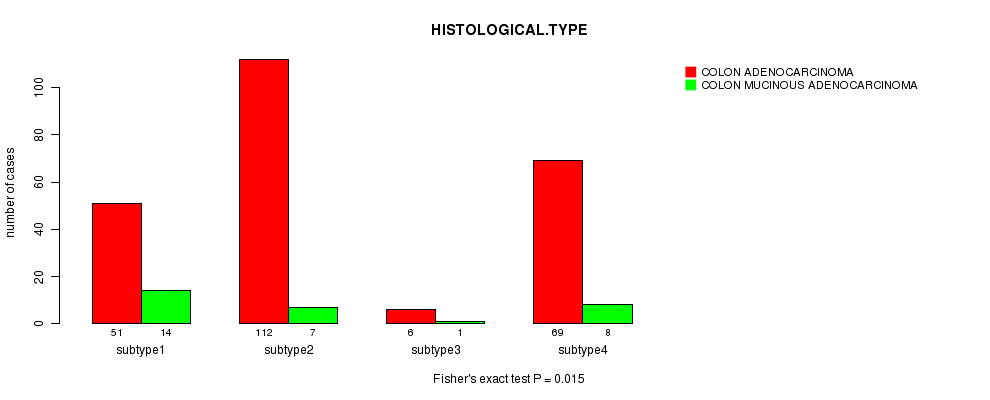
P value = 0.015 (Fisher's exact test)
Table S45. Clustering Approach #5: 'RPPA CNMF subtypes' versus Clinical Feature #4: 'HISTOLOGICAL.TYPE'
| nPatients | COLON ADENOCARCINOMA | COLON MUCINOUS ADENOCARCINOMA |
|---|---|---|
| ALL | 238 | 30 |
| subtype1 | 51 | 14 |
| subtype2 | 112 | 7 |
| subtype3 | 6 | 1 |
| subtype4 | 69 | 8 |
Figure S40. Get High-res Image Clustering Approach #5: 'RPPA CNMF subtypes' versus Clinical Feature #4: 'HISTOLOGICAL.TYPE'
P value = 0.23 (Chi-square test)
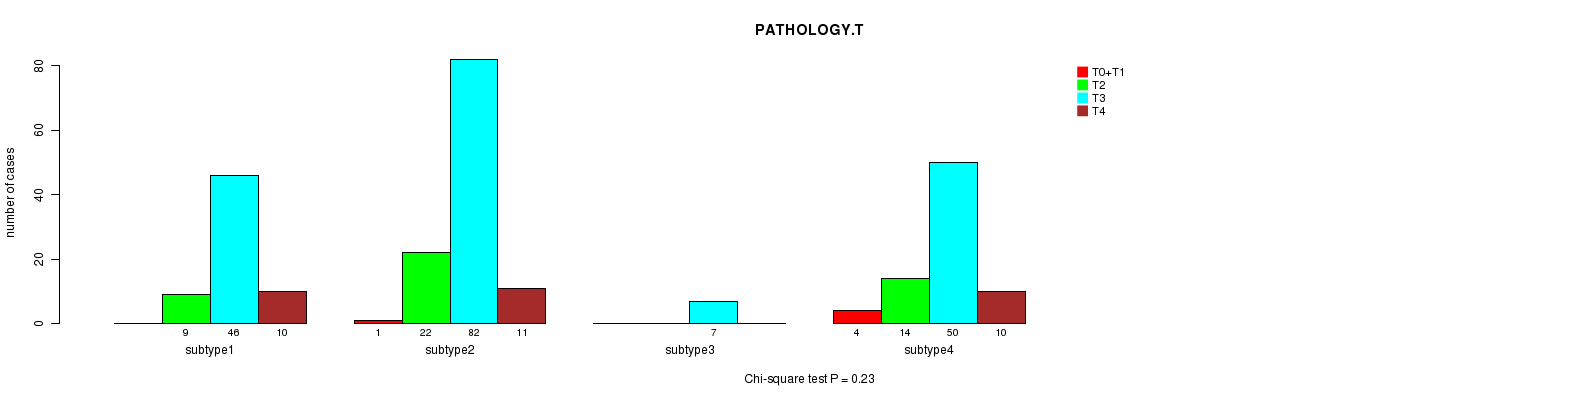
Table S46. Clustering Approach #5: 'RPPA CNMF subtypes' versus Clinical Feature #5: 'PATHOLOGY.T'
| nPatients | T0+T1 | T2 | T3 | T4 |
|---|---|---|---|---|
| ALL | 5 | 45 | 185 | 31 |
| subtype1 | 0 | 9 | 46 | 10 |
| subtype2 | 1 | 22 | 82 | 11 |
| subtype3 | 0 | 0 | 7 | 0 |
| subtype4 | 4 | 14 | 50 | 10 |
Figure S41. Get High-res Image Clustering Approach #5: 'RPPA CNMF subtypes' versus Clinical Feature #5: 'PATHOLOGY.T'
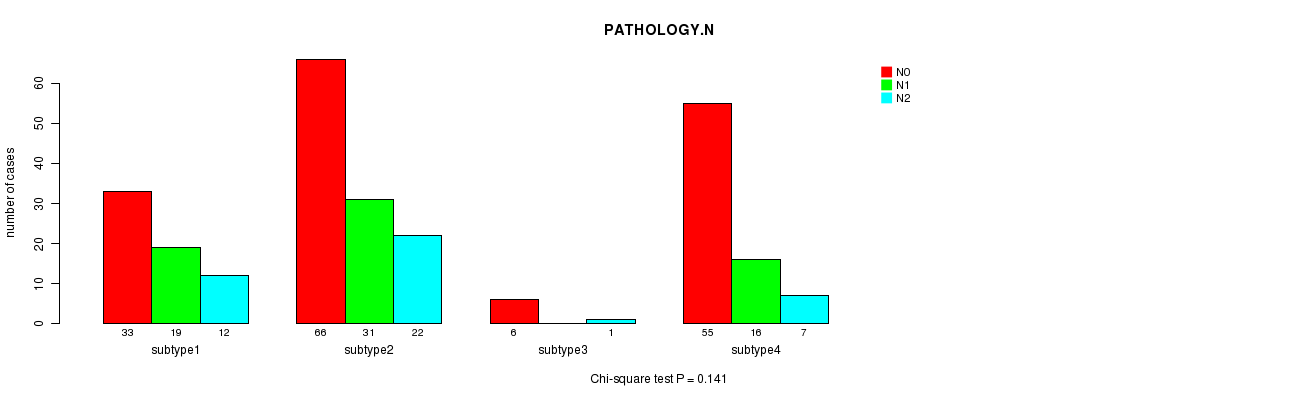
P value = 0.141 (Chi-square test)
Table S47. Clustering Approach #5: 'RPPA CNMF subtypes' versus Clinical Feature #6: 'PATHOLOGY.N'
| nPatients | N0 | N1 | N2 |
|---|---|---|---|
| ALL | 160 | 66 | 42 |
| subtype1 | 33 | 19 | 12 |
| subtype2 | 66 | 31 | 22 |
| subtype3 | 6 | 0 | 1 |
| subtype4 | 55 | 16 | 7 |
Figure S42. Get High-res Image Clustering Approach #5: 'RPPA CNMF subtypes' versus Clinical Feature #6: 'PATHOLOGY.N'
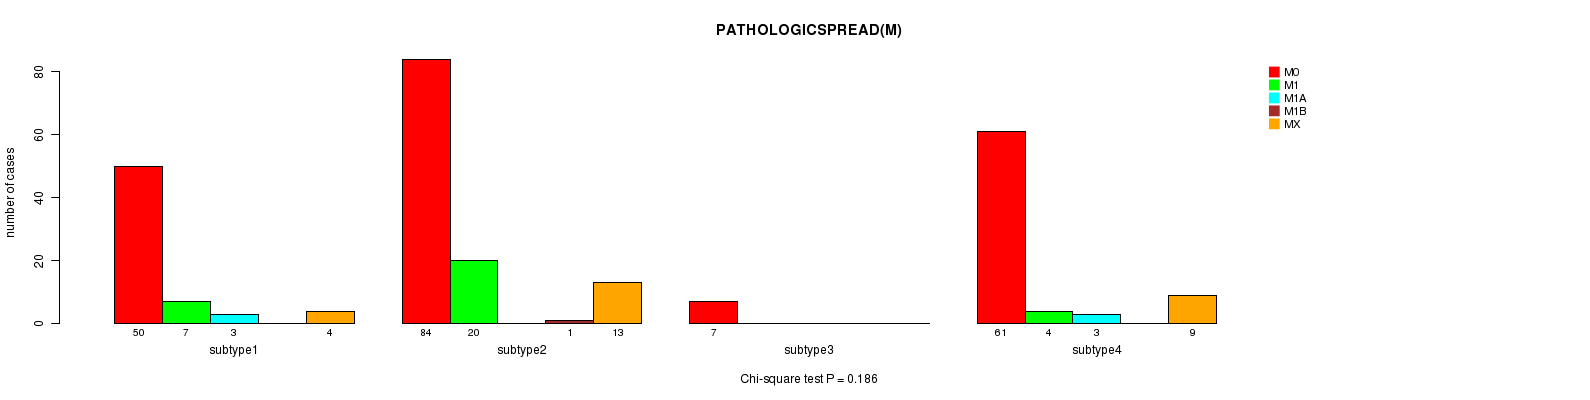
P value = 0.186 (Chi-square test)
Table S48. Clustering Approach #5: 'RPPA CNMF subtypes' versus Clinical Feature #7: 'PATHOLOGICSPREAD(M)'
| nPatients | M0 | M1 | M1A | M1B | MX |
|---|---|---|---|---|---|
| ALL | 202 | 31 | 6 | 1 | 26 |
| subtype1 | 50 | 7 | 3 | 0 | 4 |
| subtype2 | 84 | 20 | 0 | 1 | 13 |
| subtype3 | 7 | 0 | 0 | 0 | 0 |
| subtype4 | 61 | 4 | 3 | 0 | 9 |
Figure S43. Get High-res Image Clustering Approach #5: 'RPPA CNMF subtypes' versus Clinical Feature #7: 'PATHOLOGICSPREAD(M)'
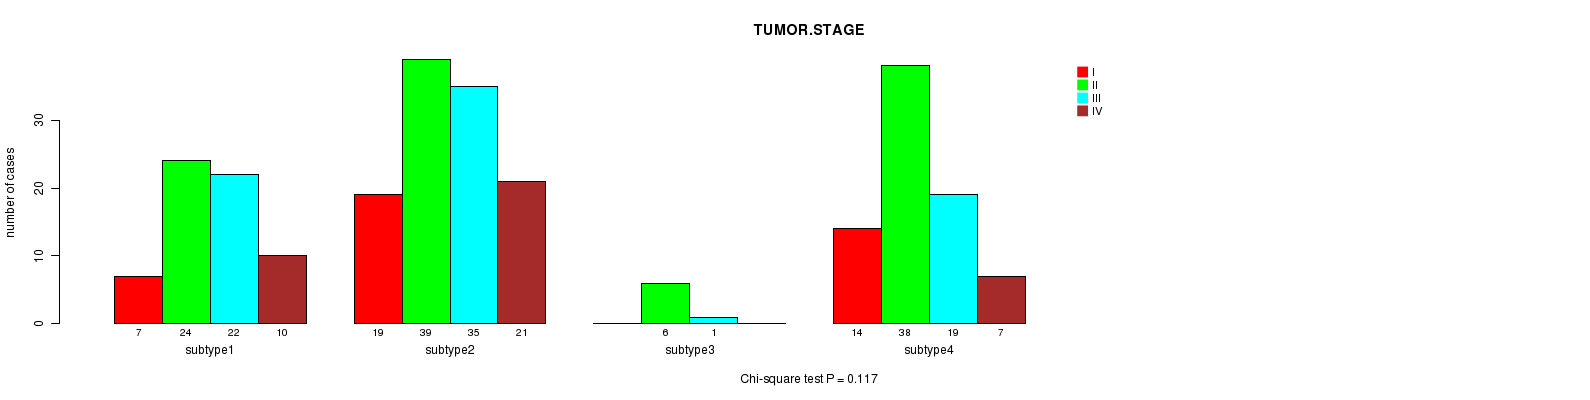
P value = 0.117 (Chi-square test)
Table S49. Clustering Approach #5: 'RPPA CNMF subtypes' versus Clinical Feature #8: 'TUMOR.STAGE'
| nPatients | I | II | III | IV |
|---|---|---|---|---|
| ALL | 40 | 107 | 77 | 38 |
| subtype1 | 7 | 24 | 22 | 10 |
| subtype2 | 19 | 39 | 35 | 21 |
| subtype3 | 0 | 6 | 1 | 0 |
| subtype4 | 14 | 38 | 19 | 7 |
Figure S44. Get High-res Image Clustering Approach #5: 'RPPA CNMF subtypes' versus Clinical Feature #8: 'TUMOR.STAGE'
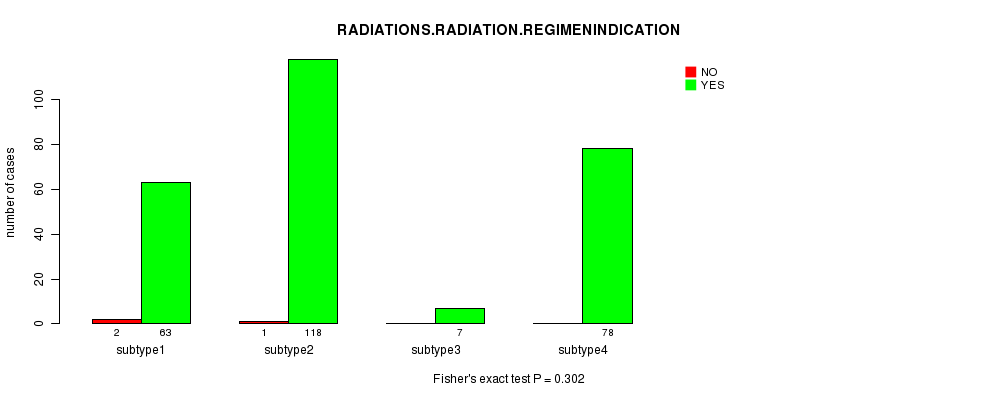
P value = 0.302 (Fisher's exact test)
Table S50. Clustering Approach #5: 'RPPA CNMF subtypes' versus Clinical Feature #9: 'RADIATIONS.RADIATION.REGIMENINDICATION'
| nPatients | NO | YES |
|---|---|---|
| ALL | 3 | 266 |
| subtype1 | 2 | 63 |
| subtype2 | 1 | 118 |
| subtype3 | 0 | 7 |
| subtype4 | 0 | 78 |
Figure S45. Get High-res Image Clustering Approach #5: 'RPPA CNMF subtypes' versus Clinical Feature #9: 'RADIATIONS.RADIATION.REGIMENINDICATION'
P value = 0.172 (Fisher's exact test)
Table S51. Clustering Approach #5: 'RPPA CNMF subtypes' versus Clinical Feature #10: 'NEOADJUVANT.THERAPY'
| nPatients | NO | YES |
|---|---|---|
| ALL | 51 | 218 |
| subtype1 | 18 | 47 |
| subtype2 | 20 | 99 |
| subtype3 | 0 | 7 |
| subtype4 | 13 | 65 |
Figure S46. Get High-res Image Clustering Approach #5: 'RPPA CNMF subtypes' versus Clinical Feature #10: 'NEOADJUVANT.THERAPY'
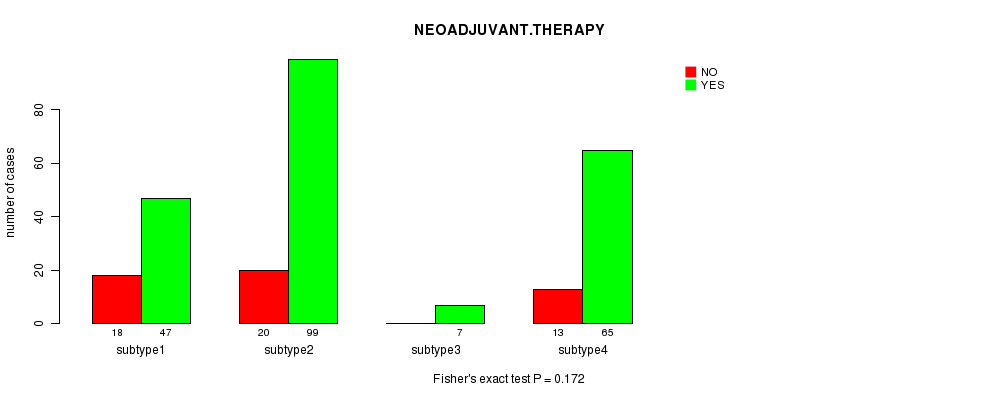
Table S52. Get Full Table Description of clustering approach #6: 'RPPA cHierClus subtypes'
| Cluster Labels | 1 | 2 | 3 | 4 |
|---|---|---|---|---|
| Number of samples | 143 | 25 | 49 | 52 |
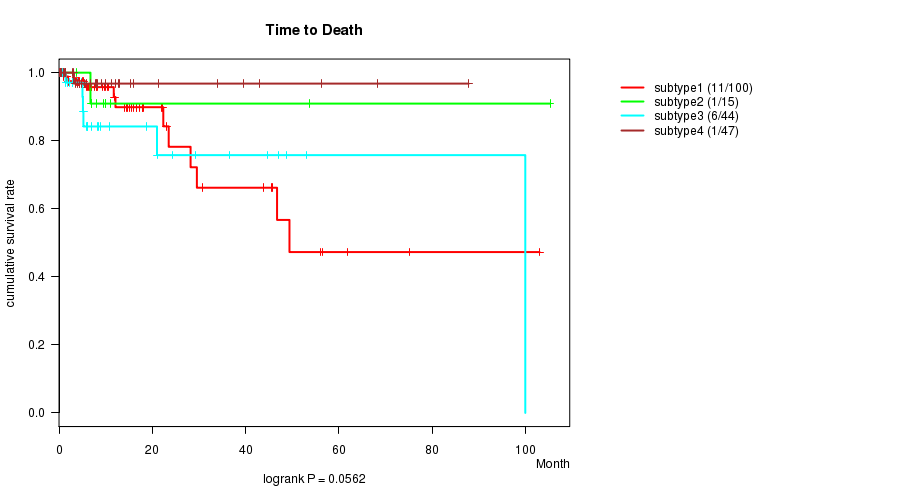
P value = 0.0562 (logrank test)
Table S53. Clustering Approach #6: 'RPPA cHierClus subtypes' versus Clinical Feature #1: 'Time to Death'
| nPatients | nDeath | Duration Range (Median), Month | |
|---|---|---|---|
| ALL | 206 | 19 | 0.1 - 105.3 (6.0) |
| subtype1 | 100 | 11 | 0.1 - 103.0 (6.6) |
| subtype2 | 15 | 1 | 0.1 - 105.3 (8.0) |
| subtype3 | 44 | 6 | 0.1 - 100.0 (5.1) |
| subtype4 | 47 | 1 | 0.1 - 87.8 (5.4) |
Figure S47. Get High-res Image Clustering Approach #6: 'RPPA cHierClus subtypes' versus Clinical Feature #1: 'Time to Death'
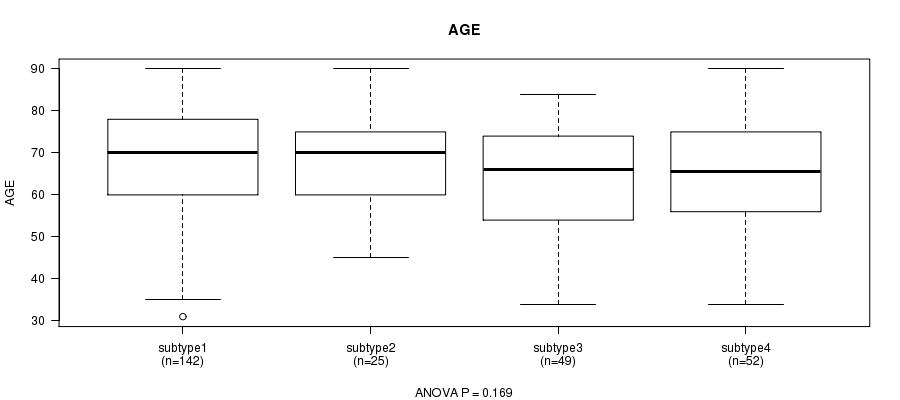
P value = 0.169 (ANOVA)
Table S54. Clustering Approach #6: 'RPPA cHierClus subtypes' versus Clinical Feature #2: 'AGE'
| nPatients | Mean (Std.Dev) | |
|---|---|---|
| ALL | 268 | 66.6 (13.3) |
| subtype1 | 142 | 68.0 (13.6) |
| subtype2 | 25 | 67.9 (12.0) |
| subtype3 | 49 | 63.9 (13.8) |
| subtype4 | 52 | 64.6 (12.6) |
Figure S48. Get High-res Image Clustering Approach #6: 'RPPA cHierClus subtypes' versus Clinical Feature #2: 'AGE'
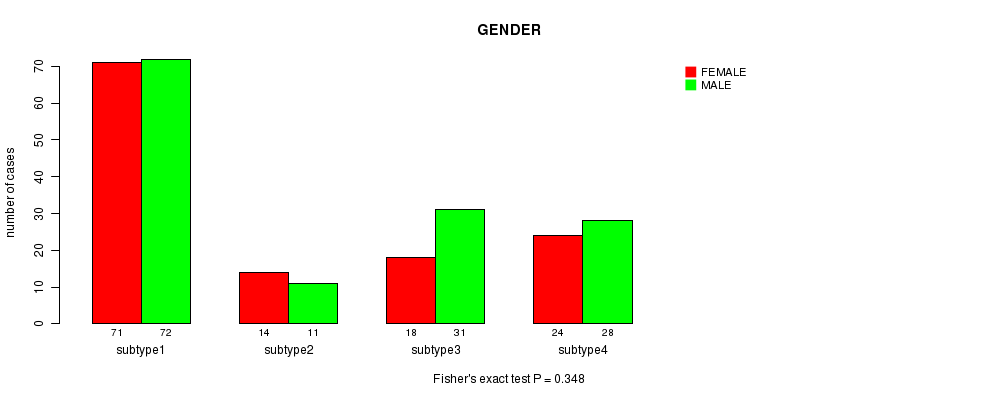
P value = 0.348 (Fisher's exact test)
Table S55. Clustering Approach #6: 'RPPA cHierClus subtypes' versus Clinical Feature #3: 'GENDER'
| nPatients | FEMALE | MALE |
|---|---|---|
| ALL | 127 | 142 |
| subtype1 | 71 | 72 |
| subtype2 | 14 | 11 |
| subtype3 | 18 | 31 |
| subtype4 | 24 | 28 |
Figure S49. Get High-res Image Clustering Approach #6: 'RPPA cHierClus subtypes' versus Clinical Feature #3: 'GENDER'
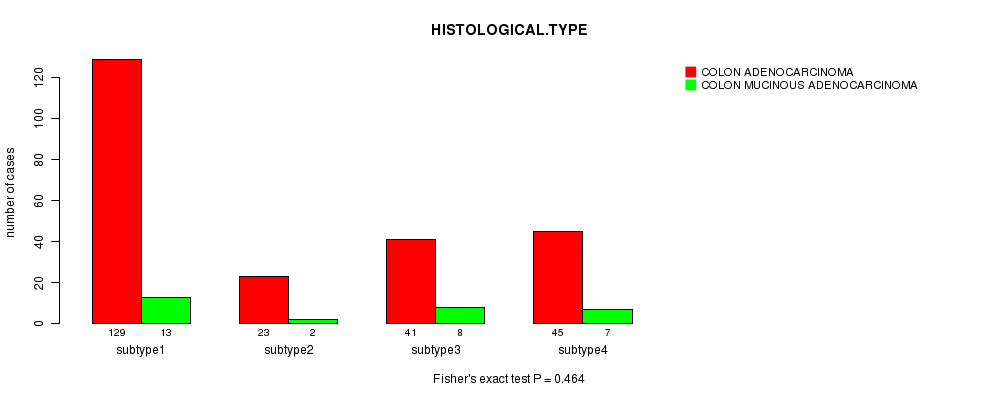
P value = 0.464 (Fisher's exact test)
Table S56. Clustering Approach #6: 'RPPA cHierClus subtypes' versus Clinical Feature #4: 'HISTOLOGICAL.TYPE'
| nPatients | COLON ADENOCARCINOMA | COLON MUCINOUS ADENOCARCINOMA |
|---|---|---|
| ALL | 238 | 30 |
| subtype1 | 129 | 13 |
| subtype2 | 23 | 2 |
| subtype3 | 41 | 8 |
| subtype4 | 45 | 7 |
Figure S50. Get High-res Image Clustering Approach #6: 'RPPA cHierClus subtypes' versus Clinical Feature #4: 'HISTOLOGICAL.TYPE'
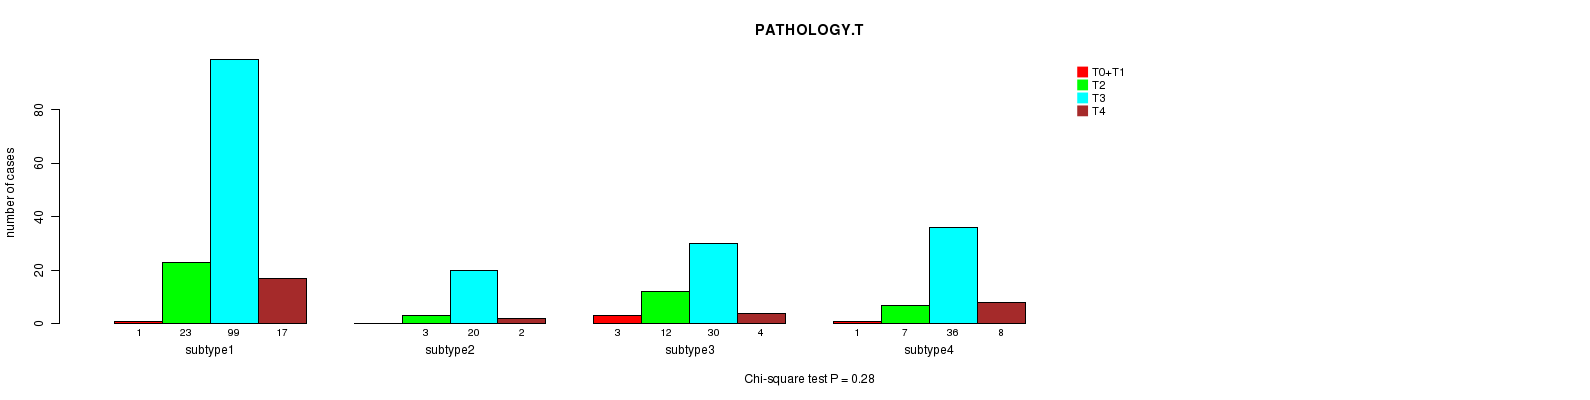
P value = 0.28 (Chi-square test)
Table S57. Clustering Approach #6: 'RPPA cHierClus subtypes' versus Clinical Feature #5: 'PATHOLOGY.T'
| nPatients | T0+T1 | T2 | T3 | T4 |
|---|---|---|---|---|
| ALL | 5 | 45 | 185 | 31 |
| subtype1 | 1 | 23 | 99 | 17 |
| subtype2 | 0 | 3 | 20 | 2 |
| subtype3 | 3 | 12 | 30 | 4 |
| subtype4 | 1 | 7 | 36 | 8 |
Figure S51. Get High-res Image Clustering Approach #6: 'RPPA cHierClus subtypes' versus Clinical Feature #5: 'PATHOLOGY.T'
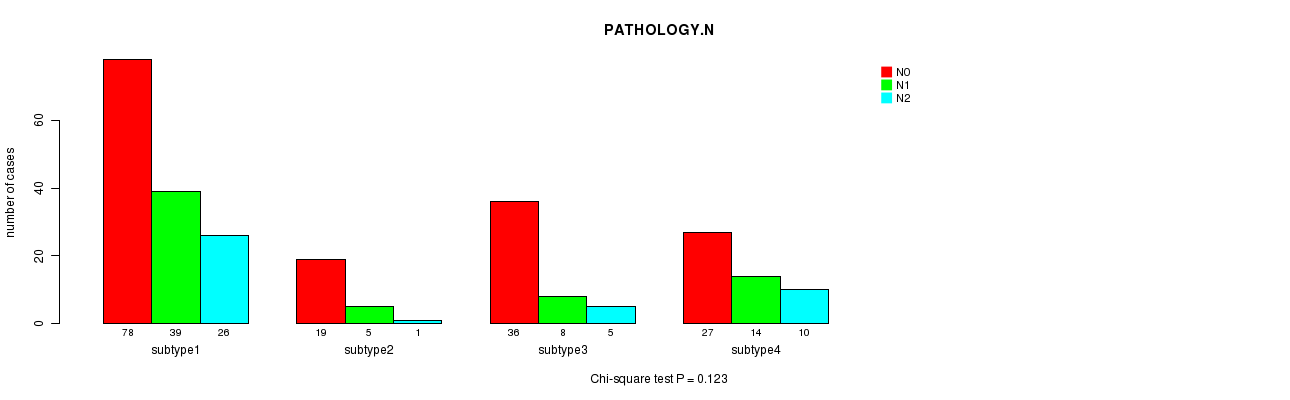
P value = 0.123 (Chi-square test)
Table S58. Clustering Approach #6: 'RPPA cHierClus subtypes' versus Clinical Feature #6: 'PATHOLOGY.N'
| nPatients | N0 | N1 | N2 |
|---|---|---|---|
| ALL | 160 | 66 | 42 |
| subtype1 | 78 | 39 | 26 |
| subtype2 | 19 | 5 | 1 |
| subtype3 | 36 | 8 | 5 |
| subtype4 | 27 | 14 | 10 |
Figure S52. Get High-res Image Clustering Approach #6: 'RPPA cHierClus subtypes' versus Clinical Feature #6: 'PATHOLOGY.N'
P value = 0.0432 (Chi-square test)
Table S59. Clustering Approach #6: 'RPPA cHierClus subtypes' versus Clinical Feature #7: 'PATHOLOGICSPREAD(M)'
| nPatients | M0 | M1 | M1A | M1B | MX |
|---|---|---|---|---|---|
| ALL | 202 | 31 | 6 | 1 | 26 |
| subtype1 | 103 | 22 | 0 | 1 | 17 |
| subtype2 | 22 | 0 | 0 | 0 | 1 |
| subtype3 | 39 | 2 | 3 | 0 | 5 |
| subtype4 | 38 | 7 | 3 | 0 | 3 |
Figure S53. Get High-res Image Clustering Approach #6: 'RPPA cHierClus subtypes' versus Clinical Feature #7: 'PATHOLOGICSPREAD(M)'
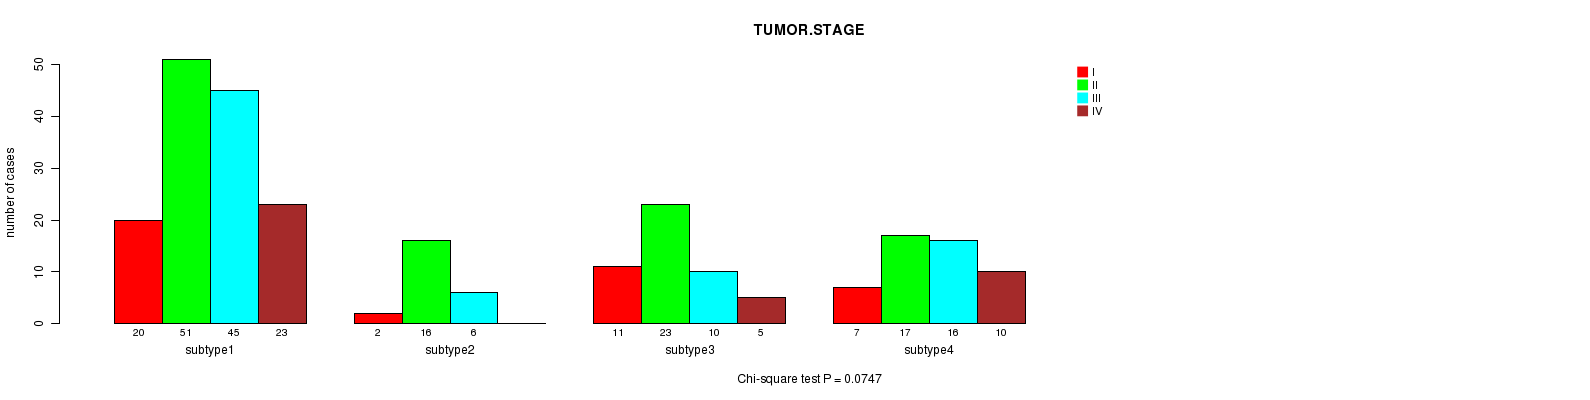
P value = 0.0747 (Chi-square test)
Table S60. Clustering Approach #6: 'RPPA cHierClus subtypes' versus Clinical Feature #8: 'TUMOR.STAGE'
| nPatients | I | II | III | IV |
|---|---|---|---|---|
| ALL | 40 | 107 | 77 | 38 |
| subtype1 | 20 | 51 | 45 | 23 |
| subtype2 | 2 | 16 | 6 | 0 |
| subtype3 | 11 | 23 | 10 | 5 |
| subtype4 | 7 | 17 | 16 | 10 |
Figure S54. Get High-res Image Clustering Approach #6: 'RPPA cHierClus subtypes' versus Clinical Feature #8: 'TUMOR.STAGE'
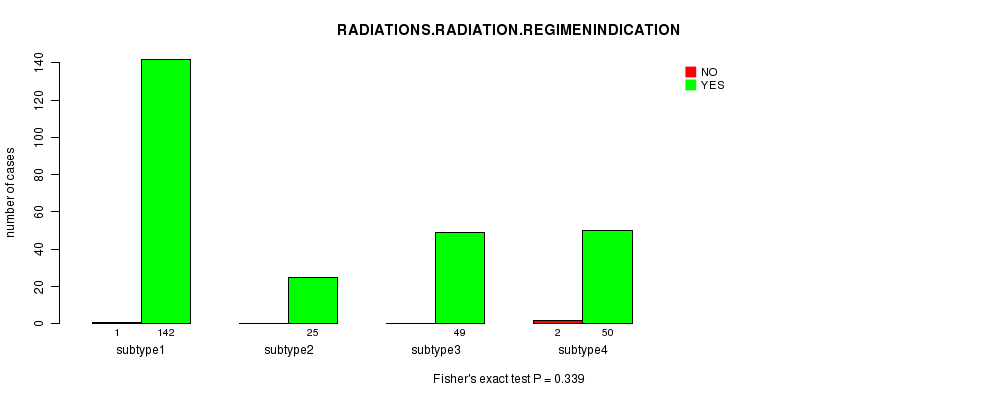
P value = 0.339 (Fisher's exact test)
Table S61. Clustering Approach #6: 'RPPA cHierClus subtypes' versus Clinical Feature #9: 'RADIATIONS.RADIATION.REGIMENINDICATION'
| nPatients | NO | YES |
|---|---|---|
| ALL | 3 | 266 |
| subtype1 | 1 | 142 |
| subtype2 | 0 | 25 |
| subtype3 | 0 | 49 |
| subtype4 | 2 | 50 |
Figure S55. Get High-res Image Clustering Approach #6: 'RPPA cHierClus subtypes' versus Clinical Feature #9: 'RADIATIONS.RADIATION.REGIMENINDICATION'
P value = 0.387 (Fisher's exact test)
Table S62. Clustering Approach #6: 'RPPA cHierClus subtypes' versus Clinical Feature #10: 'NEOADJUVANT.THERAPY'
| nPatients | NO | YES |
|---|---|---|
| ALL | 51 | 218 |
| subtype1 | 23 | 120 |
| subtype2 | 5 | 20 |
| subtype3 | 9 | 40 |
| subtype4 | 14 | 38 |
Figure S56. Get High-res Image Clustering Approach #6: 'RPPA cHierClus subtypes' versus Clinical Feature #10: 'NEOADJUVANT.THERAPY'
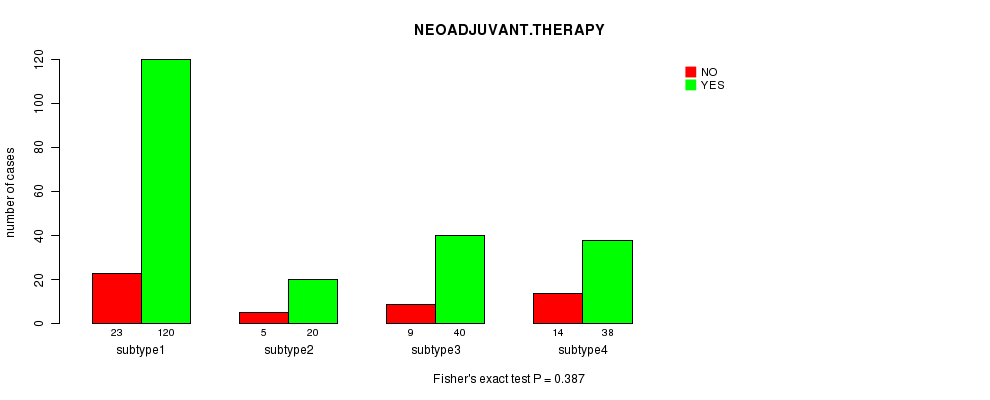
Table S63. Get Full Table Description of clustering approach #7: 'MIRseq CNMF subtypes'
| Cluster Labels | 1 | 2 | 3 |
|---|---|---|---|
| Number of samples | 156 | 46 | 176 |
P value = 0.0619 (logrank test)
Table S64. Clustering Approach #7: 'MIRseq CNMF subtypes' versus Clinical Feature #1: 'Time to Death'
| nPatients | nDeath | Duration Range (Median), Month | |
|---|---|---|---|
| ALL | 280 | 49 | 0.1 - 135.5 (8.1) |
| subtype1 | 144 | 25 | 0.1 - 135.5 (9.6) |
| subtype2 | 43 | 9 | 0.1 - 100.0 (5.2) |
| subtype3 | 93 | 15 | 0.9 - 71.7 (8.1) |
Figure S57. Get High-res Image Clustering Approach #7: 'MIRseq CNMF subtypes' versus Clinical Feature #1: 'Time to Death'
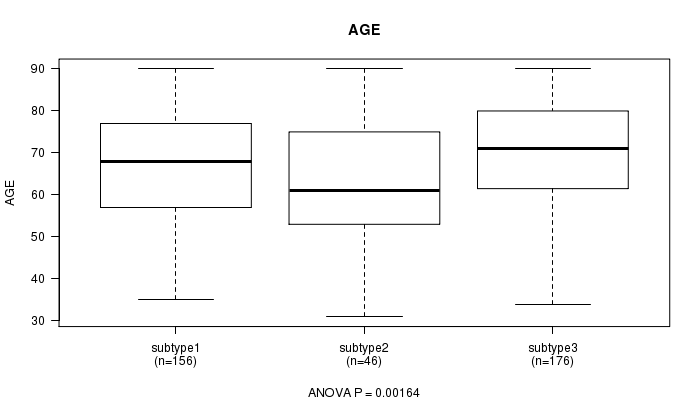
P value = 0.00164 (ANOVA)
Table S65. Clustering Approach #7: 'MIRseq CNMF subtypes' versus Clinical Feature #2: 'AGE'
| nPatients | Mean (Std.Dev) | |
|---|---|---|
| ALL | 378 | 67.4 (13.1) |
| subtype1 | 156 | 66.1 (12.9) |
| subtype2 | 46 | 62.8 (14.0) |
| subtype3 | 176 | 69.7 (12.6) |
Figure S58. Get High-res Image Clustering Approach #7: 'MIRseq CNMF subtypes' versus Clinical Feature #2: 'AGE'
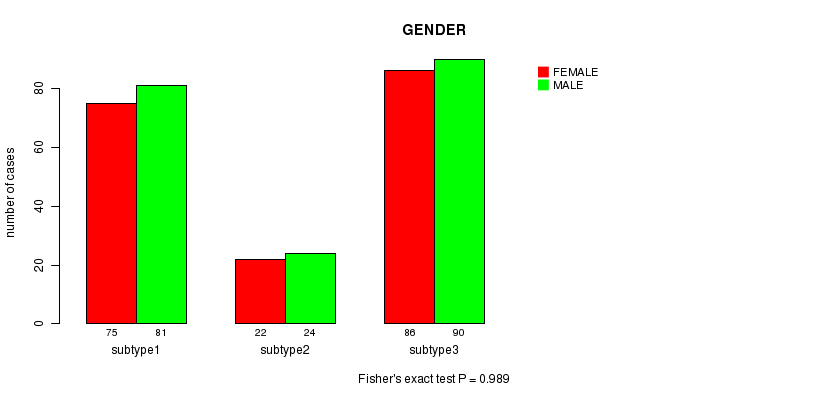
P value = 0.989 (Fisher's exact test)
Table S66. Clustering Approach #7: 'MIRseq CNMF subtypes' versus Clinical Feature #3: 'GENDER'
| nPatients | FEMALE | MALE |
|---|---|---|
| ALL | 183 | 195 |
| subtype1 | 75 | 81 |
| subtype2 | 22 | 24 |
| subtype3 | 86 | 90 |
Figure S59. Get High-res Image Clustering Approach #7: 'MIRseq CNMF subtypes' versus Clinical Feature #3: 'GENDER'
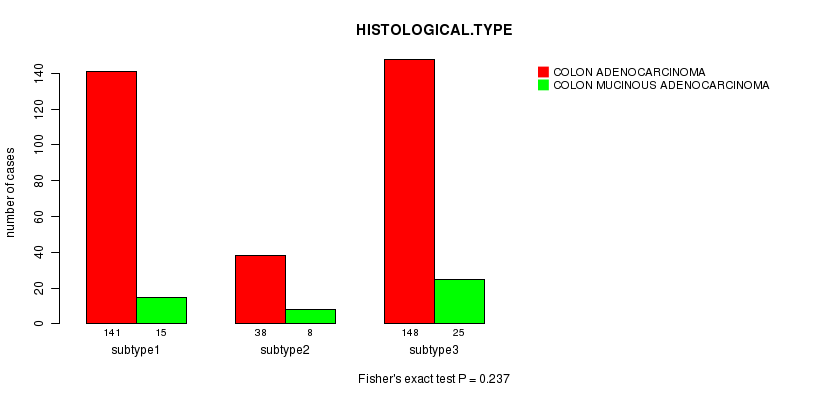
P value = 0.237 (Fisher's exact test)
Table S67. Clustering Approach #7: 'MIRseq CNMF subtypes' versus Clinical Feature #4: 'HISTOLOGICAL.TYPE'
| nPatients | COLON ADENOCARCINOMA | COLON MUCINOUS ADENOCARCINOMA |
|---|---|---|
| ALL | 327 | 48 |
| subtype1 | 141 | 15 |
| subtype2 | 38 | 8 |
| subtype3 | 148 | 25 |
Figure S60. Get High-res Image Clustering Approach #7: 'MIRseq CNMF subtypes' versus Clinical Feature #4: 'HISTOLOGICAL.TYPE'
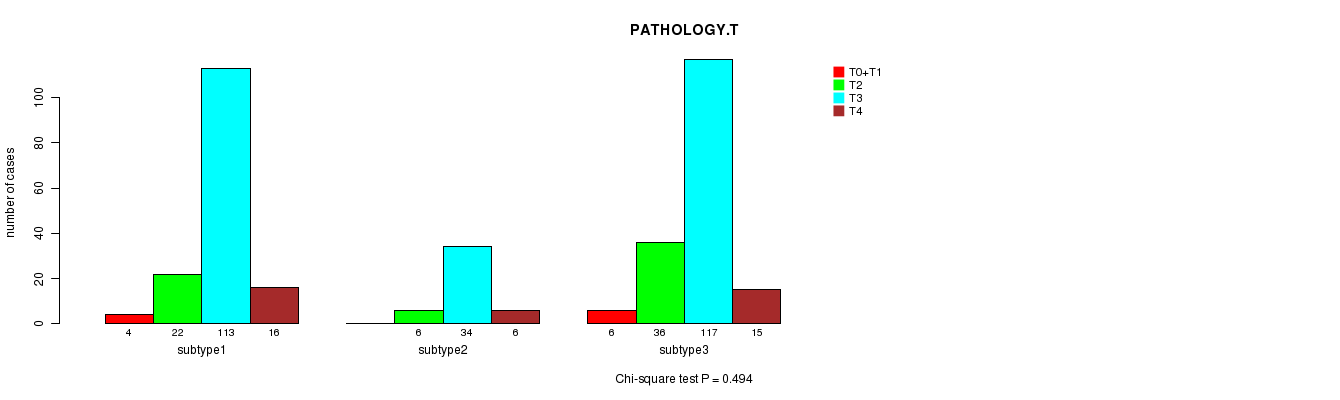
P value = 0.494 (Chi-square test)
Table S68. Clustering Approach #7: 'MIRseq CNMF subtypes' versus Clinical Feature #5: 'PATHOLOGY.T'
| nPatients | T0+T1 | T2 | T3 | T4 |
|---|---|---|---|---|
| ALL | 10 | 64 | 264 | 37 |
| subtype1 | 4 | 22 | 113 | 16 |
| subtype2 | 0 | 6 | 34 | 6 |
| subtype3 | 6 | 36 | 117 | 15 |
Figure S61. Get High-res Image Clustering Approach #7: 'MIRseq CNMF subtypes' versus Clinical Feature #5: 'PATHOLOGY.T'
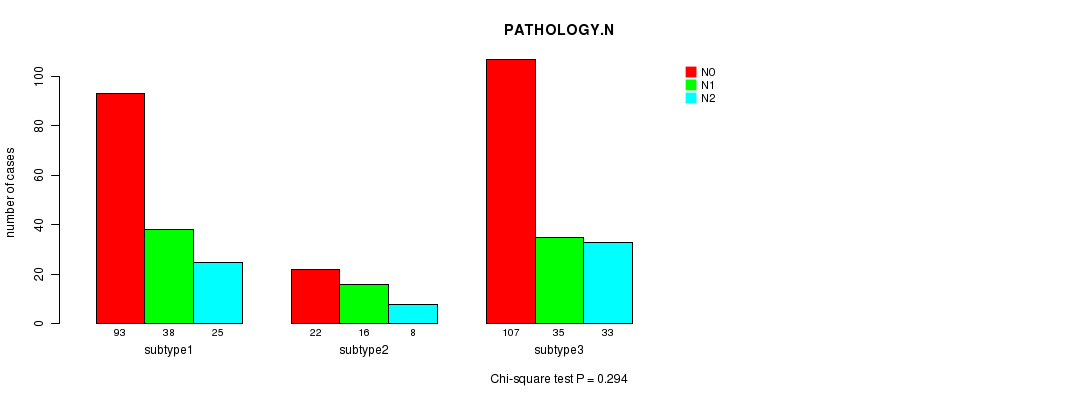
P value = 0.294 (Chi-square test)
Table S69. Clustering Approach #7: 'MIRseq CNMF subtypes' versus Clinical Feature #6: 'PATHOLOGY.N'
| nPatients | N0 | N1 | N2 |
|---|---|---|---|
| ALL | 222 | 89 | 66 |
| subtype1 | 93 | 38 | 25 |
| subtype2 | 22 | 16 | 8 |
| subtype3 | 107 | 35 | 33 |
Figure S62. Get High-res Image Clustering Approach #7: 'MIRseq CNMF subtypes' versus Clinical Feature #6: 'PATHOLOGY.N'
P value = 1.86e-05 (Chi-square test)
Table S70. Clustering Approach #7: 'MIRseq CNMF subtypes' versus Clinical Feature #7: 'PATHOLOGICSPREAD(M)'
| nPatients | M0 | M1 | M1A | M1B | MX |
|---|---|---|---|---|---|
| ALL | 286 | 49 | 7 | 1 | 28 |
| subtype1 | 109 | 14 | 5 | 1 | 24 |
| subtype2 | 34 | 7 | 1 | 0 | 4 |
| subtype3 | 143 | 28 | 1 | 0 | 0 |
Figure S63. Get High-res Image Clustering Approach #7: 'MIRseq CNMF subtypes' versus Clinical Feature #7: 'PATHOLOGICSPREAD(M)'
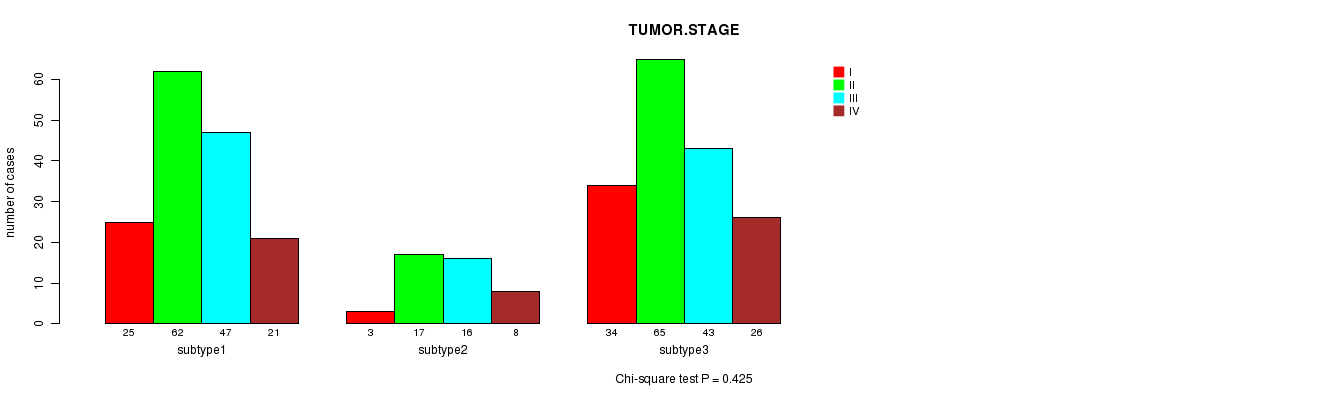
P value = 0.425 (Chi-square test)
Table S71. Clustering Approach #7: 'MIRseq CNMF subtypes' versus Clinical Feature #8: 'TUMOR.STAGE'
| nPatients | I | II | III | IV |
|---|---|---|---|---|
| ALL | 62 | 144 | 106 | 55 |
| subtype1 | 25 | 62 | 47 | 21 |
| subtype2 | 3 | 17 | 16 | 8 |
| subtype3 | 34 | 65 | 43 | 26 |
Figure S64. Get High-res Image Clustering Approach #7: 'MIRseq CNMF subtypes' versus Clinical Feature #8: 'TUMOR.STAGE'
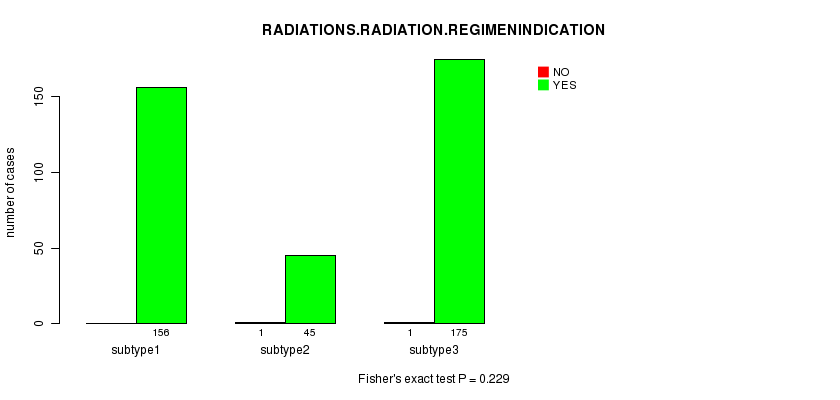
P value = 0.229 (Fisher's exact test)
Table S72. Clustering Approach #7: 'MIRseq CNMF subtypes' versus Clinical Feature #9: 'RADIATIONS.RADIATION.REGIMENINDICATION'
| nPatients | NO | YES |
|---|---|---|
| ALL | 2 | 376 |
| subtype1 | 0 | 156 |
| subtype2 | 1 | 45 |
| subtype3 | 1 | 175 |
Figure S65. Get High-res Image Clustering Approach #7: 'MIRseq CNMF subtypes' versus Clinical Feature #9: 'RADIATIONS.RADIATION.REGIMENINDICATION'
P value = 0.000649 (Fisher's exact test)
Table S73. Clustering Approach #7: 'MIRseq CNMF subtypes' versus Clinical Feature #10: 'NEOADJUVANT.THERAPY'
| nPatients | NO | YES |
|---|---|---|
| ALL | 55 | 323 |
| subtype1 | 32 | 124 |
| subtype2 | 10 | 36 |
| subtype3 | 13 | 163 |
Figure S66. Get High-res Image Clustering Approach #7: 'MIRseq CNMF subtypes' versus Clinical Feature #10: 'NEOADJUVANT.THERAPY'
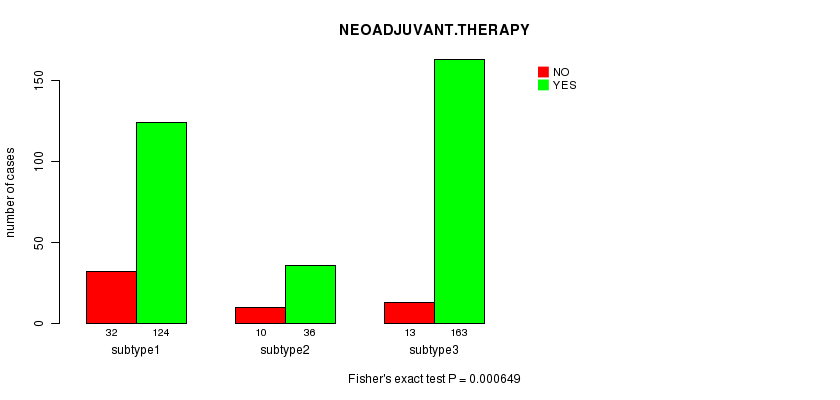
Table S74. Get Full Table Description of clustering approach #8: 'MIRseq cHierClus subtypes'
| Cluster Labels | 1 | 2 | 3 | 4 |
|---|---|---|---|---|
| Number of samples | 179 | 50 | 108 | 41 |
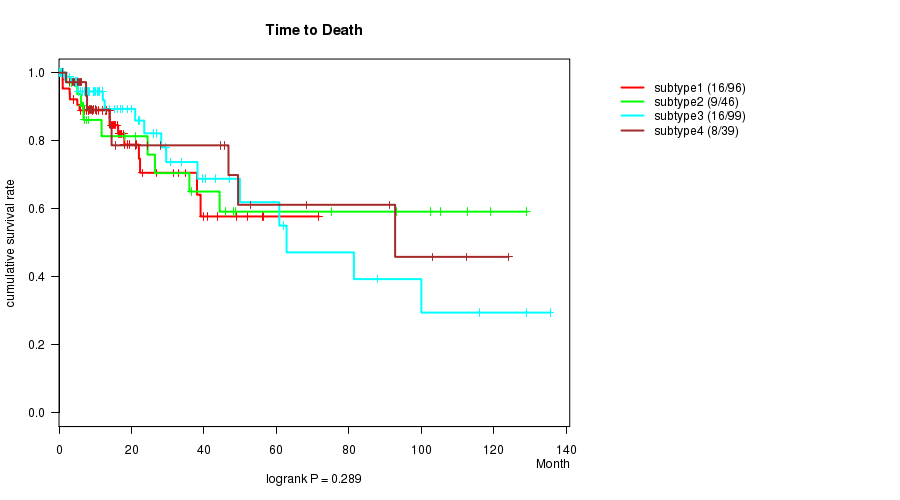
P value = 0.289 (logrank test)
Table S75. Clustering Approach #8: 'MIRseq cHierClus subtypes' versus Clinical Feature #1: 'Time to Death'
| nPatients | nDeath | Duration Range (Median), Month | |
|---|---|---|---|
| ALL | 280 | 49 | 0.1 - 135.5 (8.1) |
| subtype1 | 96 | 16 | 0.9 - 71.7 (8.6) |
| subtype2 | 46 | 9 | 0.1 - 129.1 (6.7) |
| subtype3 | 99 | 16 | 0.1 - 135.5 (9.4) |
| subtype4 | 39 | 8 | 0.9 - 124.1 (8.9) |
Figure S67. Get High-res Image Clustering Approach #8: 'MIRseq cHierClus subtypes' versus Clinical Feature #1: 'Time to Death'
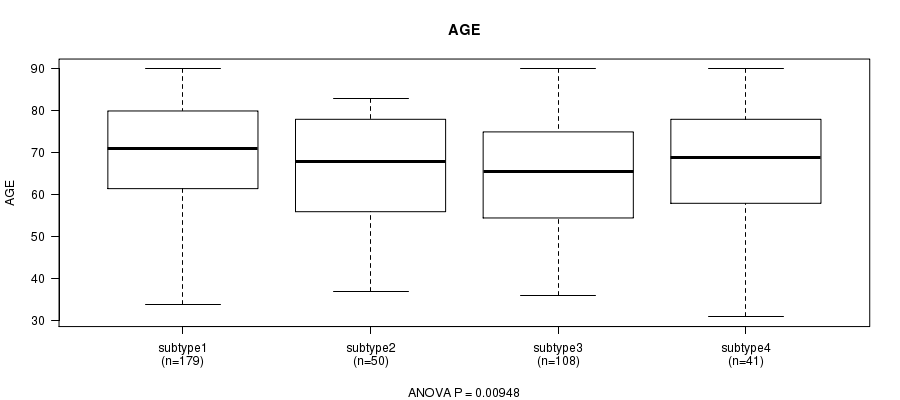
P value = 0.00948 (ANOVA)
Table S76. Clustering Approach #8: 'MIRseq cHierClus subtypes' versus Clinical Feature #2: 'AGE'
| nPatients | Mean (Std.Dev) | |
|---|---|---|
| ALL | 378 | 67.4 (13.1) |
| subtype1 | 179 | 69.6 (12.5) |
| subtype2 | 50 | 66.3 (12.1) |
| subtype3 | 108 | 64.3 (13.4) |
| subtype4 | 41 | 67.0 (14.4) |
Figure S68. Get High-res Image Clustering Approach #8: 'MIRseq cHierClus subtypes' versus Clinical Feature #2: 'AGE'
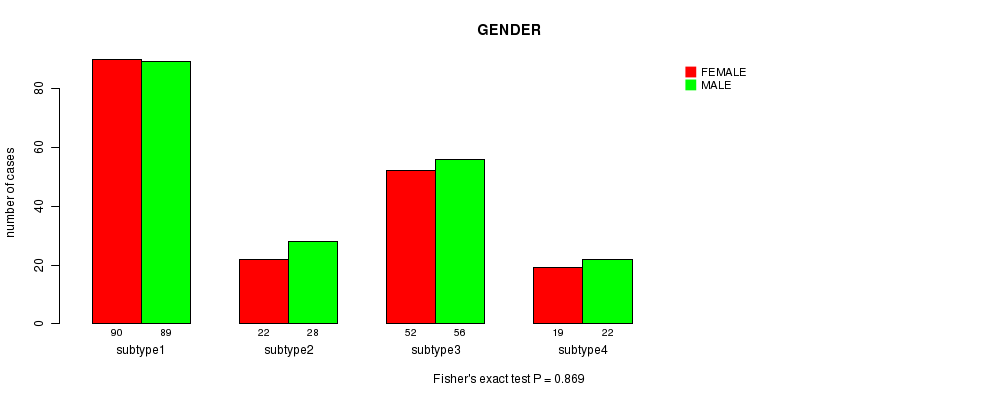
P value = 0.869 (Fisher's exact test)
Table S77. Clustering Approach #8: 'MIRseq cHierClus subtypes' versus Clinical Feature #3: 'GENDER'
| nPatients | FEMALE | MALE |
|---|---|---|
| ALL | 183 | 195 |
| subtype1 | 90 | 89 |
| subtype2 | 22 | 28 |
| subtype3 | 52 | 56 |
| subtype4 | 19 | 22 |
Figure S69. Get High-res Image Clustering Approach #8: 'MIRseq cHierClus subtypes' versus Clinical Feature #3: 'GENDER'
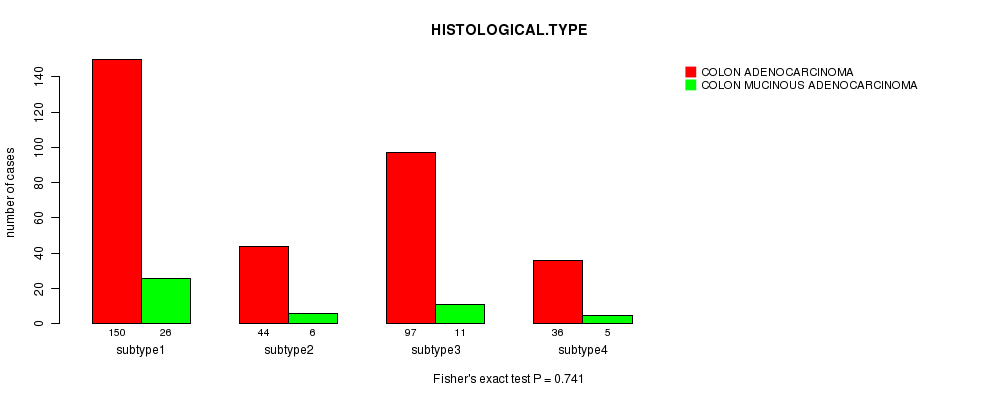
P value = 0.741 (Fisher's exact test)
Table S78. Clustering Approach #8: 'MIRseq cHierClus subtypes' versus Clinical Feature #4: 'HISTOLOGICAL.TYPE'
| nPatients | COLON ADENOCARCINOMA | COLON MUCINOUS ADENOCARCINOMA |
|---|---|---|
| ALL | 327 | 48 |
| subtype1 | 150 | 26 |
| subtype2 | 44 | 6 |
| subtype3 | 97 | 11 |
| subtype4 | 36 | 5 |
Figure S70. Get High-res Image Clustering Approach #8: 'MIRseq cHierClus subtypes' versus Clinical Feature #4: 'HISTOLOGICAL.TYPE'
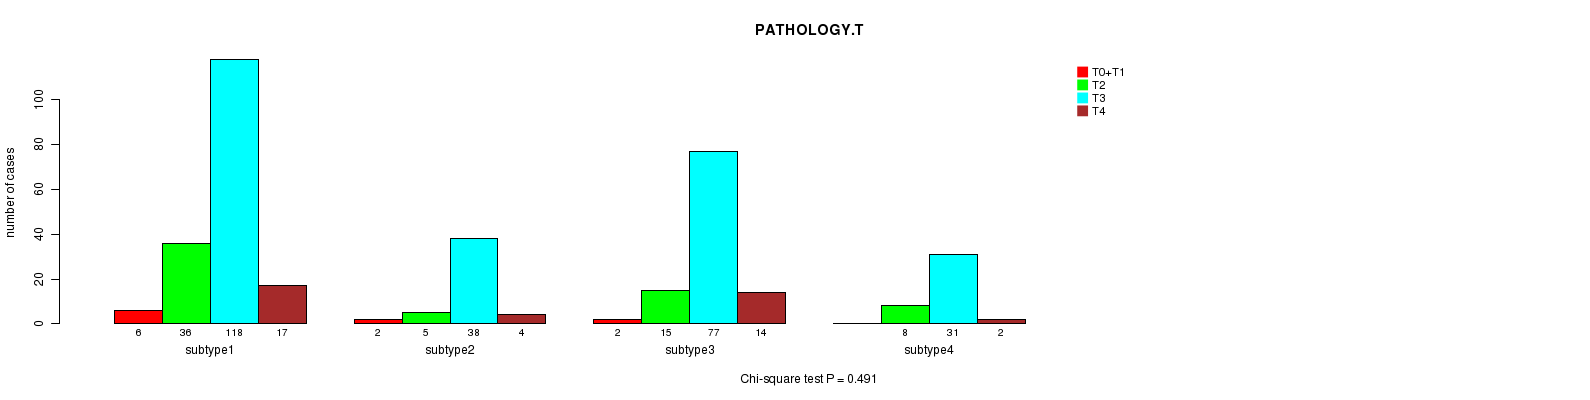
P value = 0.491 (Chi-square test)
Table S79. Clustering Approach #8: 'MIRseq cHierClus subtypes' versus Clinical Feature #5: 'PATHOLOGY.T'
| nPatients | T0+T1 | T2 | T3 | T4 |
|---|---|---|---|---|
| ALL | 10 | 64 | 264 | 37 |
| subtype1 | 6 | 36 | 118 | 17 |
| subtype2 | 2 | 5 | 38 | 4 |
| subtype3 | 2 | 15 | 77 | 14 |
| subtype4 | 0 | 8 | 31 | 2 |
Figure S71. Get High-res Image Clustering Approach #8: 'MIRseq cHierClus subtypes' versus Clinical Feature #5: 'PATHOLOGY.T'
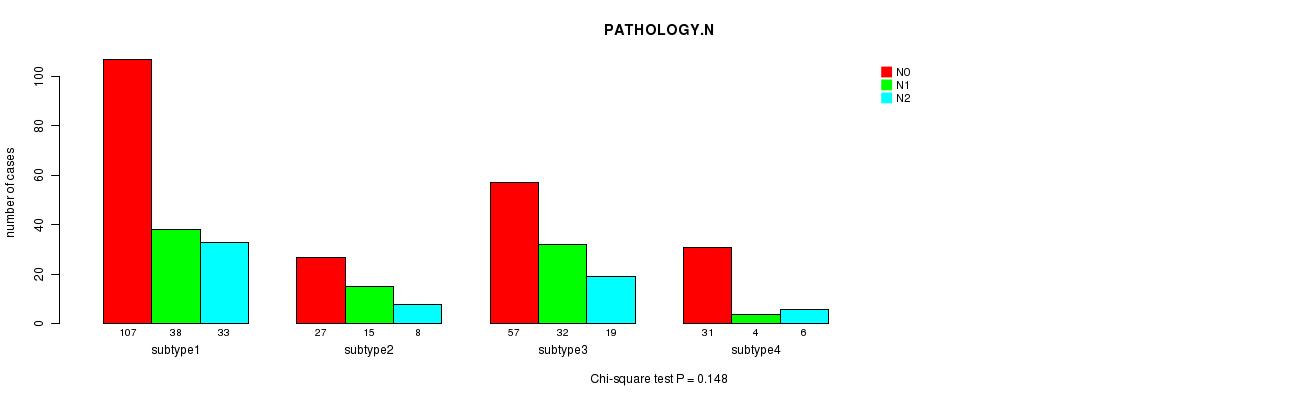
P value = 0.148 (Chi-square test)
Table S80. Clustering Approach #8: 'MIRseq cHierClus subtypes' versus Clinical Feature #6: 'PATHOLOGY.N'
| nPatients | N0 | N1 | N2 |
|---|---|---|---|
| ALL | 222 | 89 | 66 |
| subtype1 | 107 | 38 | 33 |
| subtype2 | 27 | 15 | 8 |
| subtype3 | 57 | 32 | 19 |
| subtype4 | 31 | 4 | 6 |
Figure S72. Get High-res Image Clustering Approach #8: 'MIRseq cHierClus subtypes' versus Clinical Feature #6: 'PATHOLOGY.N'
P value = 3.19e-05 (Chi-square test)
Table S81. Clustering Approach #8: 'MIRseq cHierClus subtypes' versus Clinical Feature #7: 'PATHOLOGICSPREAD(M)'
| nPatients | M0 | M1 | M1A | M1B | MX |
|---|---|---|---|---|---|
| ALL | 286 | 49 | 7 | 1 | 28 |
| subtype1 | 144 | 29 | 2 | 0 | 0 |
| subtype2 | 34 | 6 | 2 | 0 | 8 |
| subtype3 | 76 | 13 | 2 | 0 | 15 |
| subtype4 | 32 | 1 | 1 | 1 | 5 |
Figure S73. Get High-res Image Clustering Approach #8: 'MIRseq cHierClus subtypes' versus Clinical Feature #7: 'PATHOLOGICSPREAD(M)'
P value = 0.353 (Chi-square test)
Table S82. Clustering Approach #8: 'MIRseq cHierClus subtypes' versus Clinical Feature #8: 'TUMOR.STAGE'
| nPatients | I | II | III | IV |
|---|---|---|---|---|
| ALL | 62 | 144 | 106 | 55 |
| subtype1 | 34 | 64 | 44 | 28 |
| subtype2 | 8 | 17 | 17 | 8 |
| subtype3 | 14 | 40 | 36 | 16 |
| subtype4 | 6 | 23 | 9 | 3 |
Figure S74. Get High-res Image Clustering Approach #8: 'MIRseq cHierClus subtypes' versus Clinical Feature #8: 'TUMOR.STAGE'
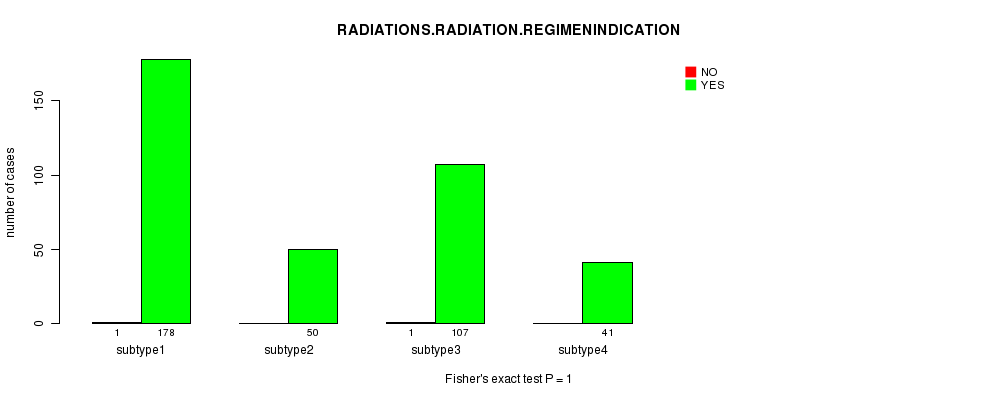
P value = 1 (Fisher's exact test)
Table S83. Clustering Approach #8: 'MIRseq cHierClus subtypes' versus Clinical Feature #9: 'RADIATIONS.RADIATION.REGIMENINDICATION'
| nPatients | NO | YES |
|---|---|---|
| ALL | 2 | 376 |
| subtype1 | 1 | 178 |
| subtype2 | 0 | 50 |
| subtype3 | 1 | 107 |
| subtype4 | 0 | 41 |
Figure S75. Get High-res Image Clustering Approach #8: 'MIRseq cHierClus subtypes' versus Clinical Feature #9: 'RADIATIONS.RADIATION.REGIMENINDICATION'
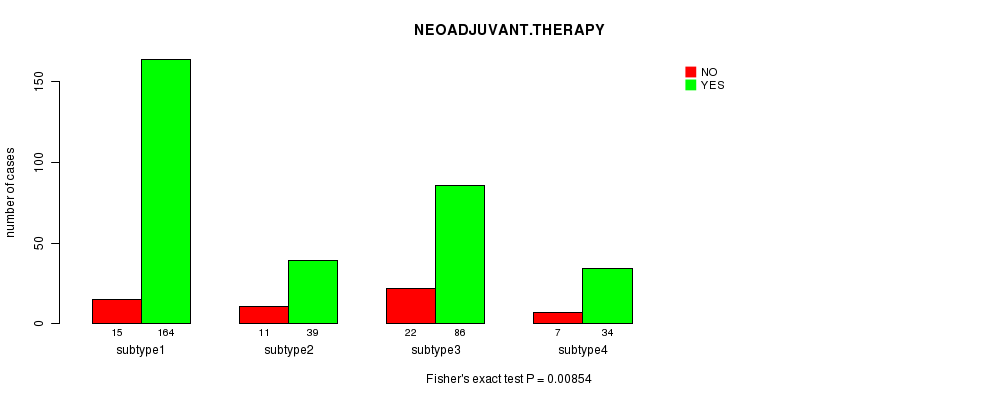
P value = 0.00854 (Fisher's exact test)
Table S84. Clustering Approach #8: 'MIRseq cHierClus subtypes' versus Clinical Feature #10: 'NEOADJUVANT.THERAPY'
| nPatients | NO | YES |
|---|---|---|
| ALL | 55 | 323 |
| subtype1 | 15 | 164 |
| subtype2 | 11 | 39 |
| subtype3 | 22 | 86 |
| subtype4 | 7 | 34 |
Figure S76. Get High-res Image Clustering Approach #8: 'MIRseq cHierClus subtypes' versus Clinical Feature #10: 'NEOADJUVANT.THERAPY'
-
Cluster data file = COAD.mergedcluster.txt
-
Clinical data file = COAD.clin.merged.picked.txt
-
Number of patients = 422
-
Number of clustering approaches = 8
-
Number of selected clinical features = 10
-
Exclude small clusters that include fewer than K patients, K = 3
consensus non-negative matrix factorization clustering approach (Brunet et al. 2004)
Resampling-based clustering method (Monti et al. 2003)
For survival clinical features, the Kaplan-Meier survival curves of tumors with and without gene mutations were plotted and the statistical significance P values were estimated by logrank test (Bland and Altman 2004) using the 'survdiff' function in R
For continuous numerical clinical features, one-way analysis of variance (Howell 2002) was applied to compare the clinical values between tumor subtypes using 'anova' function in R
For binary clinical features, two-tailed Fisher's exact tests (Fisher 1922) were used to estimate the P values using the 'fisher.test' function in R
For multi-class clinical features (nominal or ordinal), Chi-square tests (Greenwood and Nikulin 1996) were used to estimate the P values using the 'chisq.test' function in R
This is an experimental feature. The full results of the analysis summarized in this report can be downloaded from the TCGA Data Coordination Center.