This pipeline uses various statistical tests to identify mRNAs whose expression levels correlated to selected clinical features.
Testing the association between 18344 genes and 9 clinical features across 83 samples, statistically thresholded by Q value < 0.05, 5 clinical features related to at least one genes.
-
5 genes correlated to 'PRIMARY.SITE.OF.DISEASE'.
-
RFX6|222546 , AHSG|197 , AFP|174 , NXF2B|728343 , DPY19L1|23333
-
17 genes correlated to 'GENDER'.
-
XIST|7503 , RPS4Y1|6192 , DDX3Y|8653 , UTY|7404 , ZFY|7544 , ...
-
19 genes correlated to 'HISTOLOGICAL.TYPE'.
-
HBG2|3048 , AFP|174 , AHSG|197 , HSPA2|3306 , DPPA4|55211 , ...
-
1 gene correlated to 'PATHOLOGY.N'.
-
CLNK|116449
-
3 genes correlated to 'PATHOLOGICSPREAD(M)'.
-
PAIP2B|400961 , NUCB1|4924 , ZDHHC22|283576
-
No genes correlated to 'Time to Death', 'AGE', 'PATHOLOGY.T', and 'TUMOR.STAGE'.
Complete statistical result table is provided in Supplement Table 1
Table 1. Get Full Table This table shows the clinical features, statistical methods used, and the number of genes that are significantly associated with each clinical feature at Q value < 0.05.
| Clinical feature | Statistical test | Significant genes | Associated with | Associated with | ||
|---|---|---|---|---|---|---|
| Time to Death | Cox regression test | N=0 | ||||
| AGE | Spearman correlation test | N=0 | ||||
| PRIMARY SITE OF DISEASE | t test | N=5 | rectum | N=2 | colon | N=3 |
| GENDER | t test | N=17 | male | N=15 | female | N=2 |
| HISTOLOGICAL TYPE | ANOVA test | N=19 | ||||
| PATHOLOGY T | Spearman correlation test | N=0 | ||||
| PATHOLOGY N | Spearman correlation test | N=1 | higher pN | N=0 | lower pN | N=1 |
| PATHOLOGICSPREAD(M) | ANOVA test | N=3 | ||||
| TUMOR STAGE | Spearman correlation test | N=0 |
Table S1. Basic characteristics of clinical feature: 'Time to Death'
| Time to Death | Duration (Months) | 0.9-72.1 (median=8.2) |
| censored | N = 42 | |
| death | N = 4 | |
| Significant markers | N = 0 |
Table S2. Basic characteristics of clinical feature: 'AGE'
| AGE | Mean (SD) | 67.58 (11) |
| Significant markers | N = 0 |
Table S3. Basic characteristics of clinical feature: 'PRIMARY.SITE.OF.DISEASE'
| PRIMARY.SITE.OF.DISEASE | Labels | N |
| COLON | 11 | |
| RECTUM | 71 | |
| Significant markers | N = 5 | |
| Higher in RECTUM | 2 | |
| Higher in COLON | 3 |
Table S4. Get Full Table List of 5 genes differentially expressed by 'PRIMARY.SITE.OF.DISEASE'
| T(pos if higher in 'RECTUM') | ttestP | Q | AUC | |
|---|---|---|---|---|
| RFX6|222546 | 7.18 | 7.096e-09 | 0.000129 | 0.8889 |
| AHSG|197 | -8.76 | 2.915e-07 | 0.00532 | 0.9642 |
| AFP|174 | -8.71 | 5.621e-07 | 0.0103 | 0.9692 |
| NXF2B|728343 | 6.18 | 6.281e-07 | 0.0115 | 0.8696 |
| DPY19L1|23333 | -6.66 | 1.215e-06 | 0.0222 | 0.8988 |
Figure S1. Get High-res Image As an example, this figure shows the association of RFX6|222546 to 'PRIMARY.SITE.OF.DISEASE'. P value = 7.1e-09 with T-test analysis.
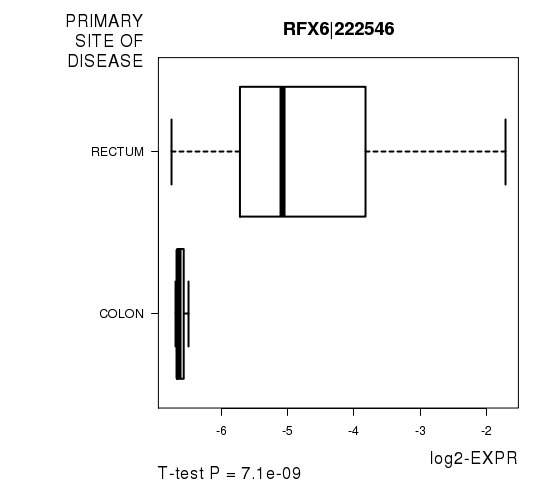
Table S5. Basic characteristics of clinical feature: 'GENDER'
| GENDER | Labels | N |
| FEMALE | 39 | |
| MALE | 44 | |
| Significant markers | N = 17 | |
| Higher in MALE | 15 | |
| Higher in FEMALE | 2 |
Table S6. Get Full Table List of top 10 genes differentially expressed by 'GENDER'
| T(pos if higher in 'MALE') | ttestP | Q | AUC | |
|---|---|---|---|---|
| XIST|7503 | -17.52 | 4.381e-27 | 8.04e-23 | 0.9932 |
| RPS4Y1|6192 | 17.42 | 3.108e-26 | 5.7e-22 | 0.9955 |
| DDX3Y|8653 | 16.61 | 7.398e-22 | 1.36e-17 | 0.9932 |
| UTY|7404 | 14.7 | 1.651e-21 | 3.03e-17 | 0.9886 |
| ZFY|7544 | 11.71 | 6.462e-19 | 1.19e-14 | 0.9679 |
| KDM5D|8284 | 13.65 | 1.176e-14 | 2.16e-10 | 0.9928 |
| TTTY15|64595 | 10.33 | 1.664e-14 | 3.05e-10 | 0.9585 |
| PRKY|5616 | 9.37 | 1.693e-14 | 3.1e-10 | 0.926 |
| TSIX|9383 | -9.54 | 2.535e-14 | 4.65e-10 | 0.9108 |
| EIF1AY|9086 | 11.61 | 9.986e-14 | 1.83e-09 | 0.9795 |
Figure S2. Get High-res Image As an example, this figure shows the association of XIST|7503 to 'GENDER'. P value = 4.38e-27 with T-test analysis.
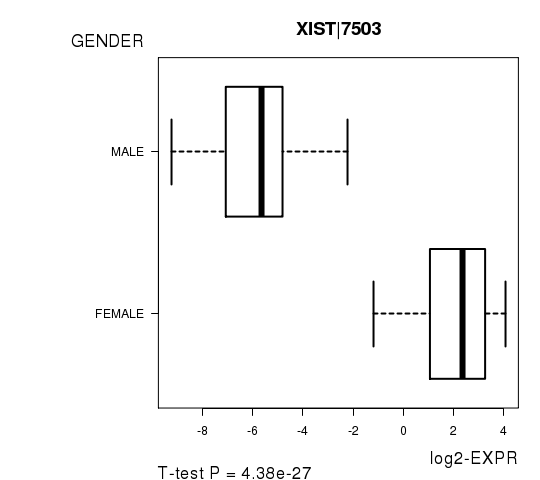
Table S7. Basic characteristics of clinical feature: 'HISTOLOGICAL.TYPE'
| HISTOLOGICAL.TYPE | Labels | N |
| COLON ADENOCARCINOMA | 11 | |
| RECTAL ADENOCARCINOMA | 60 | |
| RECTAL MUCINOUS ADENOCARCINOMA | 8 | |
| Significant markers | N = 19 |
Table S8. Get Full Table List of top 10 genes differentially expressed by 'HISTOLOGICAL.TYPE'
| ANOVA_P | Q | |
|---|---|---|
| HBG2|3048 | 1.369e-10 | 2.51e-06 |
| AFP|174 | 5.118e-10 | 9.39e-06 |
| AHSG|197 | 3.92e-09 | 7.19e-05 |
| HSPA2|3306 | 5.95e-09 | 0.000109 |
| DPPA4|55211 | 3.107e-08 | 0.00057 |
| SILV|6490 | 7.985e-08 | 0.00146 |
| PDCL|5082 | 9.035e-08 | 0.00166 |
| TOX|9760 | 1.017e-07 | 0.00186 |
| TF|7018 | 2.453e-07 | 0.0045 |
| B3GNT6|192134 | 4.009e-07 | 0.00735 |
Figure S3. Get High-res Image As an example, this figure shows the association of HBG2|3048 to 'HISTOLOGICAL.TYPE'. P value = 1.37e-10 with ANOVA analysis.
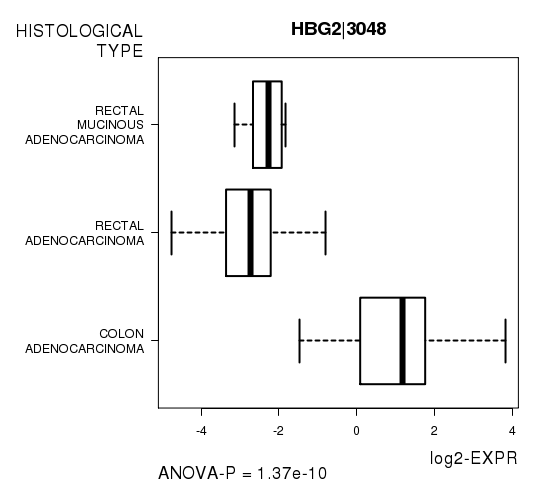
Table S9. Basic characteristics of clinical feature: 'PATHOLOGY.T'
| PATHOLOGY.T | Mean (SD) | 2.71 (0.67) |
| N | ||
| T1 | 5 | |
| T2 | 19 | |
| T3 | 54 | |
| T4 | 5 | |
| Significant markers | N = 0 |
Table S10. Basic characteristics of clinical feature: 'PATHOLOGY.N'
| PATHOLOGY.N | Mean (SD) | 0.54 (0.77) |
| N | ||
| N0 | 52 | |
| N1 | 17 | |
| N2 | 14 | |
| Significant markers | N = 1 | |
| pos. correlated | 0 | |
| neg. correlated | 1 |
Table S11. Get Full Table List of one gene significantly correlated to 'PATHOLOGY.N' by Spearman correlation test
| SpearmanCorr | corrP | Q | |
|---|---|---|---|
| CLNK|116449 | -0.5033 | 2.271e-06 | 0.0417 |
Figure S4. Get High-res Image As an example, this figure shows the association of CLNK|116449 to 'PATHOLOGY.N'. P value = 2.27e-06 with Spearman correlation analysis.
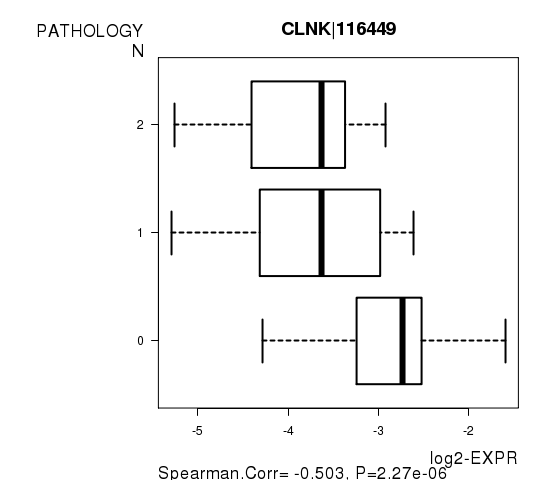
Table S12. Basic characteristics of clinical feature: 'PATHOLOGICSPREAD(M)'
| PATHOLOGICSPREAD(M) | Labels | N |
| M0 | 68 | |
| M1 | 13 | |
| M1A | 1 | |
| Significant markers | N = 3 |
Table S13. Get Full Table List of 3 genes differentially expressed by 'PATHOLOGICSPREAD(M)'
| ANOVA_P | Q | |
|---|---|---|
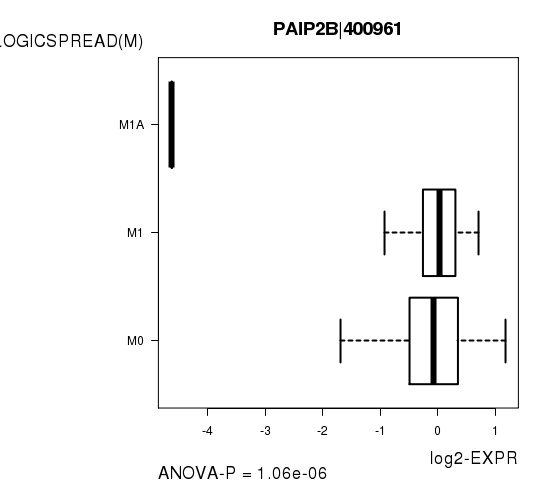
| PAIP2B|400961 | 1.063e-06 | 0.0195 |
| NUCB1|4924 | 2.379e-06 | 0.0436 |
| ZDHHC22|283576 | 2.438e-06 | 0.0447 |
Figure S5. Get High-res Image As an example, this figure shows the association of PAIP2B|400961 to 'PATHOLOGICSPREAD(M)'. P value = 1.06e-06 with ANOVA analysis.
-
Expresson data file = COADREAD.mRNAseq_RPKM_log2.txt
-
Clinical data file = COADREAD.clin.merged.picked.txt
-
Number of patients = 83
-
Number of genes = 18344
-
Number of clinical features = 9
For survival clinical features, Wald's test in univariate Cox regression analysis with proportional hazards model (Andersen and Gill 1982) was used to estimate the P values using the 'coxph' function in R. Kaplan-Meier survival curves were plot using the four quartile subgroups of patients based on expression levels
For continuous numerical clinical features, Spearman's rank correlation coefficients (Spearman 1904) and two-tailed P values were estimated using 'cor.test' function in R
For two-class clinical features, two-tailed Student's t test with unequal variance (Lehmann and Romano 2005) was applied to compare the log2-expression levels between the two clinical classes using 't.test' function in R
For multi-class clinical features (ordinal or nominal), one-way analysis of variance (Howell 2002) was applied to compare the log2-expression levels between different clinical classes using 'anova' function in R
For multiple hypothesis correction, Q value is the False Discovery Rate (FDR) analogue of the P value (Benjamini and Hochberg 1995), defined as the minimum FDR at which the test may be called significant. We used the 'Benjamini and Hochberg' method of 'p.adjust' function in R to convert P values into Q values.
This is an experimental feature. The full results of the analysis summarized in this report can be downloaded from the TCGA Data Coordination Center.