This pipeline uses various statistical tests to identify mRNAs whose expression levels correlated to selected clinical features.
Testing the association between 18384 genes and 8 clinical features across 286 samples, statistically thresholded by Q value < 0.05, 5 clinical features related to at least one genes.
-
10 genes correlated to 'Time to Death'.
-
FGD3|89846 , CYB5B|80777 , TOMM34|10953 , SLC25A45|283130 , SEC11A|23478 , ...
-
1 gene correlated to 'AGE'.
-
RNASE3|6037
-
31 genes correlated to 'GENDER'.
-
XIST|7503 , ZFY|7544 , PRKY|5616 , RPS4Y1|6192 , TSIX|9383 , ...
-
2 genes correlated to 'PATHOLOGY.T'.
-
LRRC8A|56262 , GTF3C4|9329
-
9 genes correlated to 'PATHOLOGY.N'.
-
SPRR2F|6705 , TGM1|7051 , CRCT1|54544 , SPOCK1|6695 , PTDSS1|9791 , ...
-
No genes correlated to 'TUMOR.STAGE', 'RADIATIONS.RADIATION.REGIMENINDICATION', and 'NEOADJUVANT.THERAPY'.
Complete statistical result table is provided in Supplement Table 1
Table 1. Get Full Table This table shows the clinical features, statistical methods used, and the number of genes that are significantly associated with each clinical feature at Q value < 0.05.
| Clinical feature | Statistical test | Significant genes | Associated with | Associated with | ||
|---|---|---|---|---|---|---|
| Time to Death | Cox regression test | N=10 | shorter survival | N=4 | longer survival | N=6 |
| AGE | Spearman correlation test | N=1 | older | N=1 | younger | N=0 |
| GENDER | t test | N=31 | male | N=13 | female | N=18 |
| PATHOLOGY T | Spearman correlation test | N=2 | higher pT | N=2 | lower pT | N=0 |
| PATHOLOGY N | Spearman correlation test | N=9 | higher pN | N=4 | lower pN | N=5 |
| TUMOR STAGE | Spearman correlation test | N=0 | ||||
| RADIATIONS RADIATION REGIMENINDICATION | t test | N=0 | ||||
| NEOADJUVANT THERAPY | t test | N=0 |
Table S1. Basic characteristics of clinical feature: 'Time to Death'
| Time to Death | Duration (Months) | 0.1-210.9 (median=14.8) |
| censored | N = 164 | |
| death | N = 119 | |
| Significant markers | N = 10 | |
| associated with shorter survival | 4 | |
| associated with longer survival | 6 |
Table S2. Get Full Table List of 10 genes significantly associated with 'Time to Death' by Cox regression test
| HazardRatio | Wald_P | Q | C_index | |
|---|---|---|---|---|
| FGD3|89846 | 0.61 | 4.315e-09 | 7.9e-05 | 0.327 |
| CYB5B|80777 | 2.4 | 1.271e-07 | 0.0023 | 0.627 |
| TOMM34|10953 | 2.3 | 3.724e-07 | 0.0068 | 0.642 |
| SLC25A45|283130 | 0.58 | 6.282e-07 | 0.012 | 0.355 |
| SEC11A|23478 | 2.8 | 8.815e-07 | 0.016 | 0.642 |
| LOC728989|728989 | 0.65 | 1.035e-06 | 0.019 | 0.337 |
| TXNDC9|10190 | 2.2 | 1.08e-06 | 0.02 | 0.597 |
| TP53INP1|94241 | 0.64 | 1.171e-06 | 0.022 | 0.359 |
| DUSP16|80824 | 0.46 | 2.09e-06 | 0.038 | 0.38 |
| SLC35E2|728661 | 0.57 | 2.601e-06 | 0.048 | 0.384 |
Figure S1. Get High-res Image As an example, this figure shows the association of FGD3|89846 to 'Time to Death'. four curves present the cumulative survival rates of 4 quartile subsets of patients. P value = 4.31e-09 with univariate Cox regression analysis using continuous log-2 expression values.
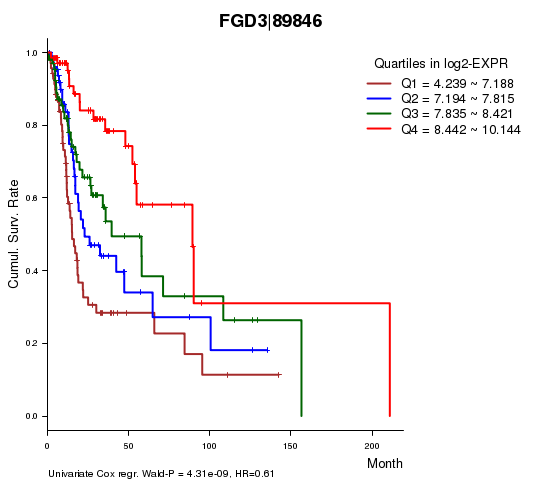
Table S3. Basic characteristics of clinical feature: 'AGE'
| AGE | Mean (SD) | 61.29 (12) |
| Significant markers | N = 1 | |
| pos. correlated | 1 | |
| neg. correlated | 0 |
Table S4. Get Full Table List of one gene significantly correlated to 'AGE' by Spearman correlation test
| SpearmanCorr | corrP | Q | |
|---|---|---|---|
| RNASE3|6037 | 0.3443 | 1.499e-06 | 0.0276 |
Figure S2. Get High-res Image As an example, this figure shows the association of RNASE3|6037 to 'AGE'. P value = 1.5e-06 with Spearman correlation analysis. The straight line presents the best linear regression.
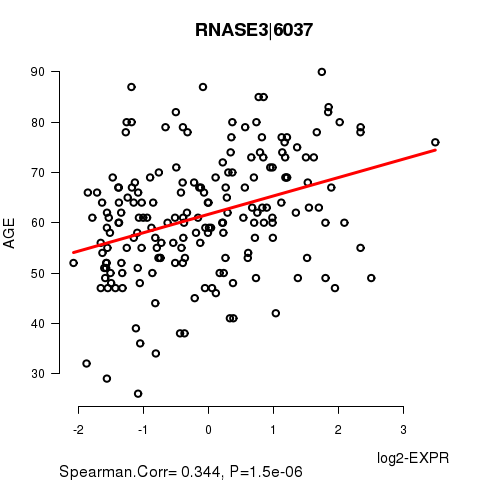
Table S5. Basic characteristics of clinical feature: 'GENDER'
| GENDER | Labels | N |
| FEMALE | 78 | |
| MALE | 208 | |
| Significant markers | N = 31 | |
| Higher in MALE | 13 | |
| Higher in FEMALE | 18 |
Table S6. Get Full Table List of top 10 genes differentially expressed by 'GENDER'
| T(pos if higher in 'MALE') | ttestP | Q | AUC | |
|---|---|---|---|---|
| XIST|7503 | -36.19 | 4.122e-85 | 7.58e-81 | 0.9897 |
| ZFY|7544 | 31.27 | 1.245e-56 | 2.29e-52 | 0.9852 |
| PRKY|5616 | 23.72 | 3.719e-49 | 6.84e-45 | 0.9823 |
| RPS4Y1|6192 | 29.28 | 4.89e-46 | 8.99e-42 | 0.9872 |
| TSIX|9383 | -15.96 | 2.675e-33 | 4.92e-29 | 0.9594 |
| DDX3Y|8653 | 25.54 | 3.428e-33 | 6.3e-29 | 0.9784 |
| USP9Y|8287 | 20.55 | 1.996e-24 | 3.67e-20 | 0.9783 |
| KDM5D|8284 | 20.14 | 6.591e-23 | 1.21e-18 | 0.976 |
| NLGN4Y|22829 | 17.37 | 1.06e-21 | 1.95e-17 | 0.9687 |
| UTY|7404 | 18.04 | 4.107e-20 | 7.55e-16 | 0.971 |
Figure S3. Get High-res Image As an example, this figure shows the association of XIST|7503 to 'GENDER'. P value = 4.12e-85 with T-test analysis.
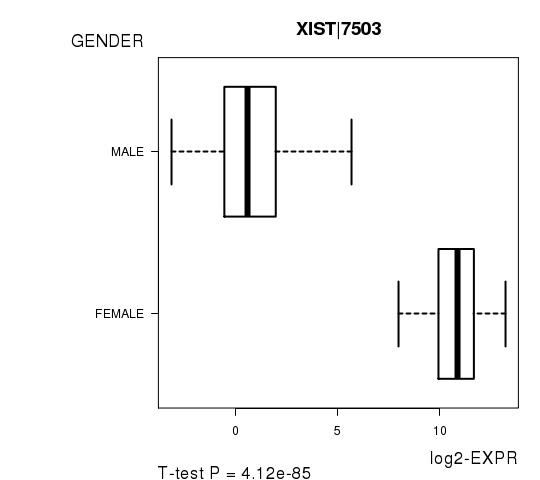
Table S7. Basic characteristics of clinical feature: 'PATHOLOGY.T'
| PATHOLOGY.T | Mean (SD) | 2.93 (1) |
| N | ||
| T1 | 20 | |
| T2 | 76 | |
| T3 | 58 | |
| T4 | 98 | |
| Significant markers | N = 2 | |
| pos. correlated | 2 | |
| neg. correlated | 0 |
Table S8. Get Full Table List of 2 genes significantly correlated to 'PATHOLOGY.T' by Spearman correlation test
| SpearmanCorr | corrP | Q | |
|---|---|---|---|
| LRRC8A|56262 | 0.3379 | 3.808e-08 | 7e-04 |
| GTF3C4|9329 | 0.2948 | 1.903e-06 | 0.035 |
Figure S4. Get High-res Image As an example, this figure shows the association of LRRC8A|56262 to 'PATHOLOGY.T'. P value = 3.81e-08 with Spearman correlation analysis.
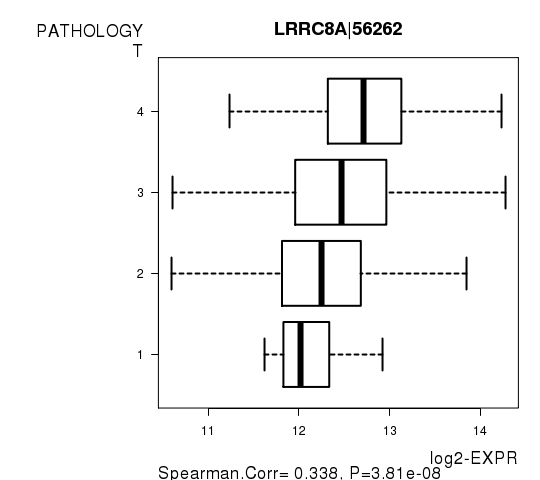
Table S9. Basic characteristics of clinical feature: 'PATHOLOGY.N'
| PATHOLOGY.N | Mean (SD) | 1.03 (0.96) |
| N | ||
| N0 | 95 | |
| N1 | 31 | |
| N2 | 94 | |
| N3 | 4 | |
| Significant markers | N = 9 | |
| pos. correlated | 4 | |
| neg. correlated | 5 |
Table S10. Get Full Table List of 9 genes significantly correlated to 'PATHOLOGY.N' by Spearman correlation test
| SpearmanCorr | corrP | Q | |
|---|---|---|---|
| SPRR2F|6705 | -0.3577 | 4.863e-08 | 0.000894 |
| TGM1|7051 | -0.3441 | 1.27e-07 | 0.00233 |
| CRCT1|54544 | -0.3413 | 2.093e-07 | 0.00385 |
| SPOCK1|6695 | 0.3322 | 3.581e-07 | 0.00658 |
| PTDSS1|9791 | 0.3297 | 4.459e-07 | 0.0082 |
| GDPD3|79153 | -0.3179 | 1.19e-06 | 0.0219 |
| TRMT12|55039 | 0.3157 | 1.416e-06 | 0.026 |
| PPFIA1|8500 | 0.3118 | 1.933e-06 | 0.0355 |
| MPZL2|10205 | -0.3109 | 2.078e-06 | 0.0382 |
Figure S5. Get High-res Image As an example, this figure shows the association of SPRR2F|6705 to 'PATHOLOGY.N'. P value = 4.86e-08 with Spearman correlation analysis.
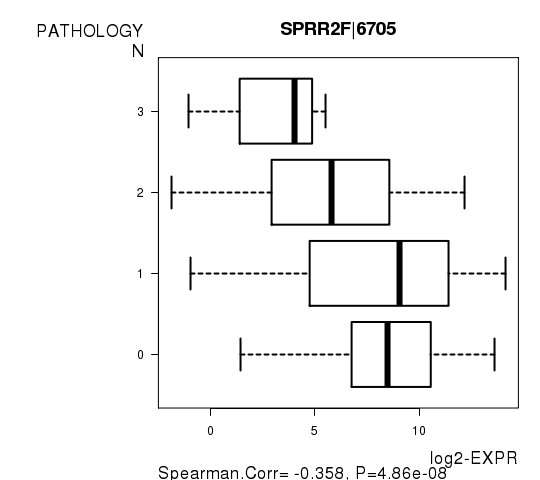
Table S11. Basic characteristics of clinical feature: 'TUMOR.STAGE'
| TUMOR.STAGE | Mean (SD) | 3.3 (0.96) |
| N | ||
| Stage 1 | 14 | |
| Stage 2 | 46 | |
| Stage 3 | 39 | |
| Stage 4 | 148 | |
| Significant markers | N = 0 |
No gene related to 'RADIATIONS.RADIATION.REGIMENINDICATION'.
Table S12. Basic characteristics of clinical feature: 'RADIATIONS.RADIATION.REGIMENINDICATION'
| RADIATIONS.RADIATION.REGIMENINDICATION | Labels | N |
| NO | 75 | |
| YES | 211 | |
| Significant markers | N = 0 |
-
Expresson data file = HNSC.uncv2.mRNAseq_RSEM_normalized_log2.txt
-
Clinical data file = HNSC.clin.merged.picked.txt
-
Number of patients = 286
-
Number of genes = 18384
-
Number of clinical features = 8
For survival clinical features, Wald's test in univariate Cox regression analysis with proportional hazards model (Andersen and Gill 1982) was used to estimate the P values using the 'coxph' function in R. Kaplan-Meier survival curves were plot using the four quartile subgroups of patients based on expression levels
For continuous numerical clinical features, Spearman's rank correlation coefficients (Spearman 1904) and two-tailed P values were estimated using 'cor.test' function in R
For two-class clinical features, two-tailed Student's t test with unequal variance (Lehmann and Romano 2005) was applied to compare the log2-expression levels between the two clinical classes using 't.test' function in R
For multiple hypothesis correction, Q value is the False Discovery Rate (FDR) analogue of the P value (Benjamini and Hochberg 1995), defined as the minimum FDR at which the test may be called significant. We used the 'Benjamini and Hochberg' method of 'p.adjust' function in R to convert P values into Q values.
This is an experimental feature. The full results of the analysis summarized in this report can be downloaded from the TCGA Data Coordination Center.