This pipeline uses various statistical tests to identify miRs whose expression levels correlated to selected clinical features.
Testing the association between 564 genes and 8 clinical features across 308 samples, statistically thresholded by Q value < 0.05, 4 clinical features related to at least one genes.
-
5 genes correlated to 'Time to Death'.
-
HSA-MIR-377 , HSA-MIR-154 , HSA-MIR-493 , HSA-MIR-337 , HSA-MIR-654
-
1 gene correlated to 'PATHOLOGY.N'.
-
HSA-MIR-195
-
5 genes correlated to 'RADIATIONS.RADIATION.REGIMENINDICATION'.
-
HSA-MIR-1274B , HSA-MIR-3676 , HSA-MIR-374A , HSA-MIR-660 , HSA-MIR-532
-
2 genes correlated to 'NEOADJUVANT.THERAPY'.
-
HSA-MIR-3676 , HSA-MIR-660
-
No genes correlated to 'AGE', 'GENDER', 'PATHOLOGY.T', and 'TUMOR.STAGE'.
Complete statistical result table is provided in Supplement Table 1
Table 1. Get Full Table This table shows the clinical features, statistical methods used, and the number of genes that are significantly associated with each clinical feature at Q value < 0.05.
| Clinical feature | Statistical test | Significant genes | Associated with | Associated with | ||
|---|---|---|---|---|---|---|
| Time to Death | Cox regression test | N=5 | shorter survival | N=5 | longer survival | N=0 |
| AGE | Spearman correlation test | N=0 | ||||
| GENDER | t test | N=0 | ||||
| PATHOLOGY T | Spearman correlation test | N=0 | ||||
| PATHOLOGY N | Spearman correlation test | N=1 | higher pN | N=1 | lower pN | N=0 |
| TUMOR STAGE | Spearman correlation test | N=0 | ||||
| RADIATIONS RADIATION REGIMENINDICATION | t test | N=5 | yes | N=4 | no | N=1 |
| NEOADJUVANT THERAPY | t test | N=2 | yes | N=2 | no | N=0 |
Table S1. Basic characteristics of clinical feature: 'Time to Death'
| Time to Death | Duration (Months) | 0.1-210.9 (median=15) |
| censored | N = 183 | |
| death | N = 122 | |
| Significant markers | N = 5 | |
| associated with shorter survival | 5 | |
| associated with longer survival | 0 |
Table S2. Get Full Table List of 5 genes significantly associated with 'Time to Death' by Cox regression test
| HazardRatio | Wald_P | Q | C_index | |
|---|---|---|---|---|
| HSA-MIR-377 | 1.48 | 2.217e-06 | 0.0013 | 0.634 |
| HSA-MIR-154 | 1.46 | 1.031e-05 | 0.0058 | 0.635 |
| HSA-MIR-493 | 1.45 | 2.314e-05 | 0.013 | 0.63 |
| HSA-MIR-337 | 1.4 | 2.811e-05 | 0.016 | 0.622 |
| HSA-MIR-654 | 1.38 | 4.724e-05 | 0.026 | 0.622 |
Figure S1. Get High-res Image As an example, this figure shows the association of HSA-MIR-377 to 'Time to Death'. four curves present the cumulative survival rates of 4 quartile subsets of patients. P value = 2.22e-06 with univariate Cox regression analysis using continuous log-2 expression values.
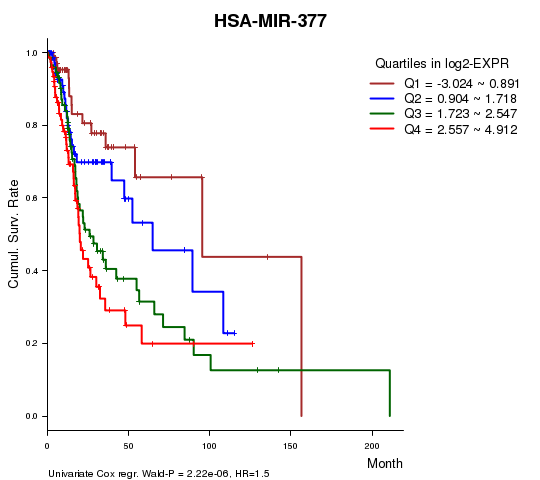
Table S3. Basic characteristics of clinical feature: 'AGE'
| AGE | Mean (SD) | 61.09 (12) |
| Significant markers | N = 0 |
Table S4. Basic characteristics of clinical feature: 'GENDER'
| GENDER | Labels | N |
| FEMALE | 86 | |
| MALE | 222 | |
| Significant markers | N = 0 |
Table S5. Basic characteristics of clinical feature: 'PATHOLOGY.T'
| PATHOLOGY.T | Mean (SD) | 2.91 (1) |
| N | ||
| T1 | 24 | |
| T2 | 78 | |
| T3 | 62 | |
| T4 | 103 | |
| Significant markers | N = 0 |
Table S6. Basic characteristics of clinical feature: 'PATHOLOGY.N'
| PATHOLOGY.N | Mean (SD) | 1.05 (0.96) |
| N | ||
| N0 | 99 | |
| N1 | 32 | |
| N2 | 101 | |
| N3 | 5 | |
| Significant markers | N = 1 | |
| pos. correlated | 1 | |
| neg. correlated | 0 |
Table S7. Get Full Table List of one gene significantly correlated to 'PATHOLOGY.N' by Spearman correlation test
| SpearmanCorr | corrP | Q | |
|---|---|---|---|
| HSA-MIR-195 | 0.2646 | 3.684e-05 | 0.0208 |
Figure S2. Get High-res Image As an example, this figure shows the association of HSA-MIR-195 to 'PATHOLOGY.N'. P value = 3.68e-05 with Spearman correlation analysis.
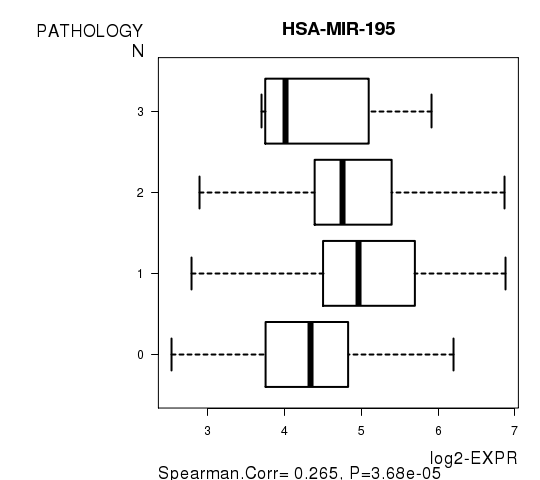
Table S8. Basic characteristics of clinical feature: 'TUMOR.STAGE'
| TUMOR.STAGE | Mean (SD) | 3.3 (0.98) |
| N | ||
| Stage 1 | 17 | |
| Stage 2 | 46 | |
| Stage 3 | 41 | |
| Stage 4 | 158 | |
| Significant markers | N = 0 |
5 genes related to 'RADIATIONS.RADIATION.REGIMENINDICATION'.
Table S9. Basic characteristics of clinical feature: 'RADIATIONS.RADIATION.REGIMENINDICATION'
| RADIATIONS.RADIATION.REGIMENINDICATION | Labels | N |
| NO | 77 | |
| YES | 231 | |
| Significant markers | N = 5 | |
| Higher in YES | 4 | |
| Higher in NO | 1 |
Table S10. Get Full Table List of 5 genes differentially expressed by 'RADIATIONS.RADIATION.REGIMENINDICATION'
| T(pos if higher in 'YES') | ttestP | Q | AUC | |
|---|---|---|---|---|
| HSA-MIR-1274B | 5.58 | 1.256e-07 | 7.08e-05 | 0.696 |
| HSA-MIR-3676 | 5.38 | 2.403e-07 | 0.000135 | 0.6658 |
| HSA-MIR-374A | -4.63 | 8.368e-06 | 0.0047 | 0.6576 |
| HSA-MIR-660 | 4.53 | 1.177e-05 | 0.0066 | 0.6511 |
| HSA-MIR-532 | 4.25 | 3.735e-05 | 0.0209 | 0.6495 |
Figure S3. Get High-res Image As an example, this figure shows the association of HSA-MIR-1274B to 'RADIATIONS.RADIATION.REGIMENINDICATION'. P value = 1.26e-07 with T-test analysis.
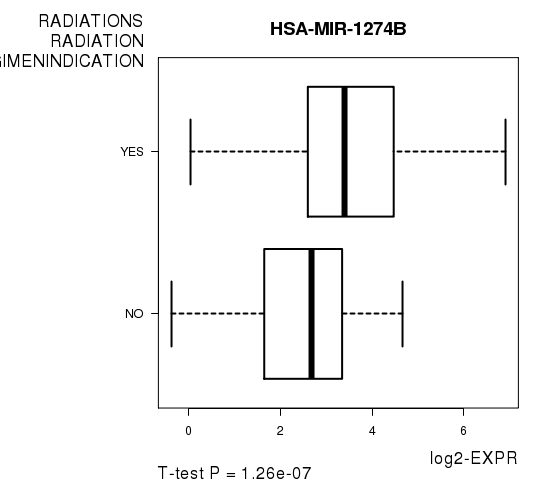
Table S11. Basic characteristics of clinical feature: 'NEOADJUVANT.THERAPY'
| NEOADJUVANT.THERAPY | Labels | N |
| NO | 48 | |
| YES | 260 | |
| Significant markers | N = 2 | |
| Higher in YES | 2 | |
| Higher in NO | 0 |
Table S12. Get Full Table List of 2 genes differentially expressed by 'NEOADJUVANT.THERAPY'
| T(pos if higher in 'YES') | ttestP | Q | AUC | |
|---|---|---|---|---|
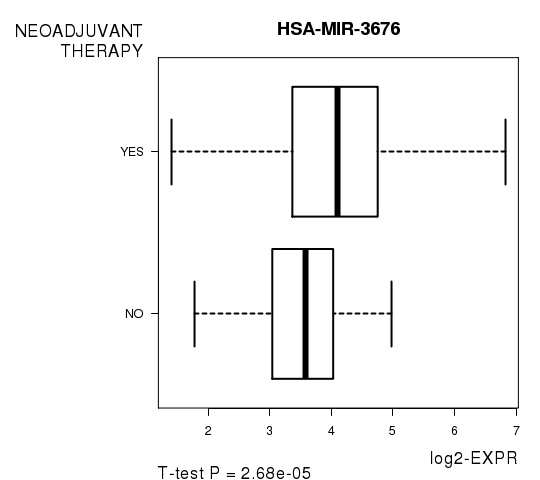
| HSA-MIR-3676 | 4.47 | 2.684e-05 | 0.0151 | 0.6653 |
| HSA-MIR-660 | 4.12 | 8.748e-05 | 0.0492 | 0.6508 |
Figure S4. Get High-res Image As an example, this figure shows the association of HSA-MIR-3676 to 'NEOADJUVANT.THERAPY'. P value = 2.68e-05 with T-test analysis.
-
Expresson data file = HNSC.miRseq_RPKM_log2.txt
-
Clinical data file = HNSC.clin.merged.picked.txt
-
Number of patients = 308
-
Number of genes = 564
-
Number of clinical features = 8
For survival clinical features, Wald's test in univariate Cox regression analysis with proportional hazards model (Andersen and Gill 1982) was used to estimate the P values using the 'coxph' function in R. Kaplan-Meier survival curves were plot using the four quartile subgroups of patients based on expression levels
For continuous numerical clinical features, Spearman's rank correlation coefficients (Spearman 1904) and two-tailed P values were estimated using 'cor.test' function in R
For two-class clinical features, two-tailed Student's t test with unequal variance (Lehmann and Romano 2005) was applied to compare the log2-expression levels between the two clinical classes using 't.test' function in R
For multiple hypothesis correction, Q value is the False Discovery Rate (FDR) analogue of the P value (Benjamini and Hochberg 1995), defined as the minimum FDR at which the test may be called significant. We used the 'Benjamini and Hochberg' method of 'p.adjust' function in R to convert P values into Q values.
This is an experimental feature. The full results of the analysis summarized in this report can be downloaded from the TCGA Data Coordination Center.