This pipeline computes the correlation between cancer subtypes identified by different molecular patterns and selected clinical features.
Testing the association between subtypes identified by 8 different clustering approaches and 8 clinical features across 311 patients, 9 significant findings detected with P value < 0.05.
-
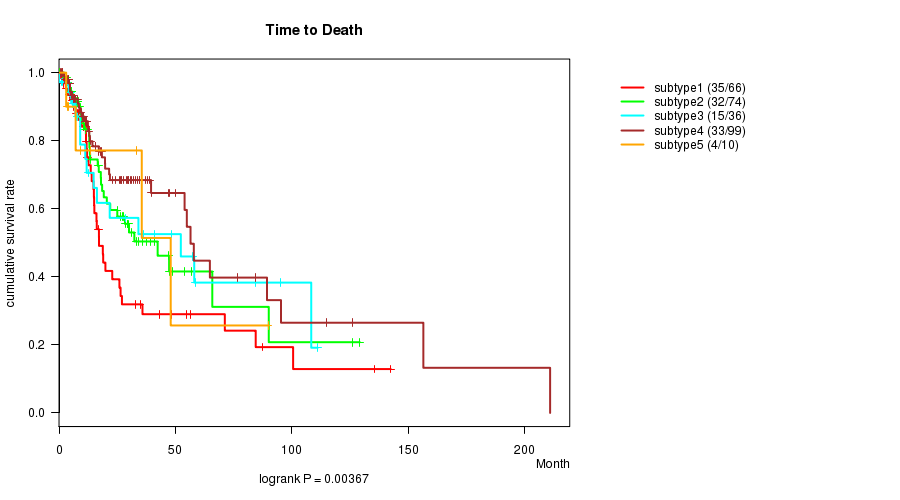
5 subtypes identified in current cancer cohort by 'CN CNMF'. These subtypes correlate to 'Time to Death' and 'AGE'.
-
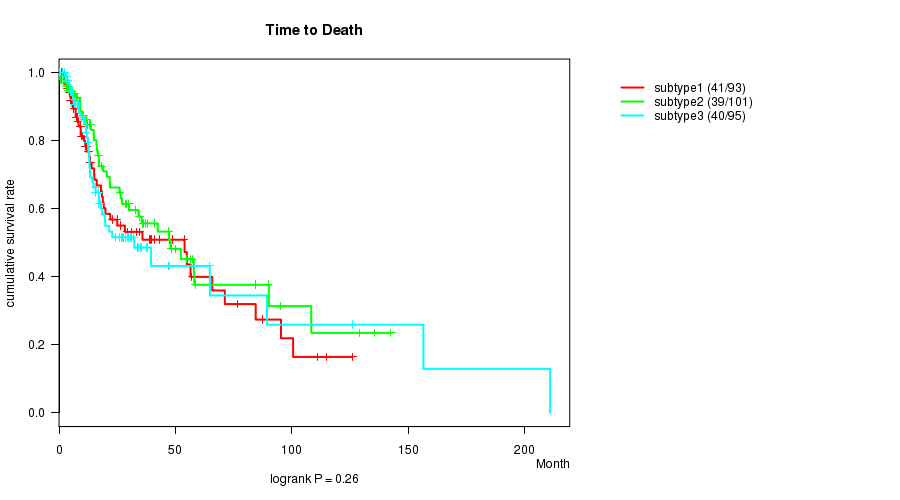
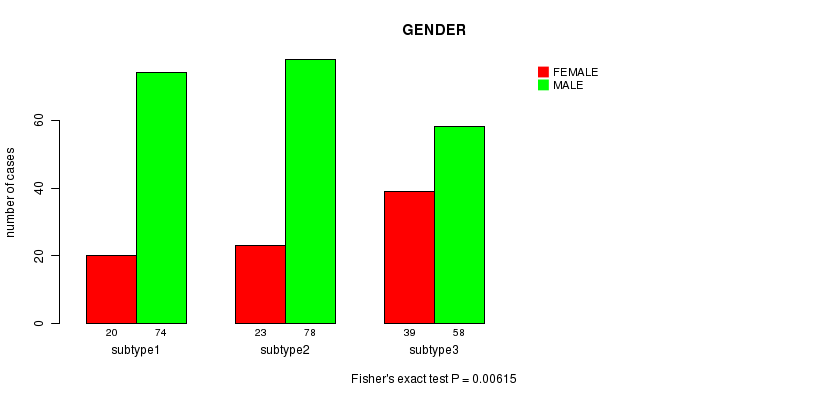
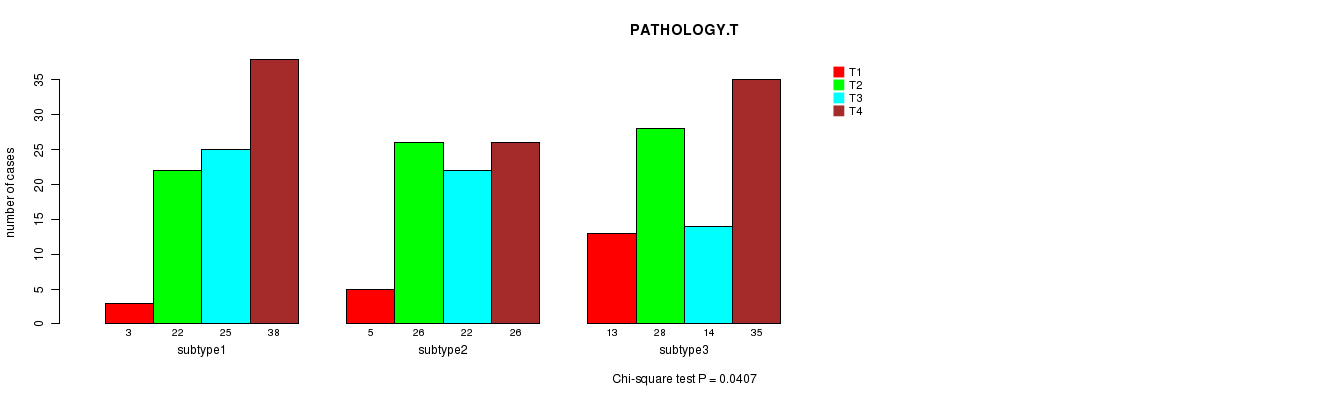
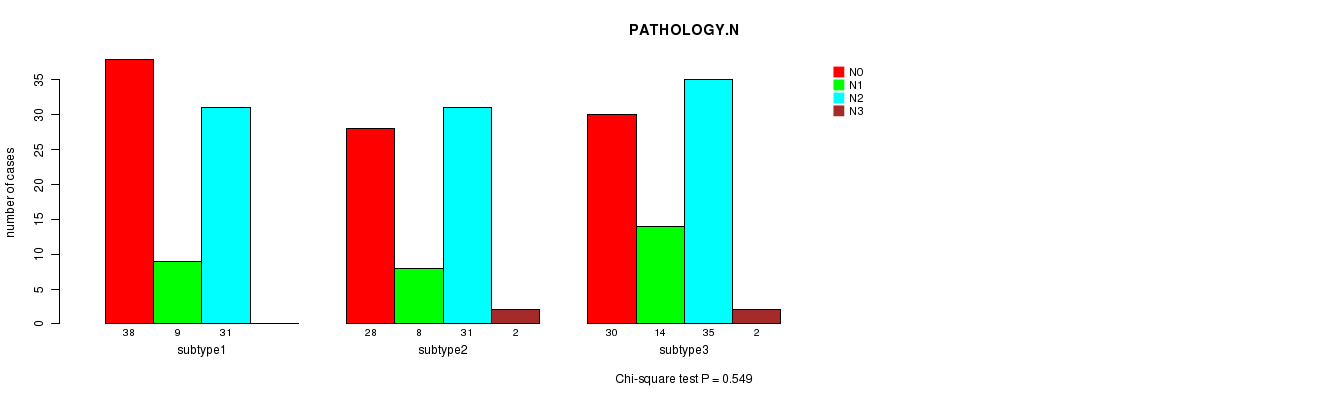
3 subtypes identified in current cancer cohort by 'METHLYATION CNMF'. These subtypes correlate to 'GENDER' and 'PATHOLOGY.T'.
-
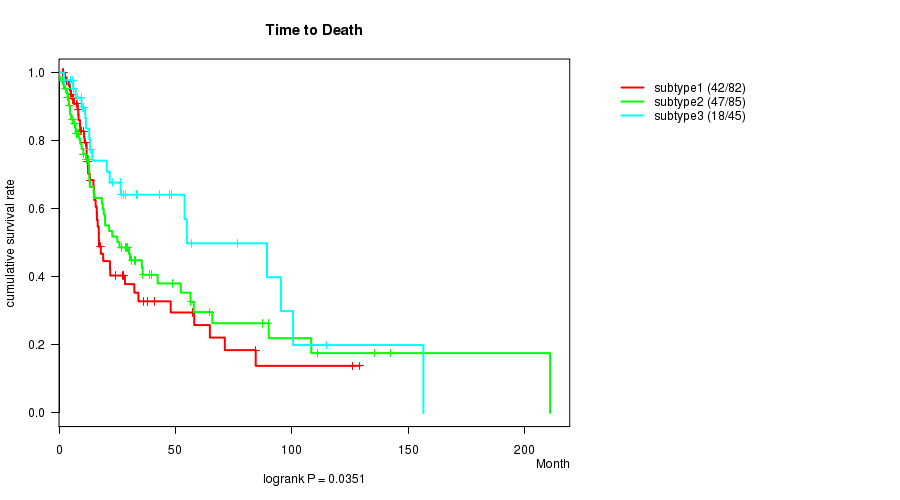
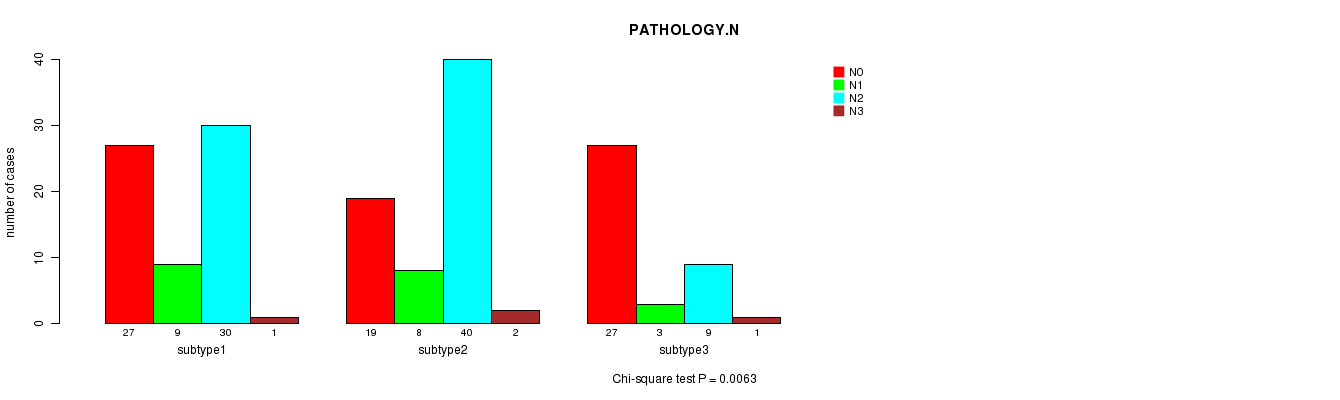
CNMF clustering analysis on RPPA data identified 3 subtypes that correlate to 'Time to Death', 'PATHOLOGY.N', and 'NEOADJUVANT.THERAPY'.
-
Consensus hierarchical clustering analysis on RPPA data identified 3 subtypes that do not correlate to any clinical features.
-
CNMF clustering analysis on sequencing-based mRNA expression data identified 3 subtypes that do not correlate to any clinical features.
-
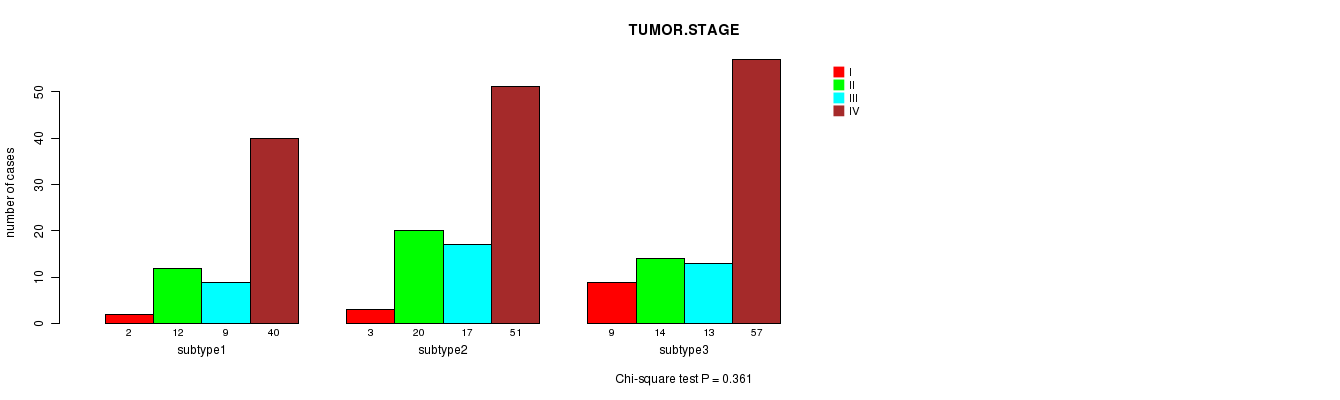
Consensus hierarchical clustering analysis on sequencing-based mRNA expression data identified 3 subtypes that correlate to 'NEOADJUVANT.THERAPY'.
-
CNMF clustering analysis on sequencing-based miR expression data identified 3 subtypes that do not correlate to any clinical features.
-
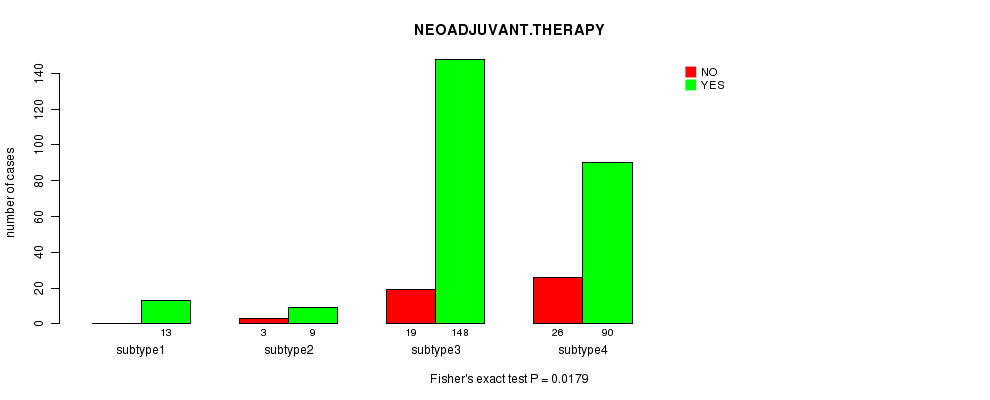
Consensus hierarchical clustering analysis on sequencing-based miR expression data identified 4 subtypes that correlate to 'NEOADJUVANT.THERAPY'.
Table 1. Get Full Table Overview of the association between subtypes identified by 8 different clustering approaches and 8 clinical features. Shown in the table are P values from statistical tests. Thresholded by P value < 0.05, 9 significant findings detected.
|
Clinical Features |
Time to Death |
AGE | GENDER |
PATHOLOGY T |
PATHOLOGY N |
TUMOR STAGE |
RADIATIONS RADIATION REGIMENINDICATION |
NEOADJUVANT THERAPY |
| Statistical Tests | logrank test | ANOVA | Fisher's exact test | Chi-square test | Chi-square test | Chi-square test | Fisher's exact test | Fisher's exact test |
| CN CNMF | 0.00367 | 0.0214 | 0.178 | 0.686 | 0.153 | 0.253 | 0.436 | 0.288 |
| METHLYATION CNMF | 0.26 | 0.071 | 0.00615 | 0.0407 | 0.549 | 0.569 | 0.65 | 0.922 |
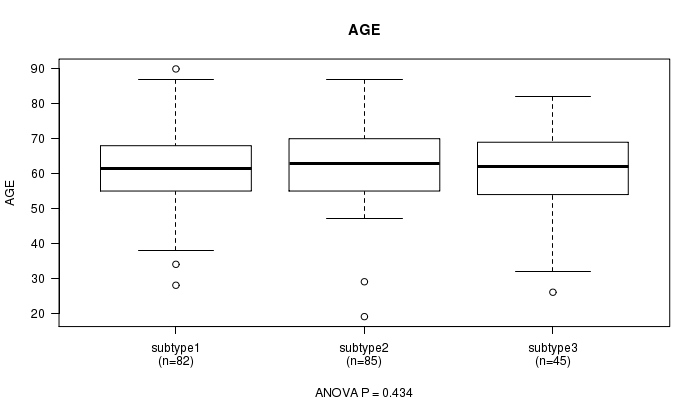
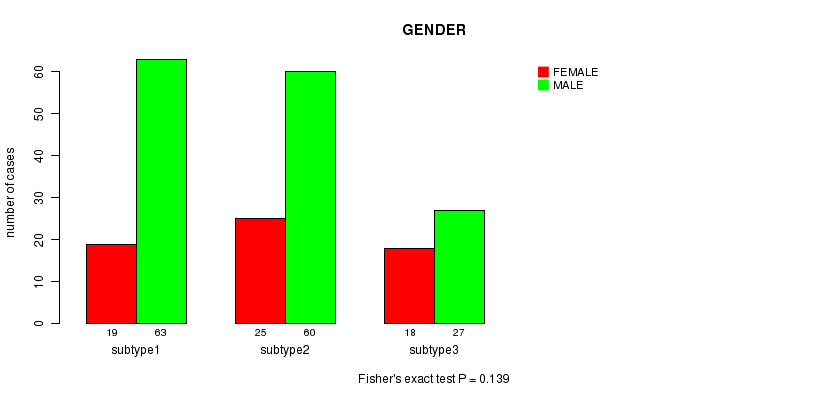
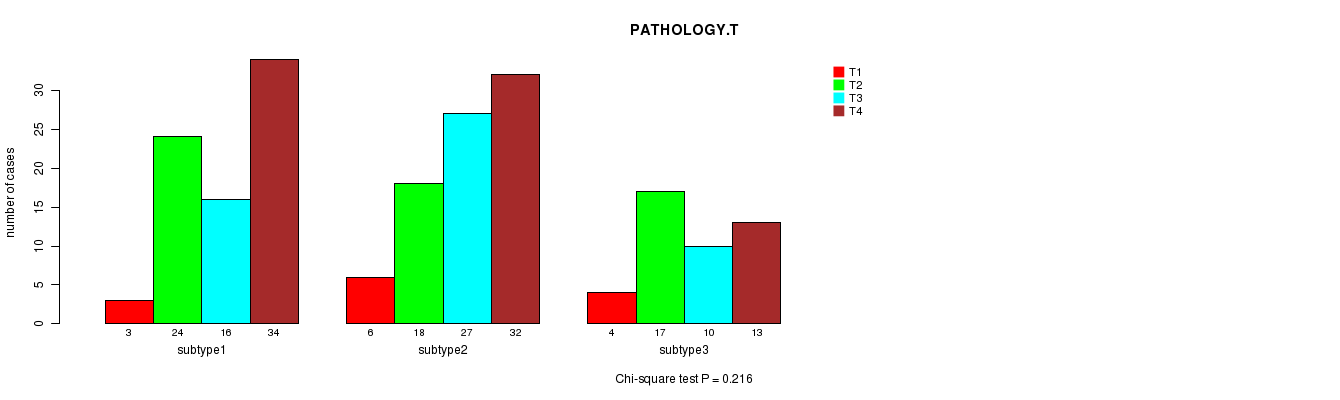
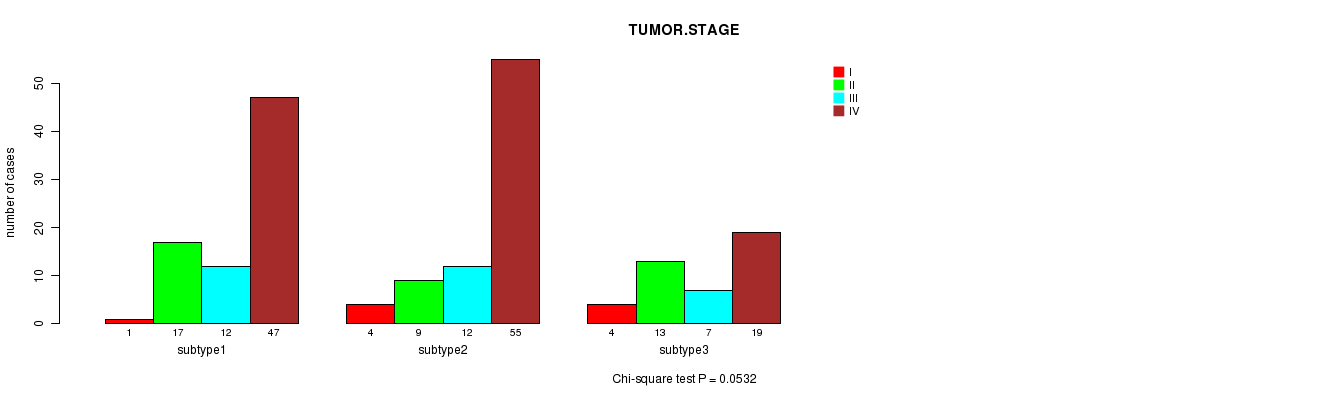
| RPPA CNMF subtypes | 0.0351 | 0.434 | 0.139 | 0.216 | 0.0063 | 0.0532 | 0.301 | 0.023 |
| RPPA cHierClus subtypes | 0.103 | 0.303 | 0.842 | 0.194 | 0.0534 | 0.103 | 0.595 | 0.0821 |
| RNAseq CNMF subtypes | 0.15 | 0.846 | 0.307 | 0.789 | 0.182 | 0.457 | 0.71 | 0.218 |
| RNAseq cHierClus subtypes | 0.119 | 0.33 | 0.372 | 0.172 | 0.0884 | 0.361 | 0.441 | 0.0304 |
| MIRseq CNMF subtypes | 0.72 | 0.723 | 0.0643 | 0.121 | 0.109 | 0.451 | 0.533 | 0.689 |
| MIRseq cHierClus subtypes | 0.161 | 0.688 | 0.637 | 0.395 | 0.191 | 0.321 | 0.551 | 0.0179 |
Table S1. Get Full Table Description of clustering approach #1: 'CN CNMF'
| Cluster Labels | 1 | 2 | 3 | 4 | 5 |
|---|---|---|---|---|---|
| Number of samples | 66 | 75 | 36 | 101 | 10 |
P value = 0.00367 (logrank test)
Table S2. Clustering Approach #1: 'CN CNMF' versus Clinical Feature #1: 'Time to Death'
| nPatients | nDeath | Duration Range (Median), Month | |
|---|---|---|---|
| ALL | 285 | 119 | 0.1 - 210.9 (14.3) |
| subtype1 | 66 | 35 | 0.2 - 142.5 (12.1) |
| subtype2 | 74 | 32 | 0.1 - 129.2 (18.0) |
| subtype3 | 36 | 15 | 0.1 - 111.1 (11.6) |
| subtype4 | 99 | 33 | 0.8 - 210.9 (17.1) |
| subtype5 | 10 | 4 | 3.1 - 89.8 (11.2) |
Figure S1. Get High-res Image Clustering Approach #1: 'CN CNMF' versus Clinical Feature #1: 'Time to Death'
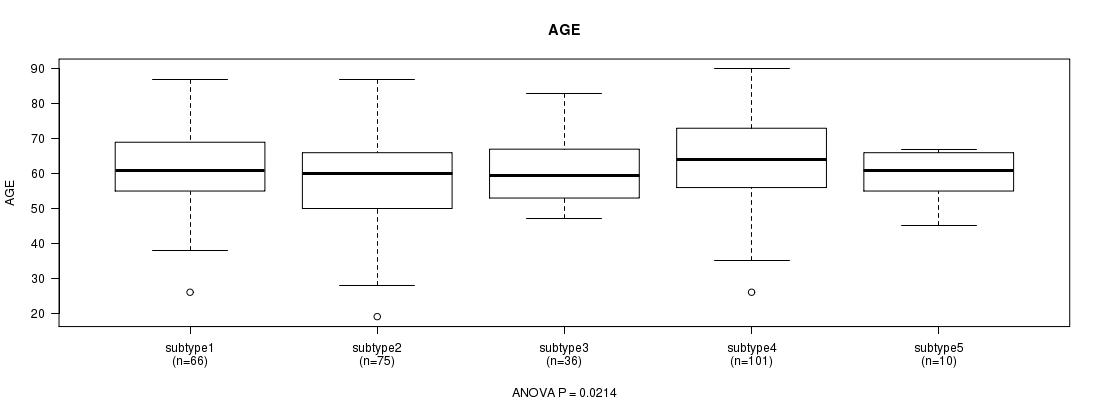
P value = 0.0214 (ANOVA)
Table S3. Clustering Approach #1: 'CN CNMF' versus Clinical Feature #2: 'AGE'
| nPatients | Mean (Std.Dev) | |
|---|---|---|
| ALL | 288 | 61.2 (12.2) |
| subtype1 | 66 | 61.8 (11.8) |
| subtype2 | 75 | 57.7 (13.2) |
| subtype3 | 36 | 60.8 (10.0) |
| subtype4 | 101 | 63.8 (12.3) |
| subtype5 | 10 | 59.5 (7.4) |
Figure S2. Get High-res Image Clustering Approach #1: 'CN CNMF' versus Clinical Feature #2: 'AGE'
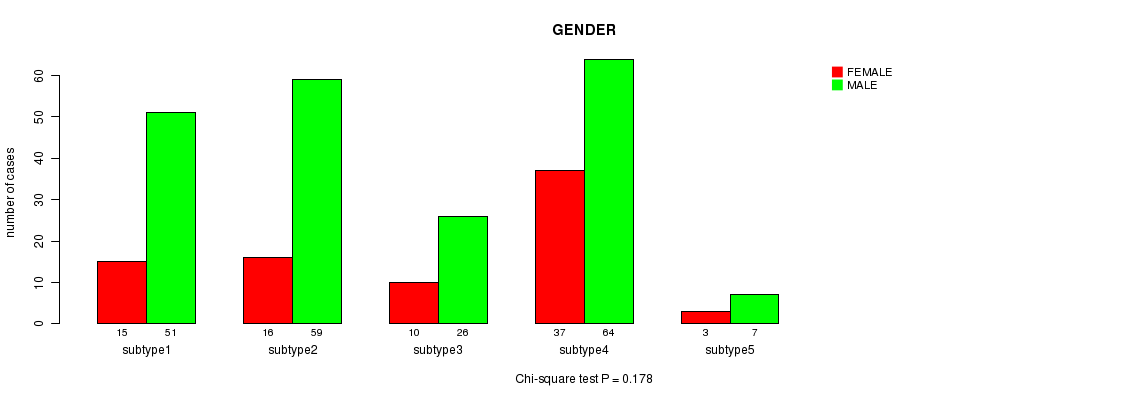
P value = 0.178 (Chi-square test)
Table S4. Clustering Approach #1: 'CN CNMF' versus Clinical Feature #3: 'GENDER'
| nPatients | FEMALE | MALE |
|---|---|---|
| ALL | 81 | 207 |
| subtype1 | 15 | 51 |
| subtype2 | 16 | 59 |
| subtype3 | 10 | 26 |
| subtype4 | 37 | 64 |
| subtype5 | 3 | 7 |
Figure S3. Get High-res Image Clustering Approach #1: 'CN CNMF' versus Clinical Feature #3: 'GENDER'
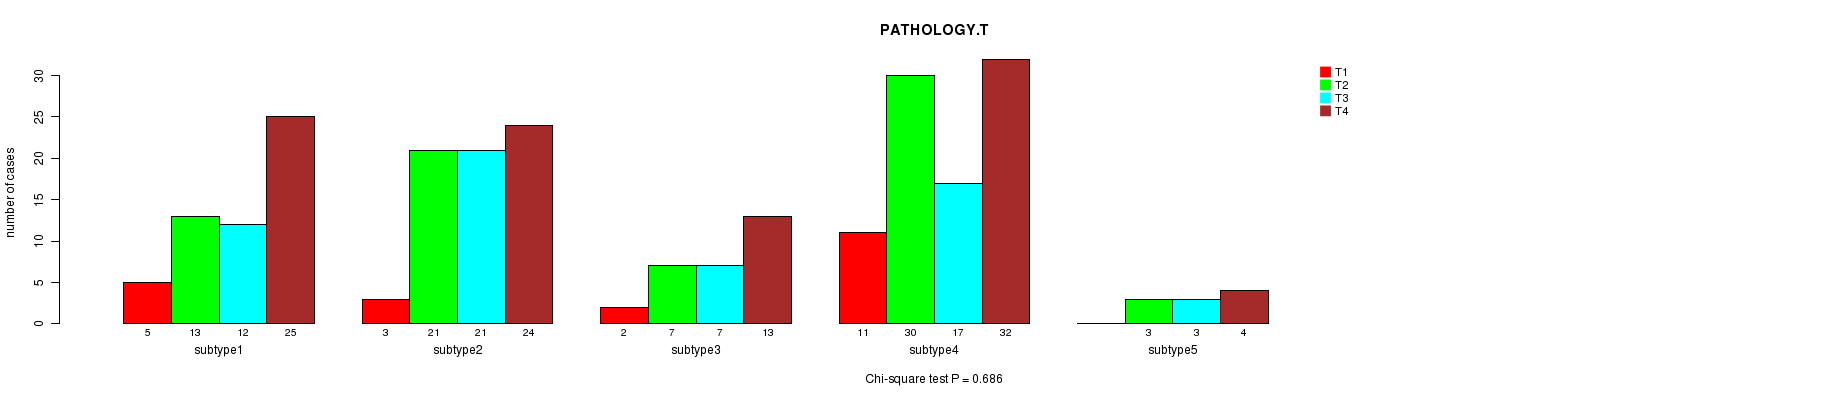
P value = 0.686 (Chi-square test)
Table S5. Clustering Approach #1: 'CN CNMF' versus Clinical Feature #4: 'PATHOLOGY.T'
| nPatients | T1 | T2 | T3 | T4 |
|---|---|---|---|---|
| ALL | 21 | 74 | 60 | 98 |
| subtype1 | 5 | 13 | 12 | 25 |
| subtype2 | 3 | 21 | 21 | 24 |
| subtype3 | 2 | 7 | 7 | 13 |
| subtype4 | 11 | 30 | 17 | 32 |
| subtype5 | 0 | 3 | 3 | 4 |
Figure S4. Get High-res Image Clustering Approach #1: 'CN CNMF' versus Clinical Feature #4: 'PATHOLOGY.T'
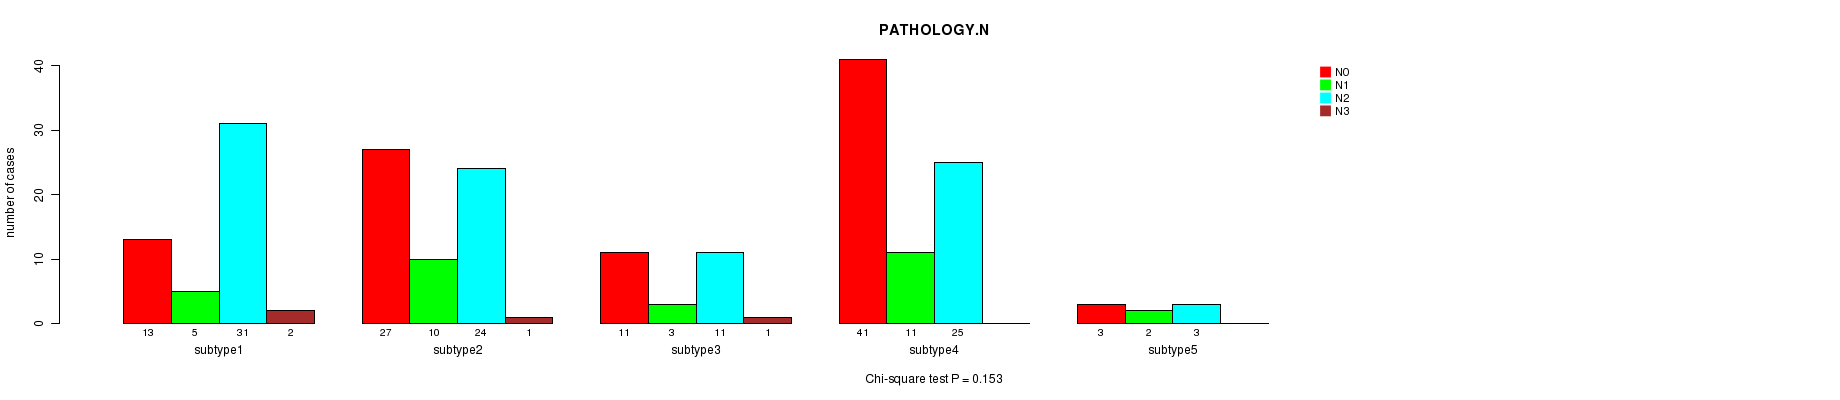
P value = 0.153 (Chi-square test)
Table S6. Clustering Approach #1: 'CN CNMF' versus Clinical Feature #5: 'PATHOLOGY.N'
| nPatients | N0 | N1 | N2 | N3 |
|---|---|---|---|---|
| ALL | 95 | 31 | 94 | 4 |
| subtype1 | 13 | 5 | 31 | 2 |
| subtype2 | 27 | 10 | 24 | 1 |
| subtype3 | 11 | 3 | 11 | 1 |
| subtype4 | 41 | 11 | 25 | 0 |
| subtype5 | 3 | 2 | 3 | 0 |
Figure S5. Get High-res Image Clustering Approach #1: 'CN CNMF' versus Clinical Feature #5: 'PATHOLOGY.N'
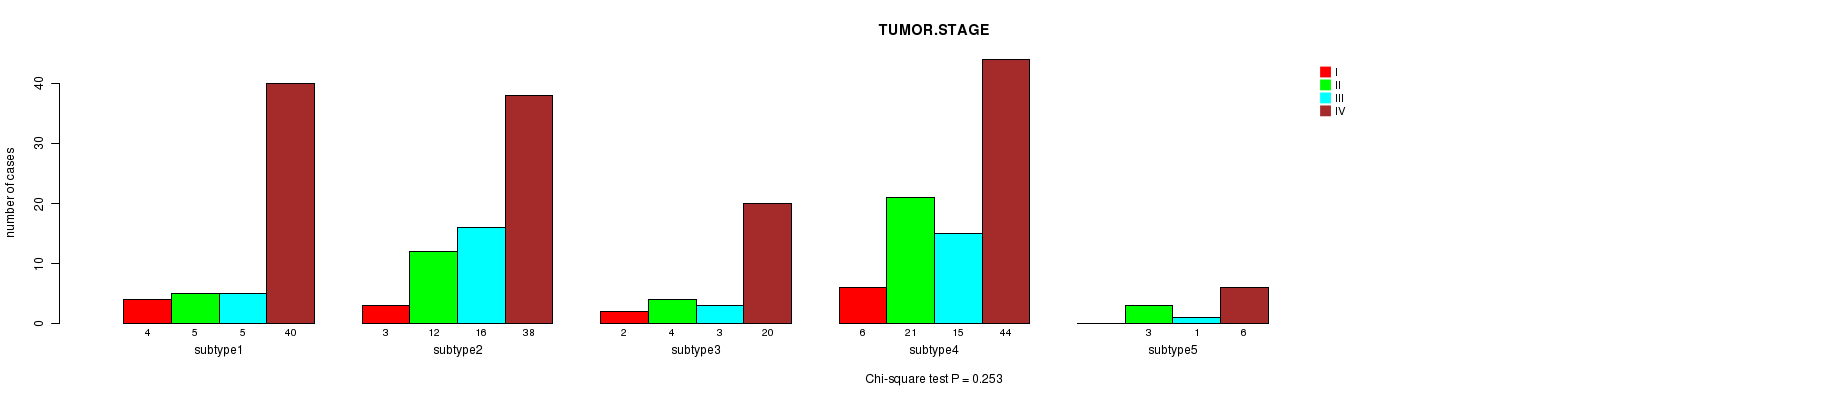
P value = 0.253 (Chi-square test)
Table S7. Clustering Approach #1: 'CN CNMF' versus Clinical Feature #6: 'TUMOR.STAGE'
| nPatients | I | II | III | IV |
|---|---|---|---|---|
| ALL | 15 | 45 | 40 | 148 |
| subtype1 | 4 | 5 | 5 | 40 |
| subtype2 | 3 | 12 | 16 | 38 |
| subtype3 | 2 | 4 | 3 | 20 |
| subtype4 | 6 | 21 | 15 | 44 |
| subtype5 | 0 | 3 | 1 | 6 |
Figure S6. Get High-res Image Clustering Approach #1: 'CN CNMF' versus Clinical Feature #6: 'TUMOR.STAGE'
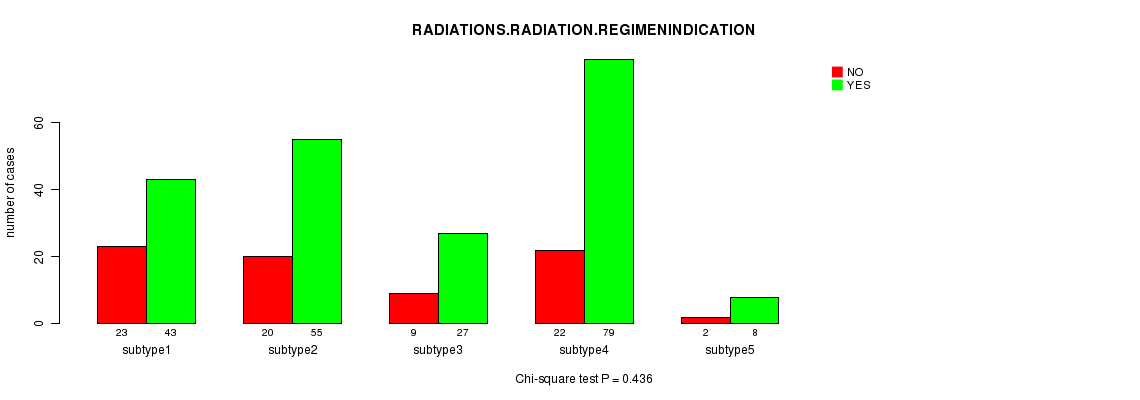
P value = 0.436 (Chi-square test)
Table S8. Clustering Approach #1: 'CN CNMF' versus Clinical Feature #7: 'RADIATIONS.RADIATION.REGIMENINDICATION'
| nPatients | NO | YES |
|---|---|---|
| ALL | 76 | 212 |
| subtype1 | 23 | 43 |
| subtype2 | 20 | 55 |
| subtype3 | 9 | 27 |
| subtype4 | 22 | 79 |
| subtype5 | 2 | 8 |
Figure S7. Get High-res Image Clustering Approach #1: 'CN CNMF' versus Clinical Feature #7: 'RADIATIONS.RADIATION.REGIMENINDICATION'
P value = 0.288 (Chi-square test)
Table S9. Clustering Approach #1: 'CN CNMF' versus Clinical Feature #8: 'NEOADJUVANT.THERAPY'
| nPatients | NO | YES |
|---|---|---|
| ALL | 47 | 241 |
| subtype1 | 16 | 50 |
| subtype2 | 13 | 62 |
| subtype3 | 5 | 31 |
| subtype4 | 12 | 89 |
| subtype5 | 1 | 9 |
Figure S8. Get High-res Image Clustering Approach #1: 'CN CNMF' versus Clinical Feature #8: 'NEOADJUVANT.THERAPY'
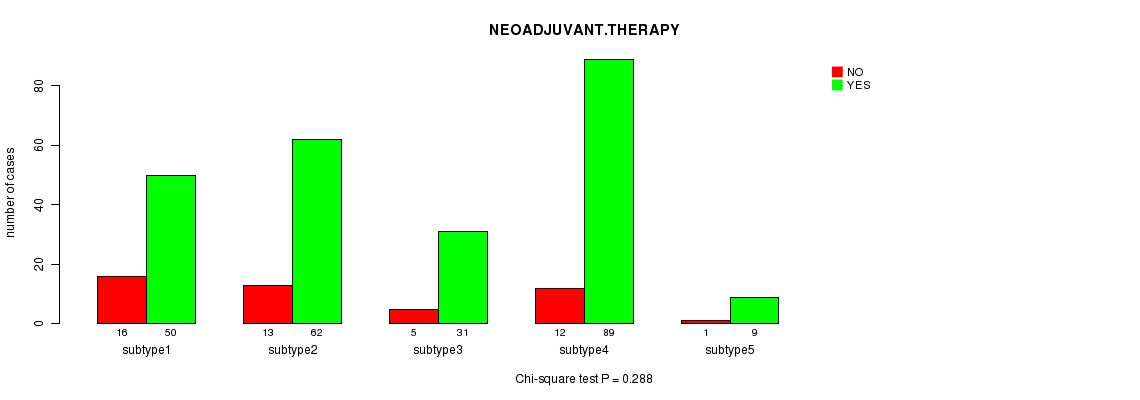
Table S10. Get Full Table Description of clustering approach #2: 'METHLYATION CNMF'
| Cluster Labels | 1 | 2 | 3 |
|---|---|---|---|
| Number of samples | 94 | 101 | 97 |
P value = 0.26 (logrank test)
Table S11. Clustering Approach #2: 'METHLYATION CNMF' versus Clinical Feature #1: 'Time to Death'
| nPatients | nDeath | Duration Range (Median), Month | |
|---|---|---|---|
| ALL | 289 | 120 | 0.1 - 210.9 (14.3) |
| subtype1 | 93 | 41 | 0.1 - 126.1 (13.0) |
| subtype2 | 101 | 39 | 0.1 - 142.5 (16.6) |
| subtype3 | 95 | 40 | 0.2 - 210.9 (13.3) |
Figure S9. Get High-res Image Clustering Approach #2: 'METHLYATION CNMF' versus Clinical Feature #1: 'Time to Death'
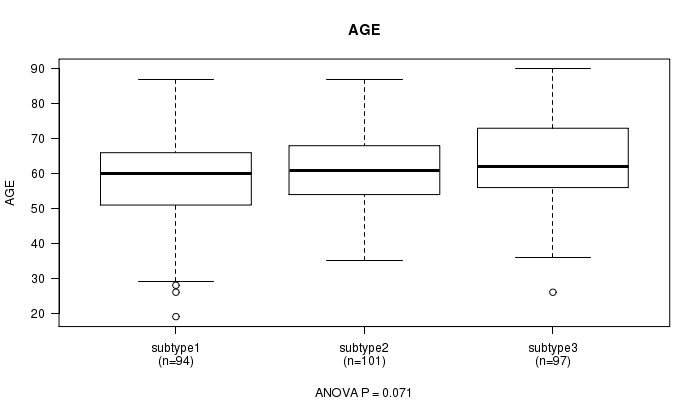
P value = 0.071 (ANOVA)
Table S12. Clustering Approach #2: 'METHLYATION CNMF' versus Clinical Feature #2: 'AGE'
| nPatients | Mean (Std.Dev) | |
|---|---|---|
| ALL | 292 | 61.3 (12.2) |
| subtype1 | 94 | 59.0 (13.2) |
| subtype2 | 101 | 61.9 (10.8) |
| subtype3 | 97 | 62.9 (12.3) |
Figure S10. Get High-res Image Clustering Approach #2: 'METHLYATION CNMF' versus Clinical Feature #2: 'AGE'
P value = 0.00615 (Fisher's exact test)
Table S13. Clustering Approach #2: 'METHLYATION CNMF' versus Clinical Feature #3: 'GENDER'
| nPatients | FEMALE | MALE |
|---|---|---|
| ALL | 82 | 210 |
| subtype1 | 20 | 74 |
| subtype2 | 23 | 78 |
| subtype3 | 39 | 58 |
Figure S11. Get High-res Image Clustering Approach #2: 'METHLYATION CNMF' versus Clinical Feature #3: 'GENDER'
P value = 0.0407 (Chi-square test)
Table S14. Clustering Approach #2: 'METHLYATION CNMF' versus Clinical Feature #4: 'PATHOLOGY.T'
| nPatients | T1 | T2 | T3 | T4 |
|---|---|---|---|---|
| ALL | 21 | 76 | 61 | 99 |
| subtype1 | 3 | 22 | 25 | 38 |
| subtype2 | 5 | 26 | 22 | 26 |
| subtype3 | 13 | 28 | 14 | 35 |
Figure S12. Get High-res Image Clustering Approach #2: 'METHLYATION CNMF' versus Clinical Feature #4: 'PATHOLOGY.T'
P value = 0.549 (Chi-square test)
Table S15. Clustering Approach #2: 'METHLYATION CNMF' versus Clinical Feature #5: 'PATHOLOGY.N'
| nPatients | N0 | N1 | N2 | N3 |
|---|---|---|---|---|
| ALL | 96 | 31 | 97 | 4 |
| subtype1 | 38 | 9 | 31 | 0 |
| subtype2 | 28 | 8 | 31 | 2 |
| subtype3 | 30 | 14 | 35 | 2 |
Figure S13. Get High-res Image Clustering Approach #2: 'METHLYATION CNMF' versus Clinical Feature #5: 'PATHOLOGY.N'
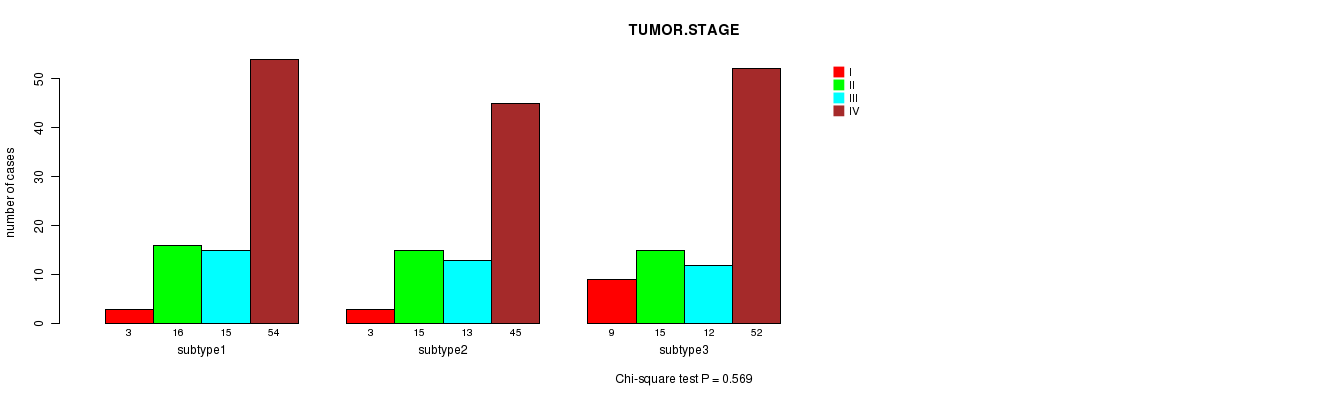
P value = 0.569 (Chi-square test)
Table S16. Clustering Approach #2: 'METHLYATION CNMF' versus Clinical Feature #6: 'TUMOR.STAGE'
| nPatients | I | II | III | IV |
|---|---|---|---|---|
| ALL | 15 | 46 | 40 | 151 |
| subtype1 | 3 | 16 | 15 | 54 |
| subtype2 | 3 | 15 | 13 | 45 |
| subtype3 | 9 | 15 | 12 | 52 |
Figure S14. Get High-res Image Clustering Approach #2: 'METHLYATION CNMF' versus Clinical Feature #6: 'TUMOR.STAGE'
P value = 0.65 (Fisher's exact test)
Table S17. Clustering Approach #2: 'METHLYATION CNMF' versus Clinical Feature #7: 'RADIATIONS.RADIATION.REGIMENINDICATION'
| nPatients | NO | YES |
|---|---|---|
| ALL | 78 | 214 |
| subtype1 | 22 | 72 |
| subtype2 | 28 | 73 |
| subtype3 | 28 | 69 |
Figure S15. Get High-res Image Clustering Approach #2: 'METHLYATION CNMF' versus Clinical Feature #7: 'RADIATIONS.RADIATION.REGIMENINDICATION'

P value = 0.922 (Fisher's exact test)
Table S18. Clustering Approach #2: 'METHLYATION CNMF' versus Clinical Feature #8: 'NEOADJUVANT.THERAPY'
| nPatients | NO | YES |
|---|---|---|
| ALL | 48 | 244 |
| subtype1 | 15 | 79 |
| subtype2 | 18 | 83 |
| subtype3 | 15 | 82 |
Figure S16. Get High-res Image Clustering Approach #2: 'METHLYATION CNMF' versus Clinical Feature #8: 'NEOADJUVANT.THERAPY'
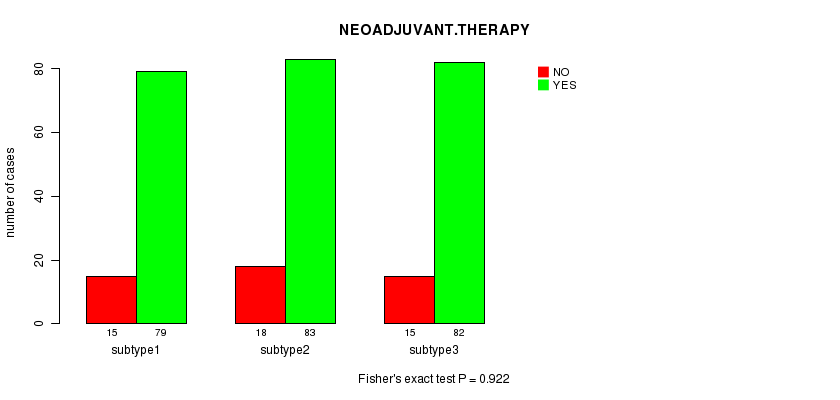
Table S19. Get Full Table Description of clustering approach #3: 'RPPA CNMF subtypes'
| Cluster Labels | 1 | 2 | 3 |
|---|---|---|---|
| Number of samples | 82 | 85 | 45 |
P value = 0.0351 (logrank test)
Table S20. Clustering Approach #3: 'RPPA CNMF subtypes' versus Clinical Feature #1: 'Time to Death'
| nPatients | nDeath | Duration Range (Median), Month | |
|---|---|---|---|
| ALL | 212 | 107 | 0.1 - 210.9 (13.2) |
| subtype1 | 82 | 42 | 1.5 - 129.2 (12.1) |
| subtype2 | 85 | 47 | 0.1 - 210.9 (13.1) |
| subtype3 | 45 | 18 | 2.1 - 156.5 (20.5) |
Figure S17. Get High-res Image Clustering Approach #3: 'RPPA CNMF subtypes' versus Clinical Feature #1: 'Time to Death'
P value = 0.434 (ANOVA)
Table S21. Clustering Approach #3: 'RPPA CNMF subtypes' versus Clinical Feature #2: 'AGE'
| nPatients | Mean (Std.Dev) | |
|---|---|---|
| ALL | 212 | 62.1 (12.2) |
| subtype1 | 82 | 61.1 (12.1) |
| subtype2 | 85 | 63.4 (12.1) |
| subtype3 | 45 | 61.4 (12.7) |
Figure S18. Get High-res Image Clustering Approach #3: 'RPPA CNMF subtypes' versus Clinical Feature #2: 'AGE'
P value = 0.139 (Fisher's exact test)
Table S22. Clustering Approach #3: 'RPPA CNMF subtypes' versus Clinical Feature #3: 'GENDER'
| nPatients | FEMALE | MALE |
|---|---|---|
| ALL | 62 | 150 |
| subtype1 | 19 | 63 |
| subtype2 | 25 | 60 |
| subtype3 | 18 | 27 |
Figure S19. Get High-res Image Clustering Approach #3: 'RPPA CNMF subtypes' versus Clinical Feature #3: 'GENDER'
P value = 0.216 (Chi-square test)
Table S23. Clustering Approach #3: 'RPPA CNMF subtypes' versus Clinical Feature #4: 'PATHOLOGY.T'
| nPatients | T1 | T2 | T3 | T4 |
|---|---|---|---|---|
| ALL | 13 | 59 | 53 | 79 |
| subtype1 | 3 | 24 | 16 | 34 |
| subtype2 | 6 | 18 | 27 | 32 |
| subtype3 | 4 | 17 | 10 | 13 |
Figure S20. Get High-res Image Clustering Approach #3: 'RPPA CNMF subtypes' versus Clinical Feature #4: 'PATHOLOGY.T'
P value = 0.0063 (Chi-square test)
Table S24. Clustering Approach #3: 'RPPA CNMF subtypes' versus Clinical Feature #5: 'PATHOLOGY.N'
| nPatients | N0 | N1 | N2 | N3 |
|---|---|---|---|---|
| ALL | 73 | 20 | 79 | 4 |
| subtype1 | 27 | 9 | 30 | 1 |
| subtype2 | 19 | 8 | 40 | 2 |
| subtype3 | 27 | 3 | 9 | 1 |
Figure S21. Get High-res Image Clustering Approach #3: 'RPPA CNMF subtypes' versus Clinical Feature #5: 'PATHOLOGY.N'
P value = 0.0532 (Chi-square test)
Table S25. Clustering Approach #3: 'RPPA CNMF subtypes' versus Clinical Feature #6: 'TUMOR.STAGE'
| nPatients | I | II | III | IV |
|---|---|---|---|---|
| ALL | 9 | 39 | 31 | 121 |
| subtype1 | 1 | 17 | 12 | 47 |
| subtype2 | 4 | 9 | 12 | 55 |
| subtype3 | 4 | 13 | 7 | 19 |
Figure S22. Get High-res Image Clustering Approach #3: 'RPPA CNMF subtypes' versus Clinical Feature #6: 'TUMOR.STAGE'
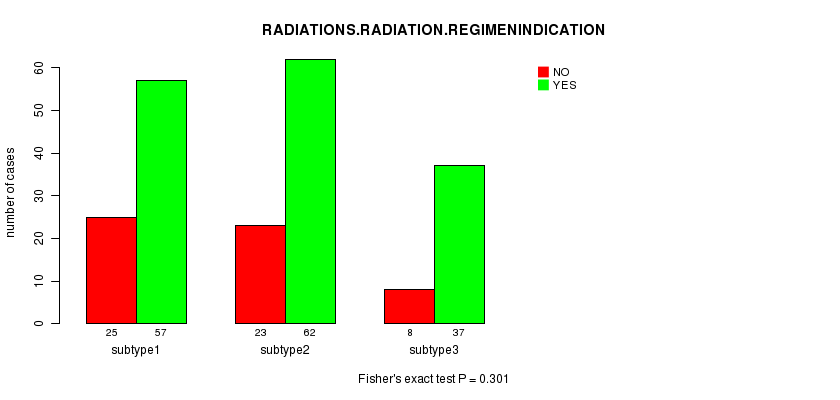
P value = 0.301 (Fisher's exact test)
Table S26. Clustering Approach #3: 'RPPA CNMF subtypes' versus Clinical Feature #7: 'RADIATIONS.RADIATION.REGIMENINDICATION'
| nPatients | NO | YES |
|---|---|---|
| ALL | 56 | 156 |
| subtype1 | 25 | 57 |
| subtype2 | 23 | 62 |
| subtype3 | 8 | 37 |
Figure S23. Get High-res Image Clustering Approach #3: 'RPPA CNMF subtypes' versus Clinical Feature #7: 'RADIATIONS.RADIATION.REGIMENINDICATION'
P value = 0.023 (Fisher's exact test)
Table S27. Clustering Approach #3: 'RPPA CNMF subtypes' versus Clinical Feature #8: 'NEOADJUVANT.THERAPY'
| nPatients | NO | YES |
|---|---|---|
| ALL | 36 | 176 |
| subtype1 | 18 | 64 |
| subtype2 | 16 | 69 |
| subtype3 | 2 | 43 |
Figure S24. Get High-res Image Clustering Approach #3: 'RPPA CNMF subtypes' versus Clinical Feature #8: 'NEOADJUVANT.THERAPY'
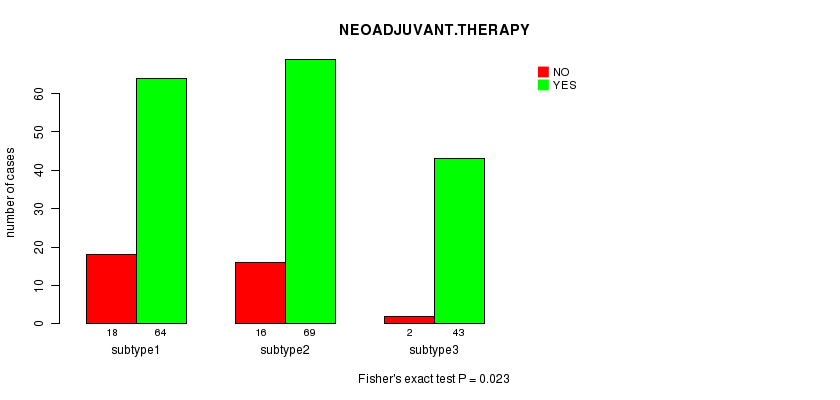
Table S28. Get Full Table Description of clustering approach #4: 'RPPA cHierClus subtypes'
| Cluster Labels | 1 | 2 | 3 |
|---|---|---|---|
| Number of samples | 115 | 81 | 16 |
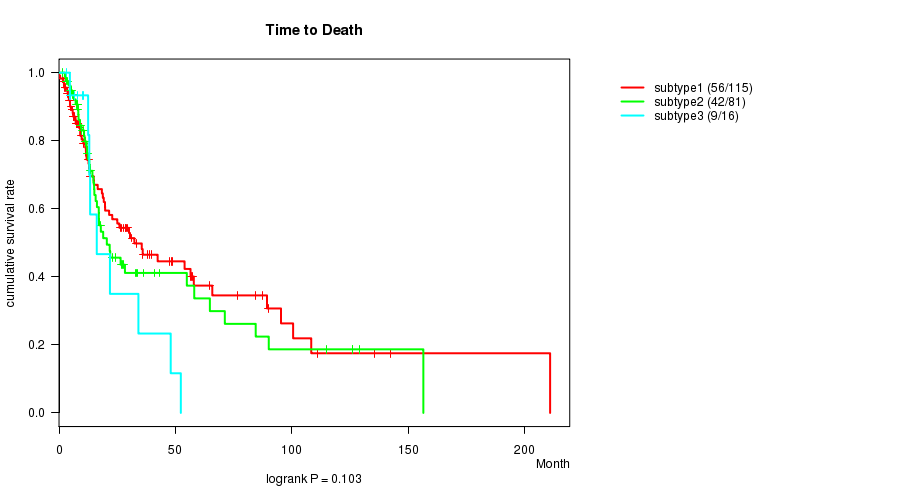
P value = 0.103 (logrank test)
Table S29. Clustering Approach #4: 'RPPA cHierClus subtypes' versus Clinical Feature #1: 'Time to Death'
| nPatients | nDeath | Duration Range (Median), Month | |
|---|---|---|---|
| ALL | 212 | 107 | 0.1 - 210.9 (13.2) |
| subtype1 | 115 | 56 | 0.1 - 210.9 (13.2) |
| subtype2 | 81 | 42 | 1.5 - 156.5 (13.6) |
| subtype3 | 16 | 9 | 3.3 - 52.3 (11.6) |
Figure S25. Get High-res Image Clustering Approach #4: 'RPPA cHierClus subtypes' versus Clinical Feature #1: 'Time to Death'
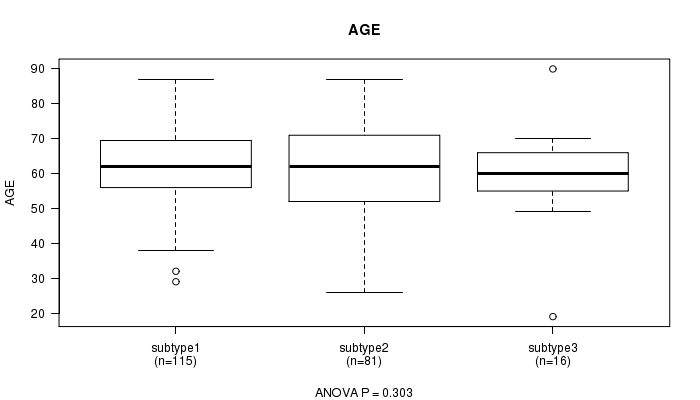
P value = 0.303 (ANOVA)
Table S30. Clustering Approach #4: 'RPPA cHierClus subtypes' versus Clinical Feature #2: 'AGE'
| nPatients | Mean (Std.Dev) | |
|---|---|---|
| ALL | 212 | 62.1 (12.2) |
| subtype1 | 115 | 63.3 (11.2) |
| subtype2 | 81 | 61.1 (13.1) |
| subtype3 | 16 | 59.4 (14.3) |
Figure S26. Get High-res Image Clustering Approach #4: 'RPPA cHierClus subtypes' versus Clinical Feature #2: 'AGE'
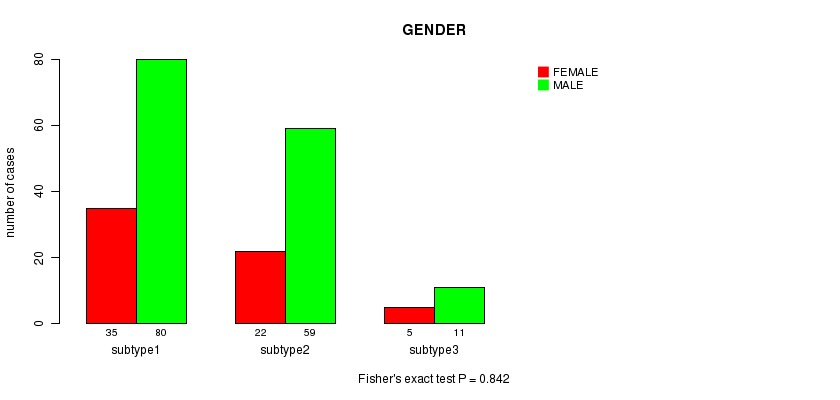
P value = 0.842 (Fisher's exact test)
Table S31. Clustering Approach #4: 'RPPA cHierClus subtypes' versus Clinical Feature #3: 'GENDER'
| nPatients | FEMALE | MALE |
|---|---|---|
| ALL | 62 | 150 |
| subtype1 | 35 | 80 |
| subtype2 | 22 | 59 |
| subtype3 | 5 | 11 |
Figure S27. Get High-res Image Clustering Approach #4: 'RPPA cHierClus subtypes' versus Clinical Feature #3: 'GENDER'
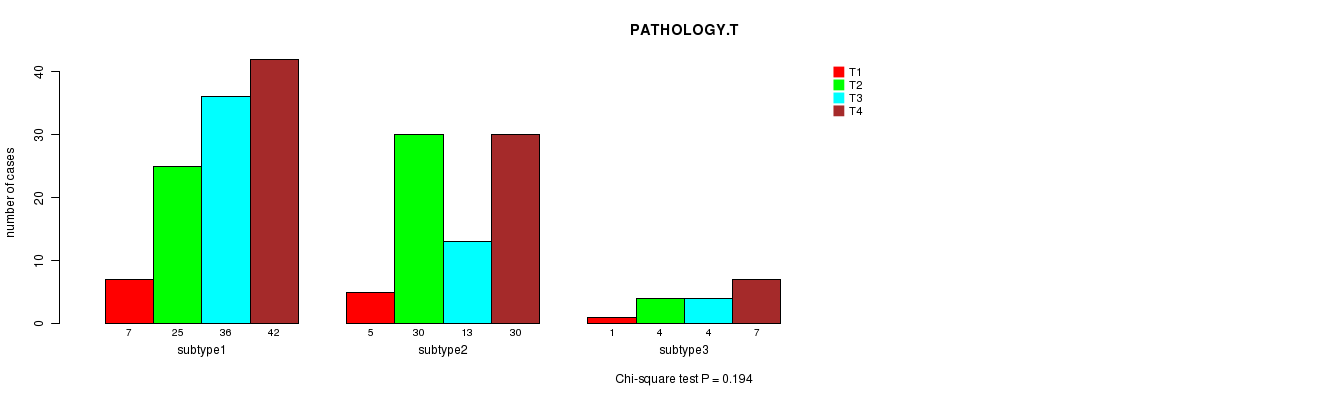
P value = 0.194 (Chi-square test)
Table S32. Clustering Approach #4: 'RPPA cHierClus subtypes' versus Clinical Feature #4: 'PATHOLOGY.T'
| nPatients | T1 | T2 | T3 | T4 |
|---|---|---|---|---|
| ALL | 13 | 59 | 53 | 79 |
| subtype1 | 7 | 25 | 36 | 42 |
| subtype2 | 5 | 30 | 13 | 30 |
| subtype3 | 1 | 4 | 4 | 7 |
Figure S28. Get High-res Image Clustering Approach #4: 'RPPA cHierClus subtypes' versus Clinical Feature #4: 'PATHOLOGY.T'
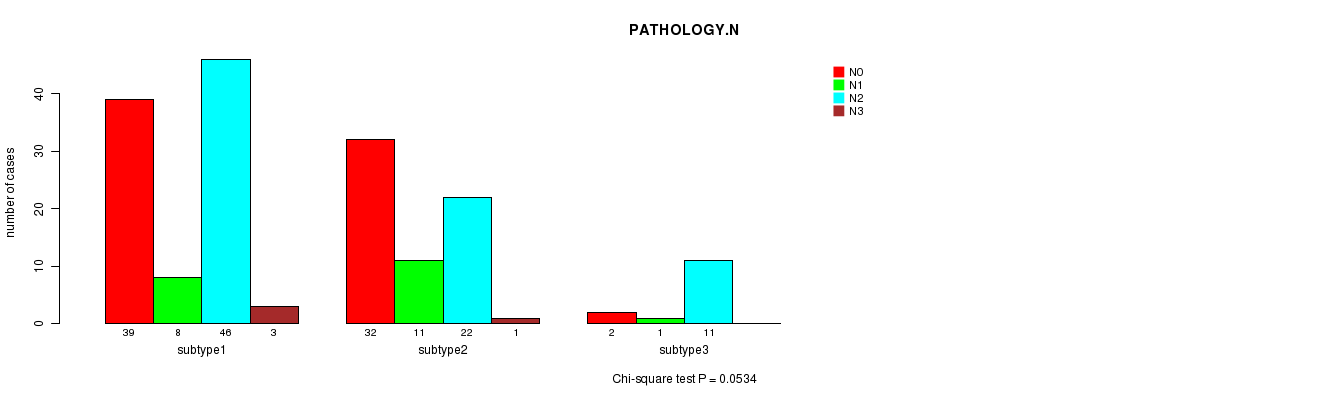
P value = 0.0534 (Chi-square test)
Table S33. Clustering Approach #4: 'RPPA cHierClus subtypes' versus Clinical Feature #5: 'PATHOLOGY.N'
| nPatients | N0 | N1 | N2 | N3 |
|---|---|---|---|---|
| ALL | 73 | 20 | 79 | 4 |
| subtype1 | 39 | 8 | 46 | 3 |
| subtype2 | 32 | 11 | 22 | 1 |
| subtype3 | 2 | 1 | 11 | 0 |
Figure S29. Get High-res Image Clustering Approach #4: 'RPPA cHierClus subtypes' versus Clinical Feature #5: 'PATHOLOGY.N'
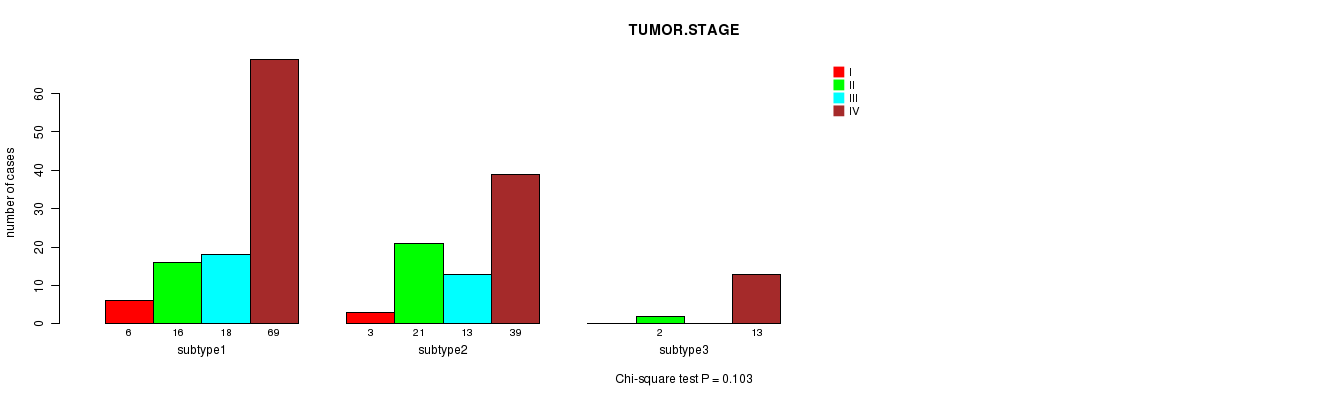
P value = 0.103 (Chi-square test)
Table S34. Clustering Approach #4: 'RPPA cHierClus subtypes' versus Clinical Feature #6: 'TUMOR.STAGE'
| nPatients | I | II | III | IV |
|---|---|---|---|---|
| ALL | 9 | 39 | 31 | 121 |
| subtype1 | 6 | 16 | 18 | 69 |
| subtype2 | 3 | 21 | 13 | 39 |
| subtype3 | 0 | 2 | 0 | 13 |
Figure S30. Get High-res Image Clustering Approach #4: 'RPPA cHierClus subtypes' versus Clinical Feature #6: 'TUMOR.STAGE'
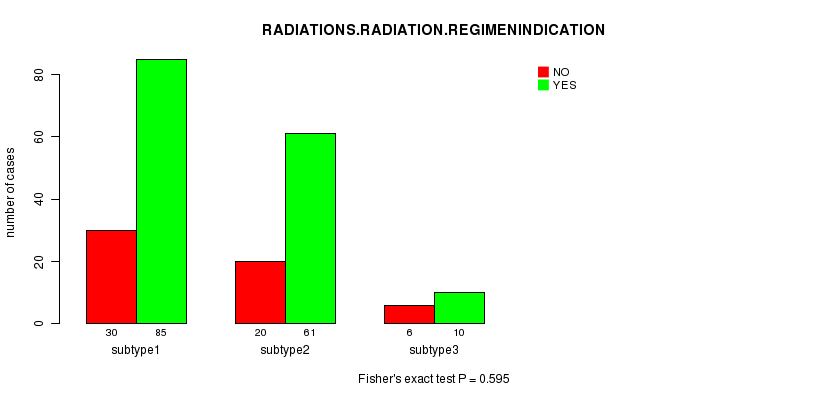
P value = 0.595 (Fisher's exact test)
Table S35. Clustering Approach #4: 'RPPA cHierClus subtypes' versus Clinical Feature #7: 'RADIATIONS.RADIATION.REGIMENINDICATION'
| nPatients | NO | YES |
|---|---|---|
| ALL | 56 | 156 |
| subtype1 | 30 | 85 |
| subtype2 | 20 | 61 |
| subtype3 | 6 | 10 |
Figure S31. Get High-res Image Clustering Approach #4: 'RPPA cHierClus subtypes' versus Clinical Feature #7: 'RADIATIONS.RADIATION.REGIMENINDICATION'
P value = 0.0821 (Fisher's exact test)
Table S36. Clustering Approach #4: 'RPPA cHierClus subtypes' versus Clinical Feature #8: 'NEOADJUVANT.THERAPY'
| nPatients | NO | YES |
|---|---|---|
| ALL | 36 | 176 |
| subtype1 | 19 | 96 |
| subtype2 | 11 | 70 |
| subtype3 | 6 | 10 |
Figure S32. Get High-res Image Clustering Approach #4: 'RPPA cHierClus subtypes' versus Clinical Feature #8: 'NEOADJUVANT.THERAPY'
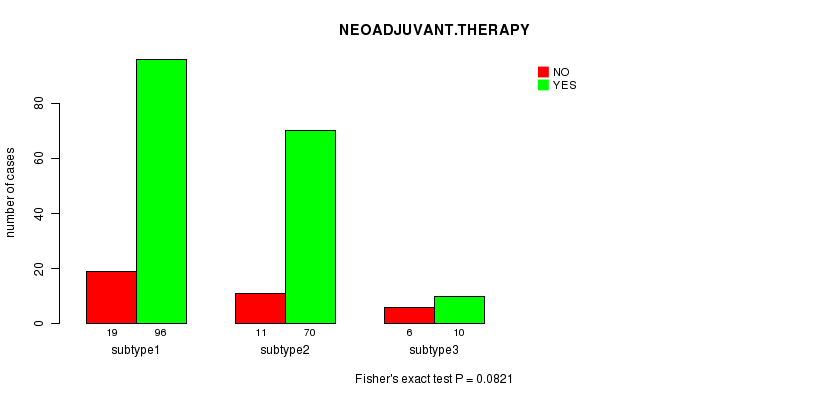
Table S37. Get Full Table Description of clustering approach #5: 'RNAseq CNMF subtypes'
| Cluster Labels | 1 | 2 | 3 |
|---|---|---|---|
| Number of samples | 107 | 88 | 91 |
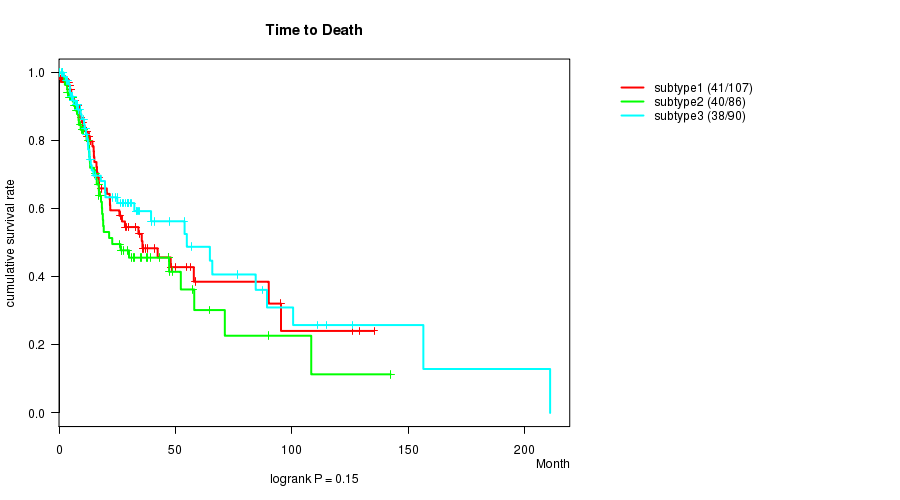
P value = 0.15 (logrank test)
Table S38. Clustering Approach #5: 'RNAseq CNMF subtypes' versus Clinical Feature #1: 'Time to Death'
| nPatients | nDeath | Duration Range (Median), Month | |
|---|---|---|---|
| ALL | 283 | 119 | 0.1 - 210.9 (14.8) |
| subtype1 | 107 | 41 | 0.1 - 135.3 (13.3) |
| subtype2 | 86 | 40 | 0.2 - 142.5 (15.7) |
| subtype3 | 90 | 38 | 0.1 - 210.9 (15.3) |
Figure S33. Get High-res Image Clustering Approach #5: 'RNAseq CNMF subtypes' versus Clinical Feature #1: 'Time to Death'
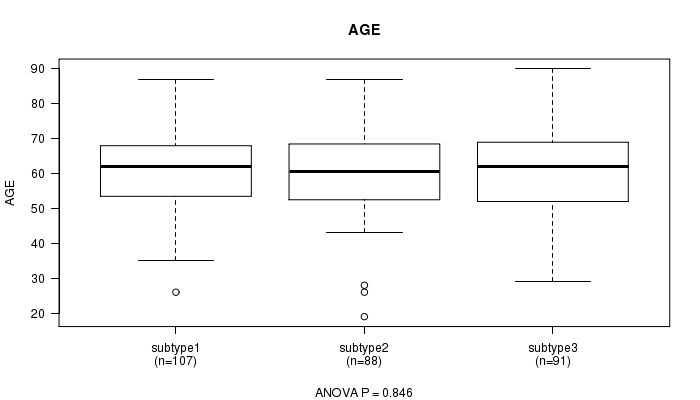
P value = 0.846 (ANOVA)
Table S39. Clustering Approach #5: 'RNAseq CNMF subtypes' versus Clinical Feature #2: 'AGE'
| nPatients | Mean (Std.Dev) | |
|---|---|---|
| ALL | 286 | 61.3 (12.2) |
| subtype1 | 107 | 61.8 (11.1) |
| subtype2 | 88 | 61.1 (12.7) |
| subtype3 | 91 | 60.9 (13.2) |
Figure S34. Get High-res Image Clustering Approach #5: 'RNAseq CNMF subtypes' versus Clinical Feature #2: 'AGE'
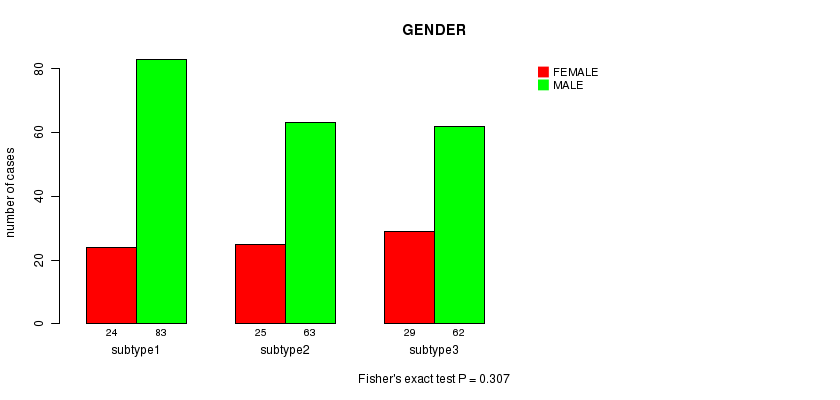
P value = 0.307 (Fisher's exact test)
Table S40. Clustering Approach #5: 'RNAseq CNMF subtypes' versus Clinical Feature #3: 'GENDER'
| nPatients | FEMALE | MALE |
|---|---|---|
| ALL | 78 | 208 |
| subtype1 | 24 | 83 |
| subtype2 | 25 | 63 |
| subtype3 | 29 | 62 |
Figure S35. Get High-res Image Clustering Approach #5: 'RNAseq CNMF subtypes' versus Clinical Feature #3: 'GENDER'
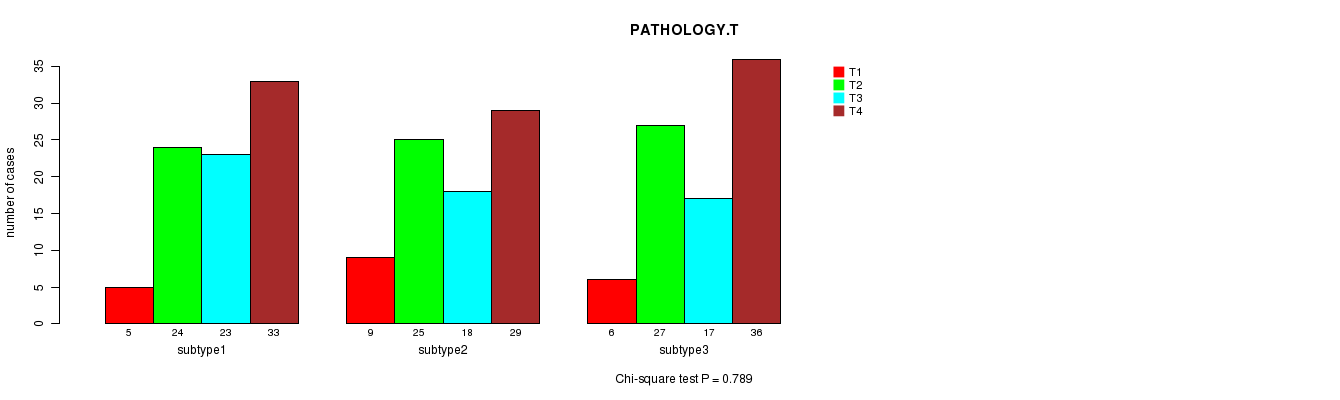
P value = 0.789 (Chi-square test)
Table S41. Clustering Approach #5: 'RNAseq CNMF subtypes' versus Clinical Feature #4: 'PATHOLOGY.T'
| nPatients | T1 | T2 | T3 | T4 |
|---|---|---|---|---|
| ALL | 20 | 76 | 58 | 98 |
| subtype1 | 5 | 24 | 23 | 33 |
| subtype2 | 9 | 25 | 18 | 29 |
| subtype3 | 6 | 27 | 17 | 36 |
Figure S36. Get High-res Image Clustering Approach #5: 'RNAseq CNMF subtypes' versus Clinical Feature #4: 'PATHOLOGY.T'
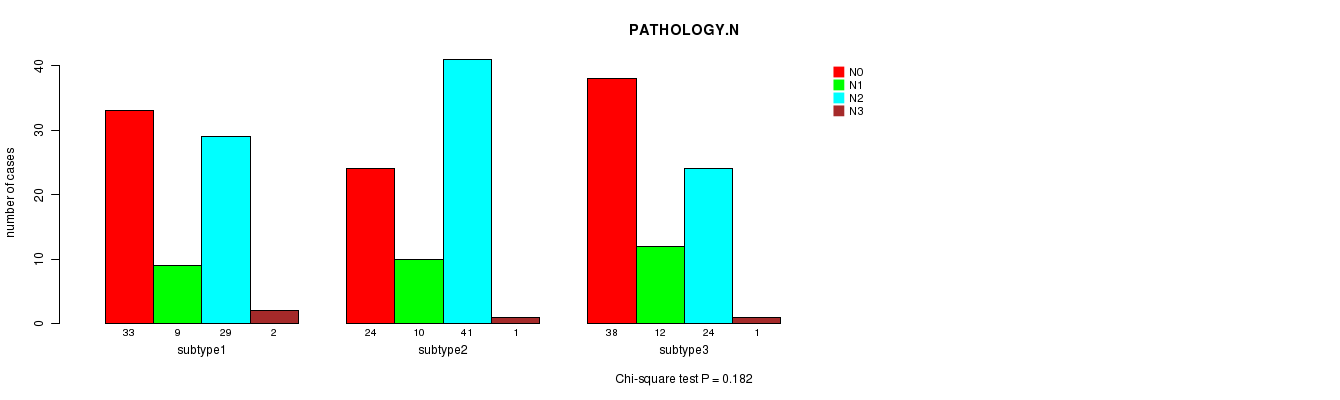
P value = 0.182 (Chi-square test)
Table S42. Clustering Approach #5: 'RNAseq CNMF subtypes' versus Clinical Feature #5: 'PATHOLOGY.N'
| nPatients | N0 | N1 | N2 | N3 |
|---|---|---|---|---|
| ALL | 95 | 31 | 94 | 4 |
| subtype1 | 33 | 9 | 29 | 2 |
| subtype2 | 24 | 10 | 41 | 1 |
| subtype3 | 38 | 12 | 24 | 1 |
Figure S37. Get High-res Image Clustering Approach #5: 'RNAseq CNMF subtypes' versus Clinical Feature #5: 'PATHOLOGY.N'
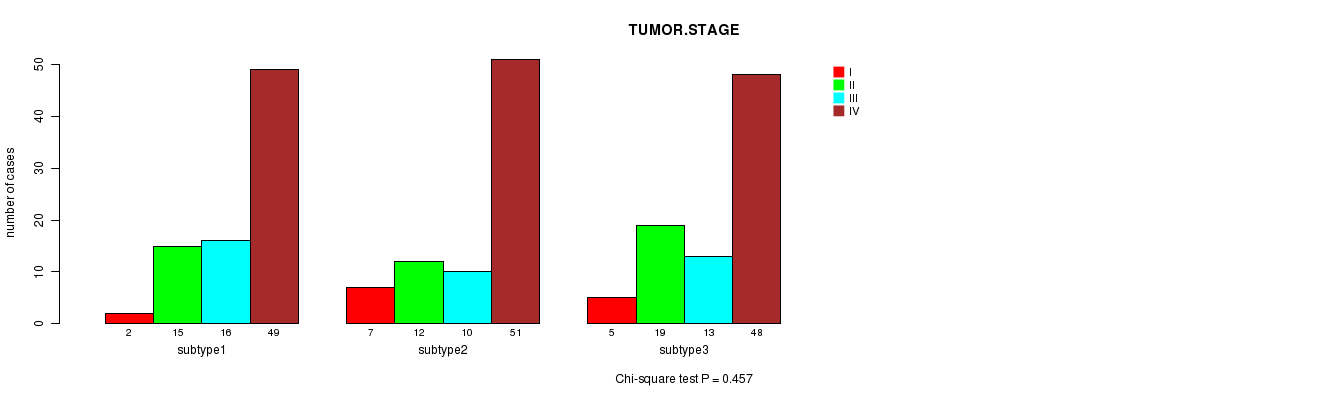
P value = 0.457 (Chi-square test)
Table S43. Clustering Approach #5: 'RNAseq CNMF subtypes' versus Clinical Feature #6: 'TUMOR.STAGE'
| nPatients | I | II | III | IV |
|---|---|---|---|---|
| ALL | 14 | 46 | 39 | 148 |
| subtype1 | 2 | 15 | 16 | 49 |
| subtype2 | 7 | 12 | 10 | 51 |
| subtype3 | 5 | 19 | 13 | 48 |
Figure S38. Get High-res Image Clustering Approach #5: 'RNAseq CNMF subtypes' versus Clinical Feature #6: 'TUMOR.STAGE'
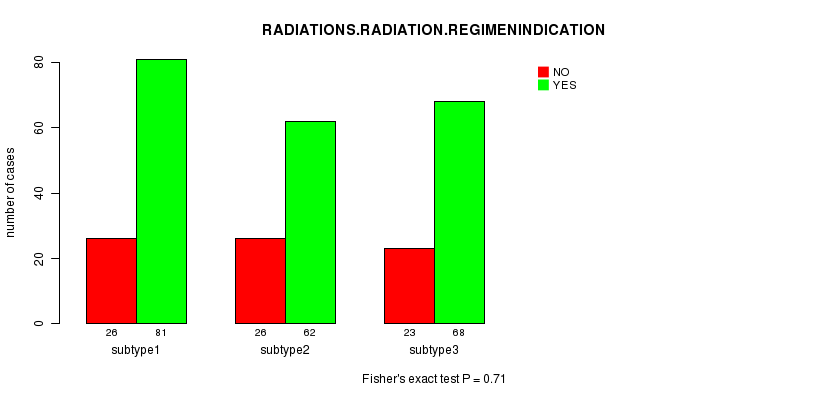
P value = 0.71 (Fisher's exact test)
Table S44. Clustering Approach #5: 'RNAseq CNMF subtypes' versus Clinical Feature #7: 'RADIATIONS.RADIATION.REGIMENINDICATION'
| nPatients | NO | YES |
|---|---|---|
| ALL | 75 | 211 |
| subtype1 | 26 | 81 |
| subtype2 | 26 | 62 |
| subtype3 | 23 | 68 |
Figure S39. Get High-res Image Clustering Approach #5: 'RNAseq CNMF subtypes' versus Clinical Feature #7: 'RADIATIONS.RADIATION.REGIMENINDICATION'
P value = 0.218 (Fisher's exact test)
Table S45. Clustering Approach #5: 'RNAseq CNMF subtypes' versus Clinical Feature #8: 'NEOADJUVANT.THERAPY'
| nPatients | NO | YES |
|---|---|---|
| ALL | 46 | 240 |
| subtype1 | 18 | 89 |
| subtype2 | 18 | 70 |
| subtype3 | 10 | 81 |
Figure S40. Get High-res Image Clustering Approach #5: 'RNAseq CNMF subtypes' versus Clinical Feature #8: 'NEOADJUVANT.THERAPY'
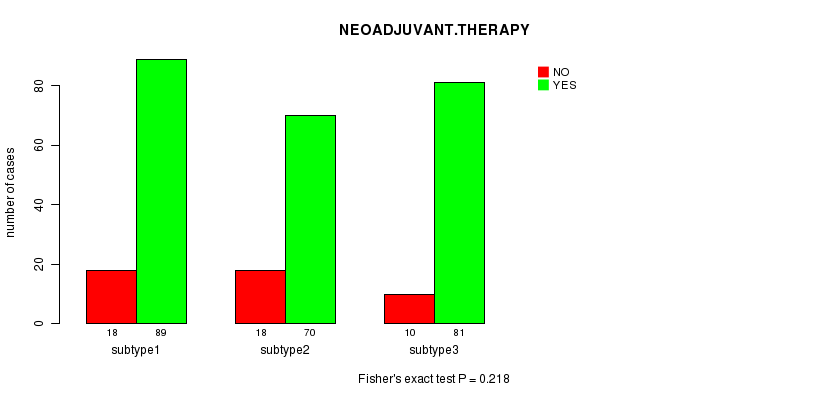
Table S46. Get Full Table Description of clustering approach #6: 'RNAseq cHierClus subtypes'
| Cluster Labels | 1 | 2 | 3 |
|---|---|---|---|
| Number of samples | 86 | 101 | 99 |
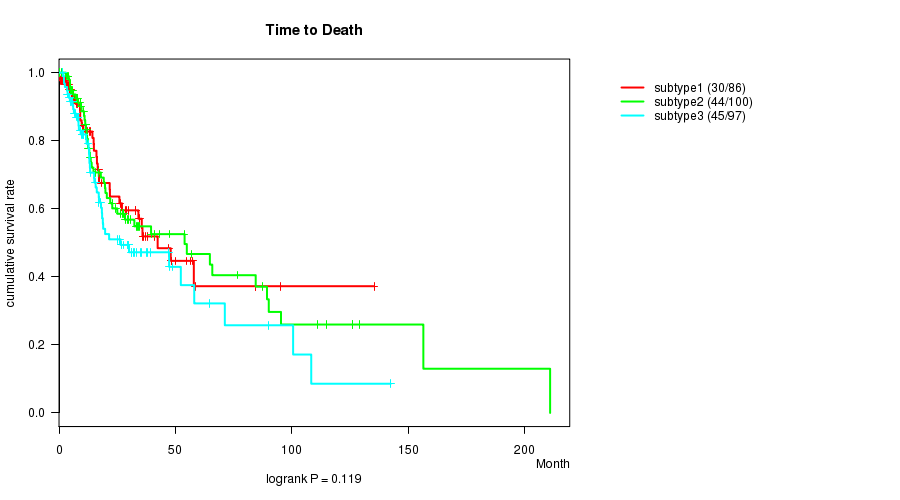
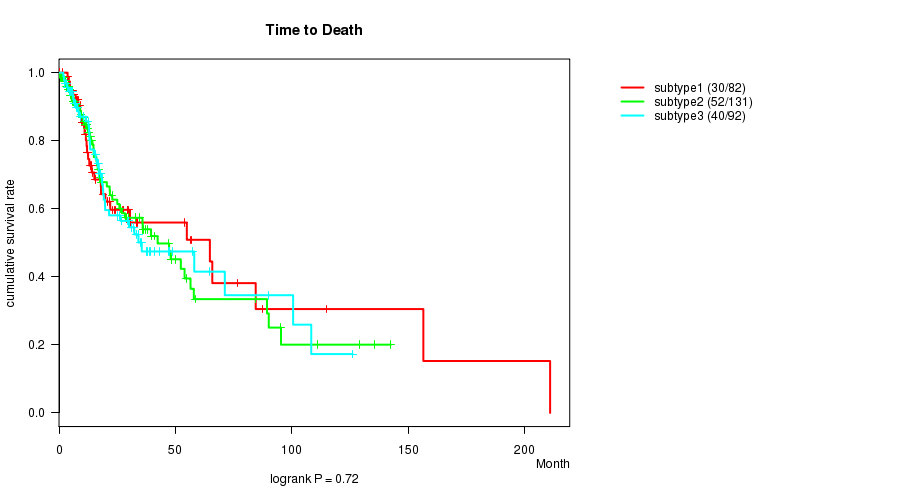
P value = 0.119 (logrank test)
Table S47. Clustering Approach #6: 'RNAseq cHierClus subtypes' versus Clinical Feature #1: 'Time to Death'
| nPatients | nDeath | Duration Range (Median), Month | |
|---|---|---|---|
| ALL | 283 | 119 | 0.1 - 210.9 (14.8) |
| subtype1 | 86 | 30 | 0.1 - 135.3 (14.6) |
| subtype2 | 100 | 44 | 0.1 - 210.9 (14.4) |
| subtype3 | 97 | 45 | 1.5 - 142.5 (15.1) |
Figure S41. Get High-res Image Clustering Approach #6: 'RNAseq cHierClus subtypes' versus Clinical Feature #1: 'Time to Death'
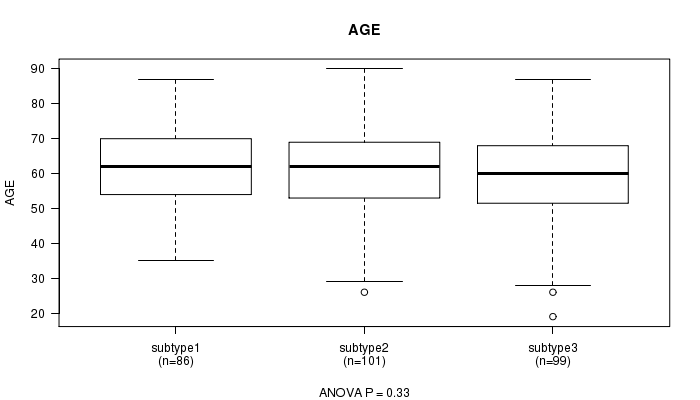
P value = 0.33 (ANOVA)
Table S48. Clustering Approach #6: 'RNAseq cHierClus subtypes' versus Clinical Feature #2: 'AGE'
| nPatients | Mean (Std.Dev) | |
|---|---|---|
| ALL | 286 | 61.3 (12.2) |
| subtype1 | 86 | 62.6 (10.8) |
| subtype2 | 101 | 61.5 (12.4) |
| subtype3 | 99 | 59.9 (13.2) |
Figure S42. Get High-res Image Clustering Approach #6: 'RNAseq cHierClus subtypes' versus Clinical Feature #2: 'AGE'
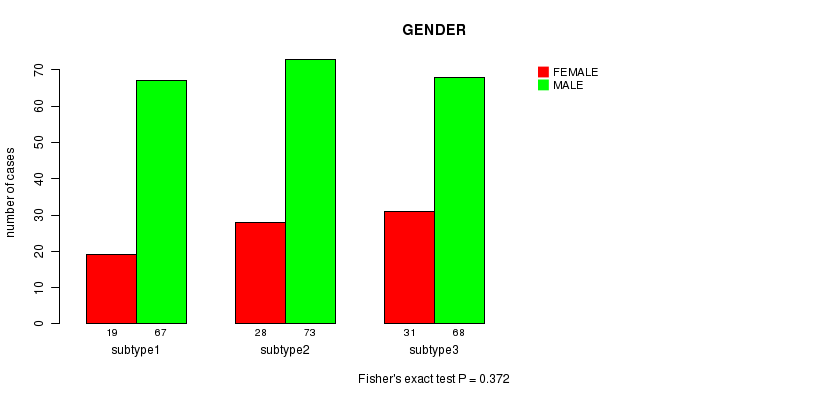
P value = 0.372 (Fisher's exact test)
Table S49. Clustering Approach #6: 'RNAseq cHierClus subtypes' versus Clinical Feature #3: 'GENDER'
| nPatients | FEMALE | MALE |
|---|---|---|
| ALL | 78 | 208 |
| subtype1 | 19 | 67 |
| subtype2 | 28 | 73 |
| subtype3 | 31 | 68 |
Figure S43. Get High-res Image Clustering Approach #6: 'RNAseq cHierClus subtypes' versus Clinical Feature #3: 'GENDER'
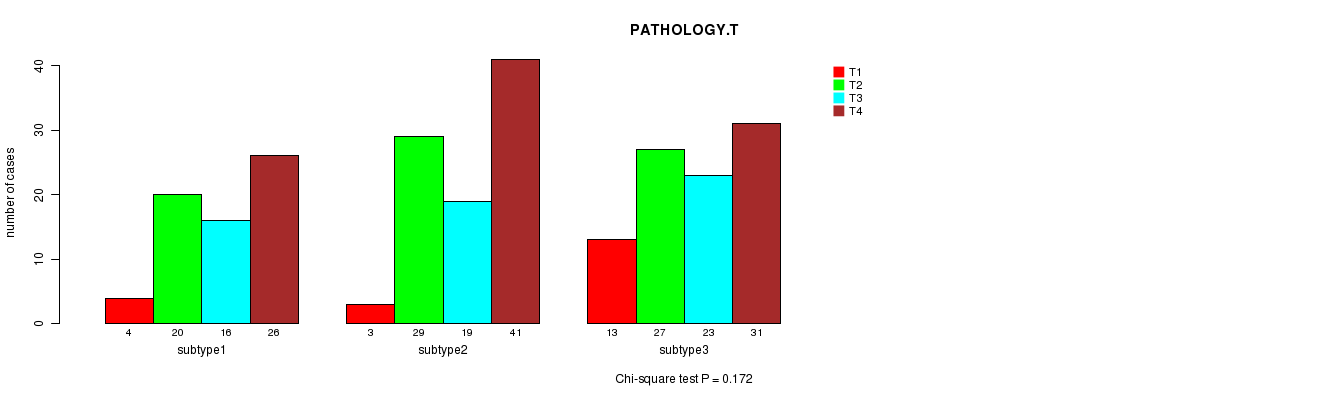
P value = 0.172 (Chi-square test)
Table S50. Clustering Approach #6: 'RNAseq cHierClus subtypes' versus Clinical Feature #4: 'PATHOLOGY.T'
| nPatients | T1 | T2 | T3 | T4 |
|---|---|---|---|---|
| ALL | 20 | 76 | 58 | 98 |
| subtype1 | 4 | 20 | 16 | 26 |
| subtype2 | 3 | 29 | 19 | 41 |
| subtype3 | 13 | 27 | 23 | 31 |
Figure S44. Get High-res Image Clustering Approach #6: 'RNAseq cHierClus subtypes' versus Clinical Feature #4: 'PATHOLOGY.T'
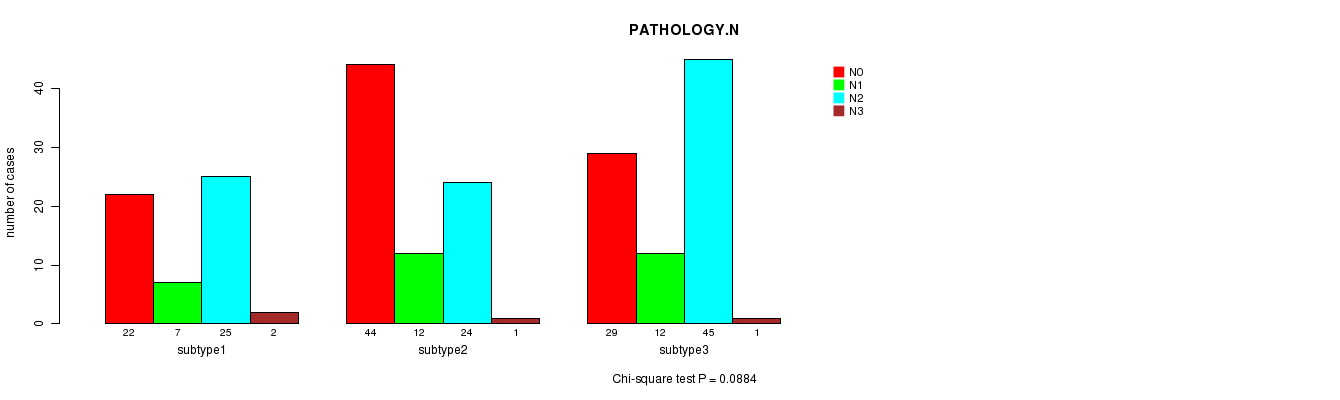
P value = 0.0884 (Chi-square test)
Table S51. Clustering Approach #6: 'RNAseq cHierClus subtypes' versus Clinical Feature #5: 'PATHOLOGY.N'
| nPatients | N0 | N1 | N2 | N3 |
|---|---|---|---|---|
| ALL | 95 | 31 | 94 | 4 |
| subtype1 | 22 | 7 | 25 | 2 |
| subtype2 | 44 | 12 | 24 | 1 |
| subtype3 | 29 | 12 | 45 | 1 |
Figure S45. Get High-res Image Clustering Approach #6: 'RNAseq cHierClus subtypes' versus Clinical Feature #5: 'PATHOLOGY.N'
P value = 0.361 (Chi-square test)
Table S52. Clustering Approach #6: 'RNAseq cHierClus subtypes' versus Clinical Feature #6: 'TUMOR.STAGE'
| nPatients | I | II | III | IV |
|---|---|---|---|---|
| ALL | 14 | 46 | 39 | 148 |
| subtype1 | 2 | 12 | 9 | 40 |
| subtype2 | 3 | 20 | 17 | 51 |
| subtype3 | 9 | 14 | 13 | 57 |
Figure S46. Get High-res Image Clustering Approach #6: 'RNAseq cHierClus subtypes' versus Clinical Feature #6: 'TUMOR.STAGE'
P value = 0.441 (Fisher's exact test)
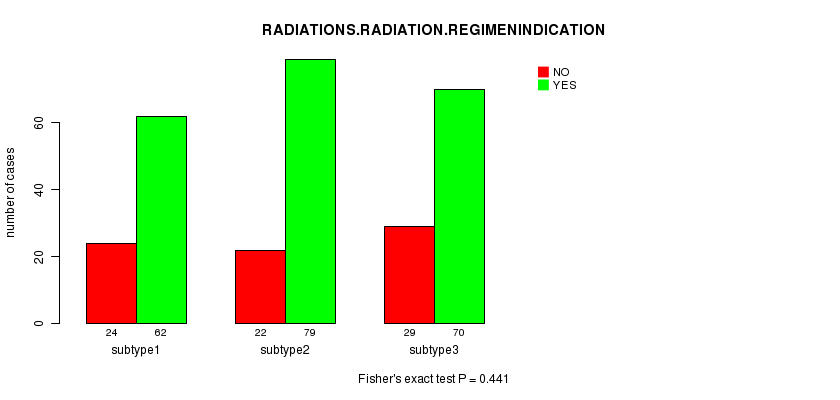
Table S53. Clustering Approach #6: 'RNAseq cHierClus subtypes' versus Clinical Feature #7: 'RADIATIONS.RADIATION.REGIMENINDICATION'
| nPatients | NO | YES |
|---|---|---|
| ALL | 75 | 211 |
| subtype1 | 24 | 62 |
| subtype2 | 22 | 79 |
| subtype3 | 29 | 70 |
Figure S47. Get High-res Image Clustering Approach #6: 'RNAseq cHierClus subtypes' versus Clinical Feature #7: 'RADIATIONS.RADIATION.REGIMENINDICATION'
P value = 0.0304 (Fisher's exact test)
Table S54. Clustering Approach #6: 'RNAseq cHierClus subtypes' versus Clinical Feature #8: 'NEOADJUVANT.THERAPY'
| nPatients | NO | YES |
|---|---|---|
| ALL | 46 | 240 |
| subtype1 | 15 | 71 |
| subtype2 | 9 | 92 |
| subtype3 | 22 | 77 |
Figure S48. Get High-res Image Clustering Approach #6: 'RNAseq cHierClus subtypes' versus Clinical Feature #8: 'NEOADJUVANT.THERAPY'
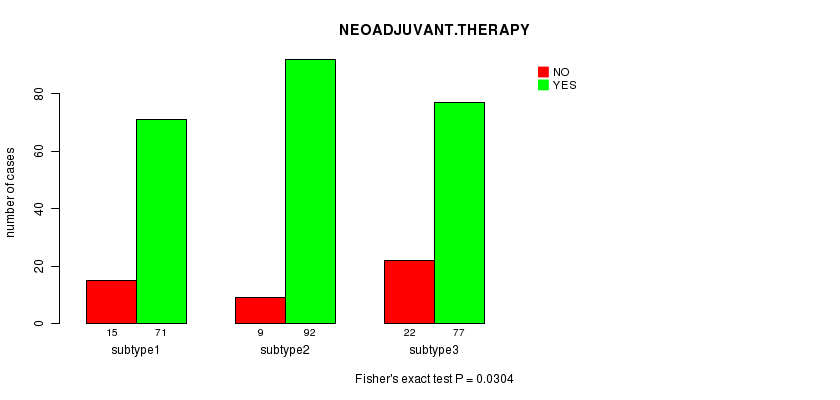
Table S55. Get Full Table Description of clustering approach #7: 'MIRseq CNMF subtypes'
| Cluster Labels | 1 | 2 | 3 |
|---|---|---|---|
| Number of samples | 83 | 131 | 94 |
P value = 0.72 (logrank test)
Table S56. Clustering Approach #7: 'MIRseq CNMF subtypes' versus Clinical Feature #1: 'Time to Death'
| nPatients | nDeath | Duration Range (Median), Month | |
|---|---|---|---|
| ALL | 305 | 122 | 0.1 - 210.9 (15.0) |
| subtype1 | 82 | 30 | 0.1 - 210.9 (12.1) |
| subtype2 | 131 | 52 | 0.1 - 142.5 (14.3) |
| subtype3 | 92 | 40 | 1.8 - 126.1 (18.1) |
Figure S49. Get High-res Image Clustering Approach #7: 'MIRseq CNMF subtypes' versus Clinical Feature #1: 'Time to Death'
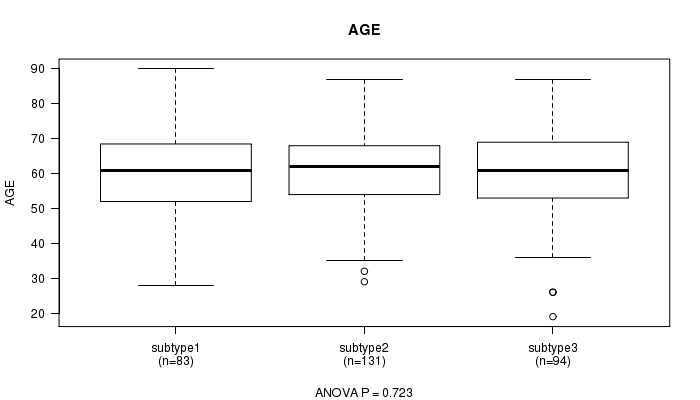
P value = 0.723 (ANOVA)
Table S57. Clustering Approach #7: 'MIRseq CNMF subtypes' versus Clinical Feature #2: 'AGE'
| nPatients | Mean (Std.Dev) | |
|---|---|---|
| ALL | 308 | 61.1 (12.1) |
| subtype1 | 83 | 60.4 (12.5) |
| subtype2 | 131 | 61.7 (11.4) |
| subtype3 | 94 | 60.9 (12.7) |
Figure S50. Get High-res Image Clustering Approach #7: 'MIRseq CNMF subtypes' versus Clinical Feature #2: 'AGE'
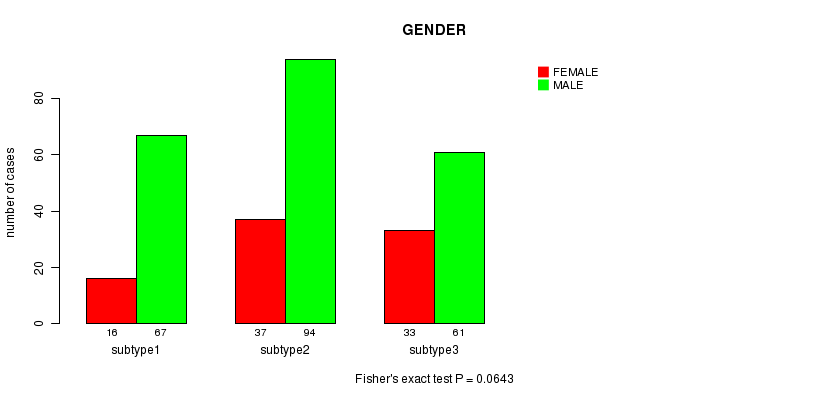
P value = 0.0643 (Fisher's exact test)
Table S58. Clustering Approach #7: 'MIRseq CNMF subtypes' versus Clinical Feature #3: 'GENDER'
| nPatients | FEMALE | MALE |
|---|---|---|
| ALL | 86 | 222 |
| subtype1 | 16 | 67 |
| subtype2 | 37 | 94 |
| subtype3 | 33 | 61 |
Figure S51. Get High-res Image Clustering Approach #7: 'MIRseq CNMF subtypes' versus Clinical Feature #3: 'GENDER'
P value = 0.121 (Chi-square test)
Table S59. Clustering Approach #7: 'MIRseq CNMF subtypes' versus Clinical Feature #4: 'PATHOLOGY.T'
| nPatients | T1 | T2 | T3 | T4 |
|---|---|---|---|---|
| ALL | 24 | 78 | 62 | 103 |
| subtype1 | 5 | 23 | 11 | 30 |
| subtype2 | 7 | 26 | 29 | 47 |
| subtype3 | 12 | 29 | 22 | 26 |
Figure S52. Get High-res Image Clustering Approach #7: 'MIRseq CNMF subtypes' versus Clinical Feature #4: 'PATHOLOGY.T'
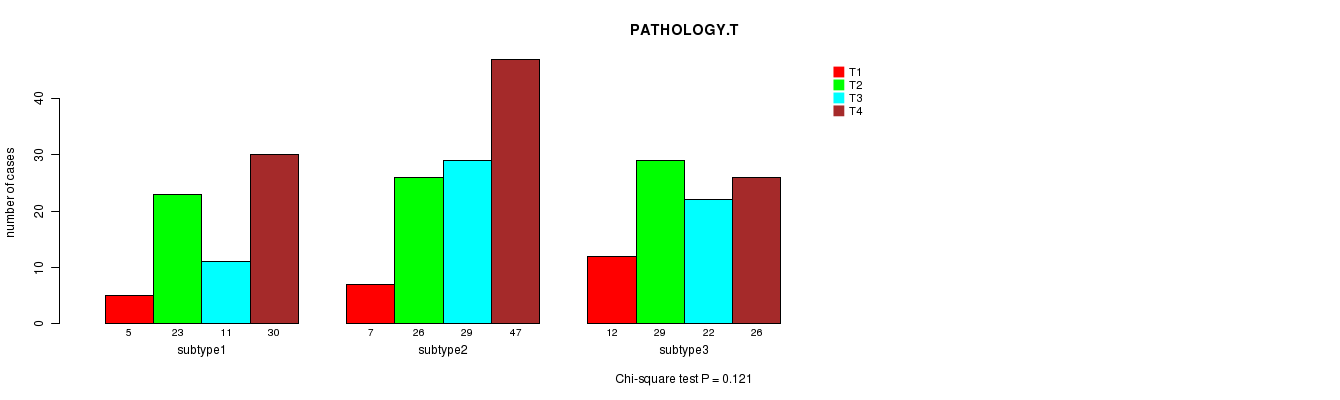
P value = 0.109 (Chi-square test)
Table S60. Clustering Approach #7: 'MIRseq CNMF subtypes' versus Clinical Feature #5: 'PATHOLOGY.N'
| nPatients | N0 | N1 | N2 | N3 |
|---|---|---|---|---|
| ALL | 99 | 32 | 101 | 5 |
| subtype1 | 30 | 8 | 21 | 2 |
| subtype2 | 44 | 9 | 41 | 3 |
| subtype3 | 25 | 15 | 39 | 0 |
Figure S53. Get High-res Image Clustering Approach #7: 'MIRseq CNMF subtypes' versus Clinical Feature #5: 'PATHOLOGY.N'
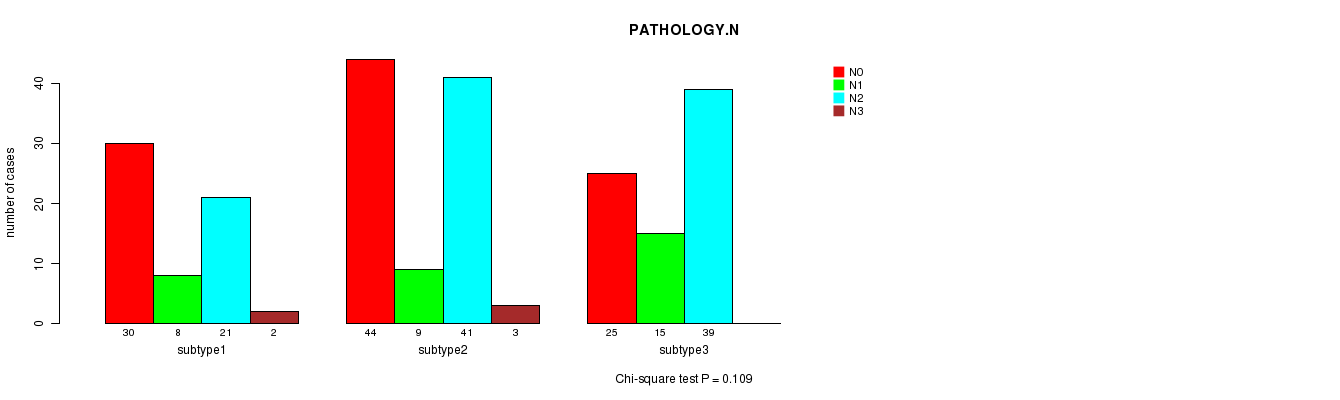
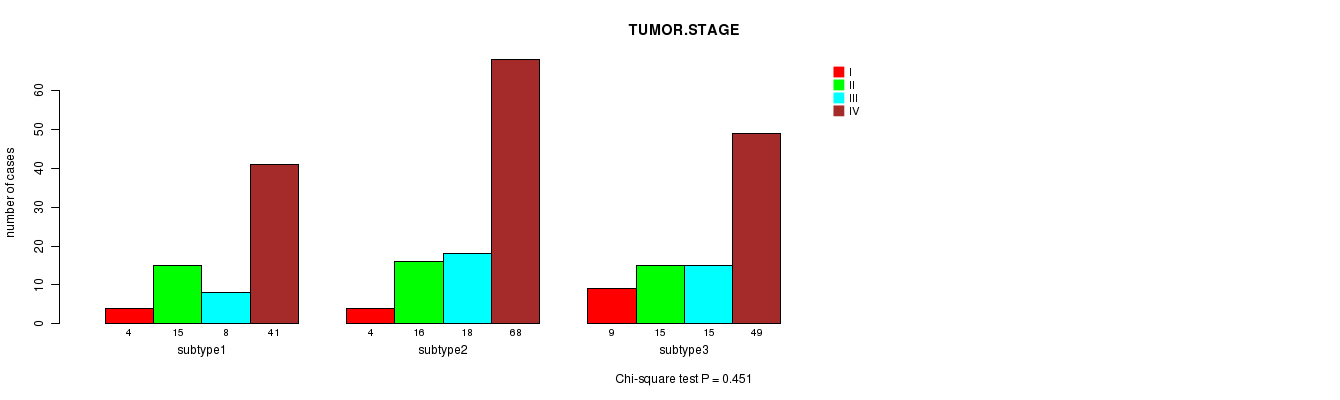
P value = 0.451 (Chi-square test)
Table S61. Clustering Approach #7: 'MIRseq CNMF subtypes' versus Clinical Feature #6: 'TUMOR.STAGE'
| nPatients | I | II | III | IV |
|---|---|---|---|---|
| ALL | 17 | 46 | 41 | 158 |
| subtype1 | 4 | 15 | 8 | 41 |
| subtype2 | 4 | 16 | 18 | 68 |
| subtype3 | 9 | 15 | 15 | 49 |
Figure S54. Get High-res Image Clustering Approach #7: 'MIRseq CNMF subtypes' versus Clinical Feature #6: 'TUMOR.STAGE'
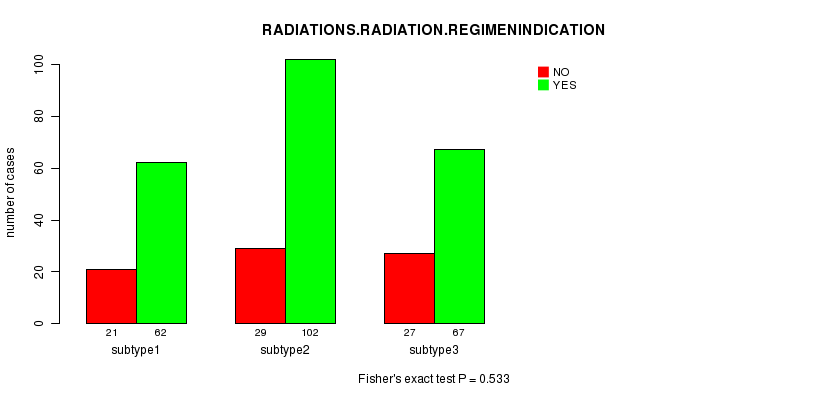
P value = 0.533 (Fisher's exact test)
Table S62. Clustering Approach #7: 'MIRseq CNMF subtypes' versus Clinical Feature #7: 'RADIATIONS.RADIATION.REGIMENINDICATION'
| nPatients | NO | YES |
|---|---|---|
| ALL | 77 | 231 |
| subtype1 | 21 | 62 |
| subtype2 | 29 | 102 |
| subtype3 | 27 | 67 |
Figure S55. Get High-res Image Clustering Approach #7: 'MIRseq CNMF subtypes' versus Clinical Feature #7: 'RADIATIONS.RADIATION.REGIMENINDICATION'
P value = 0.689 (Fisher's exact test)
Table S63. Clustering Approach #7: 'MIRseq CNMF subtypes' versus Clinical Feature #8: 'NEOADJUVANT.THERAPY'
| nPatients | NO | YES |
|---|---|---|
| ALL | 48 | 260 |
| subtype1 | 11 | 72 |
| subtype2 | 20 | 111 |
| subtype3 | 17 | 77 |
Figure S56. Get High-res Image Clustering Approach #7: 'MIRseq CNMF subtypes' versus Clinical Feature #8: 'NEOADJUVANT.THERAPY'
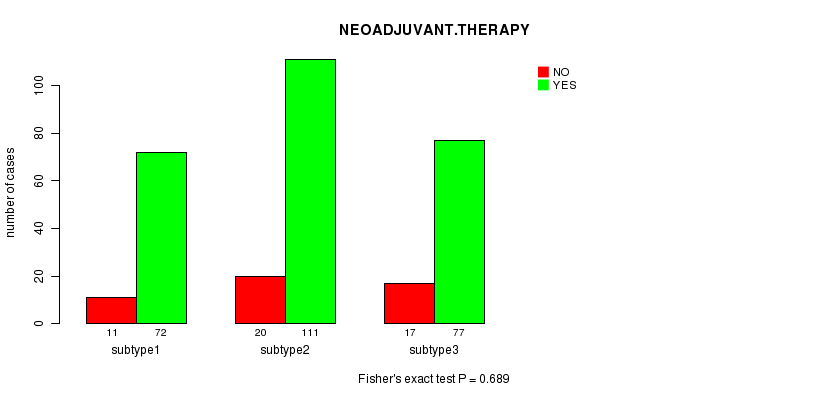
Table S64. Get Full Table Description of clustering approach #8: 'MIRseq cHierClus subtypes'
| Cluster Labels | 1 | 2 | 3 | 4 |
|---|---|---|---|---|
| Number of samples | 13 | 12 | 167 | 116 |
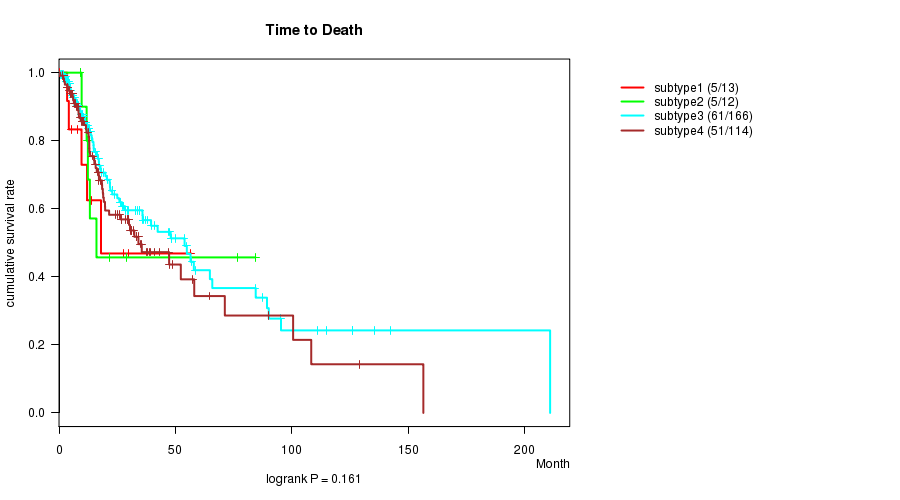
P value = 0.161 (logrank test)
Table S65. Clustering Approach #8: 'MIRseq cHierClus subtypes' versus Clinical Feature #1: 'Time to Death'
| nPatients | nDeath | Duration Range (Median), Month | |
|---|---|---|---|
| ALL | 305 | 122 | 0.1 - 210.9 (15.0) |
| subtype1 | 13 | 5 | 0.2 - 56.7 (12.0) |
| subtype2 | 12 | 5 | 9.0 - 84.4 (12.8) |
| subtype3 | 166 | 61 | 0.1 - 210.9 (14.0) |
| subtype4 | 114 | 51 | 0.5 - 156.5 (17.1) |
Figure S57. Get High-res Image Clustering Approach #8: 'MIRseq cHierClus subtypes' versus Clinical Feature #1: 'Time to Death'
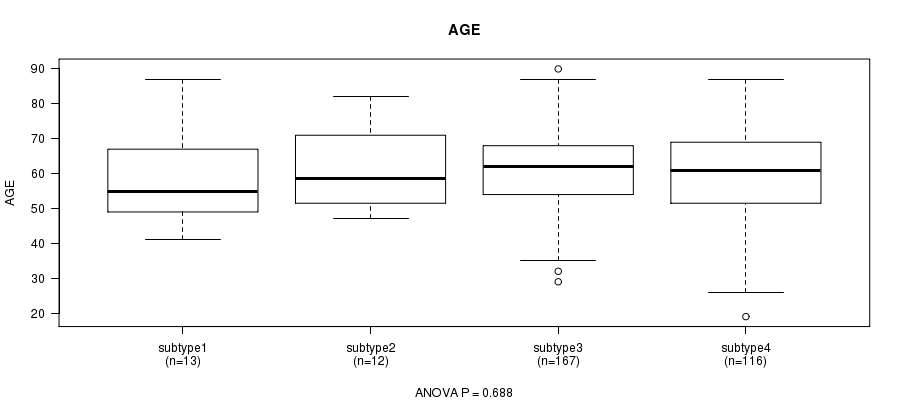
P value = 0.688 (ANOVA)
Table S66. Clustering Approach #8: 'MIRseq cHierClus subtypes' versus Clinical Feature #2: 'AGE'
| nPatients | Mean (Std.Dev) | |
|---|---|---|
| ALL | 308 | 61.1 (12.1) |
| subtype1 | 13 | 58.4 (13.2) |
| subtype2 | 12 | 61.0 (11.8) |
| subtype3 | 167 | 61.8 (11.5) |
| subtype4 | 116 | 60.4 (12.9) |
Figure S58. Get High-res Image Clustering Approach #8: 'MIRseq cHierClus subtypes' versus Clinical Feature #2: 'AGE'
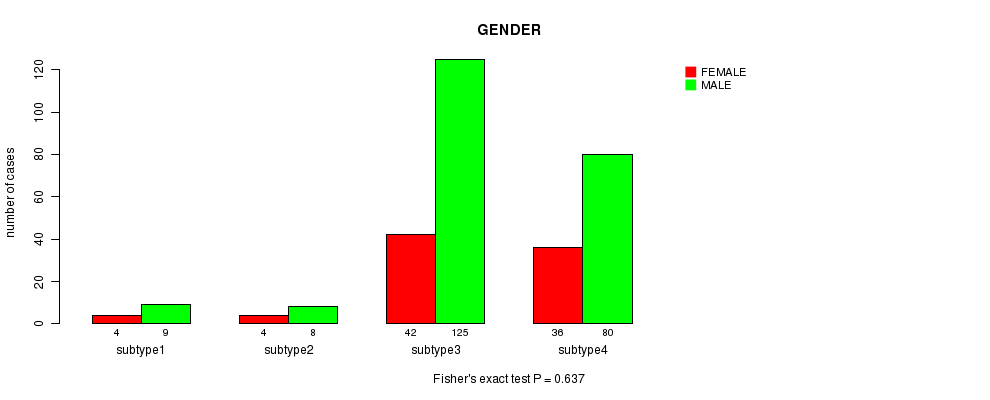
P value = 0.637 (Fisher's exact test)
Table S67. Clustering Approach #8: 'MIRseq cHierClus subtypes' versus Clinical Feature #3: 'GENDER'
| nPatients | FEMALE | MALE |
|---|---|---|
| ALL | 86 | 222 |
| subtype1 | 4 | 9 |
| subtype2 | 4 | 8 |
| subtype3 | 42 | 125 |
| subtype4 | 36 | 80 |
Figure S59. Get High-res Image Clustering Approach #8: 'MIRseq cHierClus subtypes' versus Clinical Feature #3: 'GENDER'
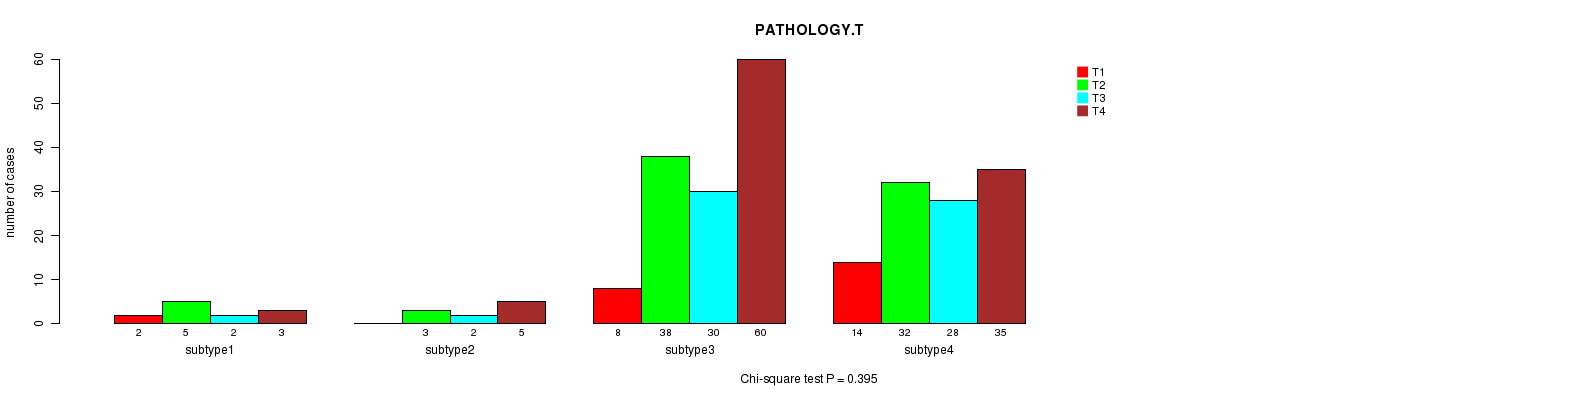
P value = 0.395 (Chi-square test)
Table S68. Clustering Approach #8: 'MIRseq cHierClus subtypes' versus Clinical Feature #4: 'PATHOLOGY.T'
| nPatients | T1 | T2 | T3 | T4 |
|---|---|---|---|---|
| ALL | 24 | 78 | 62 | 103 |
| subtype1 | 2 | 5 | 2 | 3 |
| subtype2 | 0 | 3 | 2 | 5 |
| subtype3 | 8 | 38 | 30 | 60 |
| subtype4 | 14 | 32 | 28 | 35 |
Figure S60. Get High-res Image Clustering Approach #8: 'MIRseq cHierClus subtypes' versus Clinical Feature #4: 'PATHOLOGY.T'
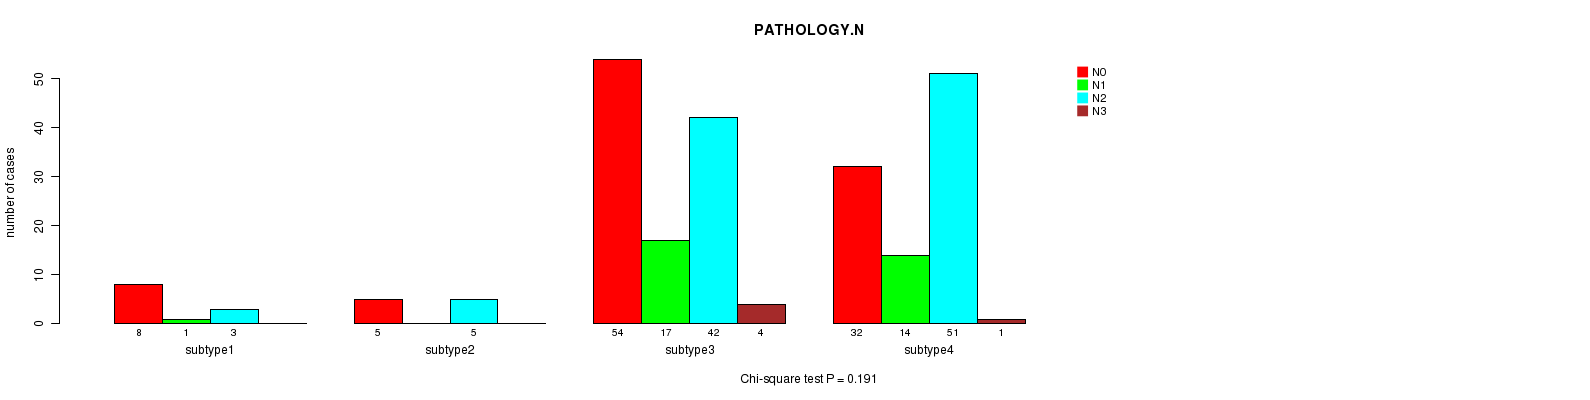
P value = 0.191 (Chi-square test)
Table S69. Clustering Approach #8: 'MIRseq cHierClus subtypes' versus Clinical Feature #5: 'PATHOLOGY.N'
| nPatients | N0 | N1 | N2 | N3 |
|---|---|---|---|---|
| ALL | 99 | 32 | 101 | 5 |
| subtype1 | 8 | 1 | 3 | 0 |
| subtype2 | 5 | 0 | 5 | 0 |
| subtype3 | 54 | 17 | 42 | 4 |
| subtype4 | 32 | 14 | 51 | 1 |
Figure S61. Get High-res Image Clustering Approach #8: 'MIRseq cHierClus subtypes' versus Clinical Feature #5: 'PATHOLOGY.N'
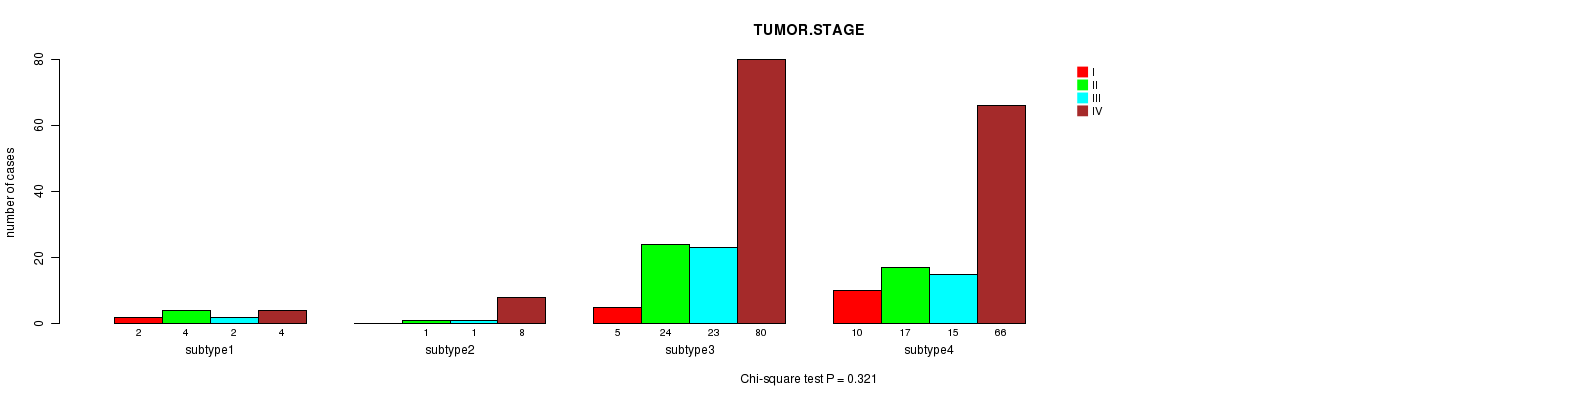
P value = 0.321 (Chi-square test)
Table S70. Clustering Approach #8: 'MIRseq cHierClus subtypes' versus Clinical Feature #6: 'TUMOR.STAGE'
| nPatients | I | II | III | IV |
|---|---|---|---|---|
| ALL | 17 | 46 | 41 | 158 |
| subtype1 | 2 | 4 | 2 | 4 |
| subtype2 | 0 | 1 | 1 | 8 |
| subtype3 | 5 | 24 | 23 | 80 |
| subtype4 | 10 | 17 | 15 | 66 |
Figure S62. Get High-res Image Clustering Approach #8: 'MIRseq cHierClus subtypes' versus Clinical Feature #6: 'TUMOR.STAGE'
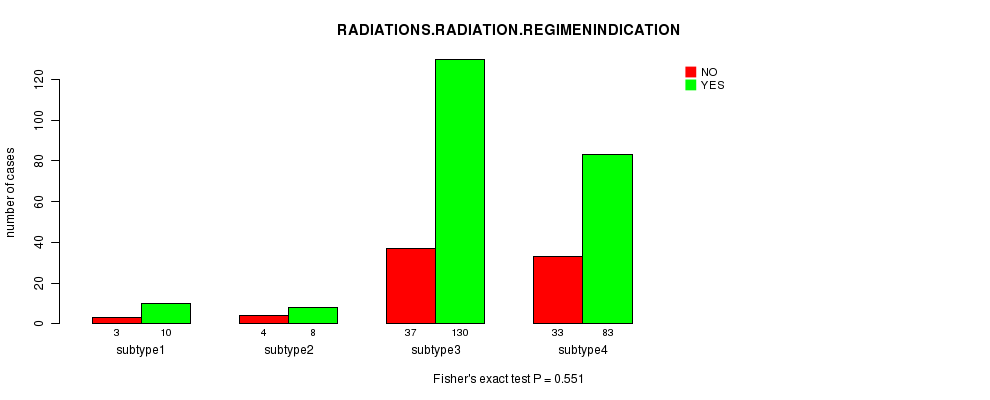
P value = 0.551 (Fisher's exact test)
Table S71. Clustering Approach #8: 'MIRseq cHierClus subtypes' versus Clinical Feature #7: 'RADIATIONS.RADIATION.REGIMENINDICATION'
| nPatients | NO | YES |
|---|---|---|
| ALL | 77 | 231 |
| subtype1 | 3 | 10 |
| subtype2 | 4 | 8 |
| subtype3 | 37 | 130 |
| subtype4 | 33 | 83 |
Figure S63. Get High-res Image Clustering Approach #8: 'MIRseq cHierClus subtypes' versus Clinical Feature #7: 'RADIATIONS.RADIATION.REGIMENINDICATION'
P value = 0.0179 (Fisher's exact test)
Table S72. Clustering Approach #8: 'MIRseq cHierClus subtypes' versus Clinical Feature #8: 'NEOADJUVANT.THERAPY'
| nPatients | NO | YES |
|---|---|---|
| ALL | 48 | 260 |
| subtype1 | 0 | 13 |
| subtype2 | 3 | 9 |
| subtype3 | 19 | 148 |
| subtype4 | 26 | 90 |
Figure S64. Get High-res Image Clustering Approach #8: 'MIRseq cHierClus subtypes' versus Clinical Feature #8: 'NEOADJUVANT.THERAPY'
-
Cluster data file = HNSC.mergedcluster.txt
-
Clinical data file = HNSC.clin.merged.picked.txt
-
Number of patients = 311
-
Number of clustering approaches = 8
-
Number of selected clinical features = 8
-
Exclude small clusters that include fewer than K patients, K = 3
consensus non-negative matrix factorization clustering approach (Brunet et al. 2004)
Resampling-based clustering method (Monti et al. 2003)
For survival clinical features, the Kaplan-Meier survival curves of tumors with and without gene mutations were plotted and the statistical significance P values were estimated by logrank test (Bland and Altman 2004) using the 'survdiff' function in R
For continuous numerical clinical features, one-way analysis of variance (Howell 2002) was applied to compare the clinical values between tumor subtypes using 'anova' function in R
For multi-class clinical features (nominal or ordinal), Chi-square tests (Greenwood and Nikulin 1996) were used to estimate the P values using the 'chisq.test' function in R
For binary clinical features, two-tailed Fisher's exact tests (Fisher 1922) were used to estimate the P values using the 'fisher.test' function in R
This is an experimental feature. The full results of the analysis summarized in this report can be downloaded from the TCGA Data Coordination Center.