This pipeline uses various statistical tests to identify mRNAs whose expression levels correlated to selected clinical features.
Testing the association between 18294 genes and 9 clinical features across 469 samples, statistically thresholded by Q value < 0.05, 8 clinical features related to at least one genes.
-
2001 genes correlated to 'Time to Death'.
-
COL7A1|1294 , ANKRD56|345079 , B3GNTL1|146712 , DONSON|29980 , FBXL5|26234 , ...
-
13 genes correlated to 'AGE'.
-
RANBP17|64901 , WFDC1|58189 , RFPL1S|10740 , PALLD|23022 , UTY|7404 , ...
-
216 genes correlated to 'GENDER'.
-
XIST|7503 , PRKY|5616 , NLGN4Y|22829 , TSIX|9383 , RPS4Y1|6192 , ...
-
2273 genes correlated to 'PATHOLOGY.T'.
-
NR3C2|4306 , FKBP11|51303 , FAM122A|116224 , TMEM150C|441027 , ZNF132|7691 , ...
-
6 genes correlated to 'PATHOLOGY.N'.
-
C11ORF34|349633 , HEMGN|55363 , PITX2|5308 , ATP6V1D|51382 , ATP13A5|344905 , ...
-
217 genes correlated to 'PATHOLOGICSPREAD(M)'.
-
GARNL3|84253 , IL20RB|53833 , PLEKHA9|51054 , BIRC5|332 , C22ORF9|23313 , ...
-
2605 genes correlated to 'TUMOR.STAGE'.
-
NR3C2|4306 , PLEKHA9|51054 , FKBP11|51303 , FAM122A|116224 , TSPAN7|7102 , ...
-
16 genes correlated to 'NEOADJUVANT.THERAPY'.
-
GPR128|84873 , PTPN20B|26095 , USH1C|10083 , HIST1H4D|8360 , SPRY1|10252 , ...
-
No genes correlated to 'KARNOFSKY.PERFORMANCE.SCORE'
Complete statistical result table is provided in Supplement Table 1
Table 1. Get Full Table This table shows the clinical features, statistical methods used, and the number of genes that are significantly associated with each clinical feature at Q value < 0.05.
| Clinical feature | Statistical test | Significant genes | Associated with | Associated with | ||
|---|---|---|---|---|---|---|
| Time to Death | Cox regression test | N=2001 | shorter survival | N=1278 | longer survival | N=723 |
| AGE | Spearman correlation test | N=13 | older | N=2 | younger | N=11 |
| GENDER | t test | N=216 | male | N=131 | female | N=85 |
| KARNOFSKY PERFORMANCE SCORE | Spearman correlation test | N=0 | ||||
| PATHOLOGY T | Spearman correlation test | N=2273 | higher pT | N=1236 | lower pT | N=1037 |
| PATHOLOGY N | t test | N=6 | n1 | N=1 | n0 | N=5 |
| PATHOLOGICSPREAD(M) | t test | N=217 | m1 | N=189 | m0 | N=28 |
| TUMOR STAGE | Spearman correlation test | N=2605 | higher stage | N=1412 | lower stage | N=1193 |
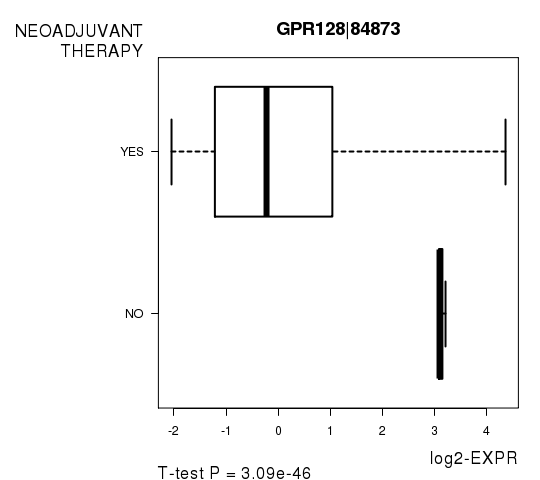
| NEOADJUVANT THERAPY | t test | N=16 | yes | N=7 | no | N=9 |
Table S1. Basic characteristics of clinical feature: 'Time to Death'
| Time to Death | Duration (Months) | 0.1-111 (median=34.5) |
| censored | N = 313 | |
| death | N = 153 | |
| Significant markers | N = 2001 | |
| associated with shorter survival | 1278 | |
| associated with longer survival | 723 |
Table S2. Get Full Table List of top 10 genes significantly associated with 'Time to Death' by Cox regression test
| HazardRatio | Wald_P | Q | C_index | |
|---|---|---|---|---|
| COL7A1|1294 | 1.31 | 0 | 0 | 0.669 |
| ANKRD56|345079 | 0.71 | 1.11e-16 | 2e-12 | 0.323 |
| B3GNTL1|146712 | 2.3 | 1.11e-16 | 2e-12 | 0.677 |
| DONSON|29980 | 2.6 | 1.11e-16 | 2e-12 | 0.677 |
| FBXL5|26234 | 0.42 | 7.772e-16 | 1.4e-11 | 0.323 |
| SLC16A12|387700 | 0.79 | 8.882e-16 | 1.6e-11 | 0.319 |
| ADAMTS14|140766 | 1.43 | 1.221e-15 | 2.2e-11 | 0.677 |
| RGS17|26575 | 1.43 | 1.776e-15 | 3.2e-11 | 0.66 |
| NUMBL|9253 | 1.82 | 2.331e-15 | 4.3e-11 | 0.681 |
| CCNF|899 | 1.97 | 2.887e-15 | 5.3e-11 | 0.666 |
Figure S1. Get High-res Image As an example, this figure shows the association of COL7A1|1294 to 'Time to Death'. four curves present the cumulative survival rates of 4 quartile subsets of patients. P value = 0 with univariate Cox regression analysis using continuous log-2 expression values.
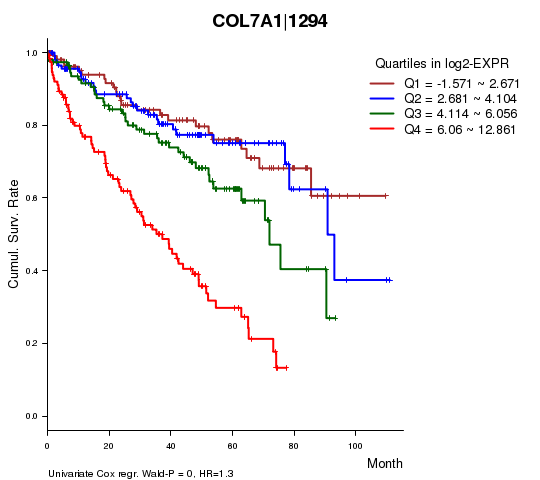
Table S3. Basic characteristics of clinical feature: 'AGE'
| AGE | Mean (SD) | 60.62 (12) |
| Significant markers | N = 13 | |
| pos. correlated | 2 | |
| neg. correlated | 11 |
Table S4. Get Full Table List of top 10 genes significantly correlated to 'AGE' by Spearman correlation test
| SpearmanCorr | corrP | Q | |
|---|---|---|---|
| RANBP17|64901 | -0.2598 | 1.166e-08 | 0.000213 |
| WFDC1|58189 | -0.2448 | 8.132e-08 | 0.00149 |
| RFPL1S|10740 | -0.2427 | 1.326e-07 | 0.00243 |
| PALLD|23022 | -0.2366 | 2.229e-07 | 0.00408 |
| UTY|7404 | -0.259 | 7.819e-07 | 0.0143 |
| NEFH|4744 | -0.2259 | 7.872e-07 | 0.0144 |
| ZNF780A|284323 | -0.2242 | 9.65e-07 | 0.0176 |
| DIO2|1734 | -0.2226 | 1.18e-06 | 0.0216 |
| FNDC1|84624 | -0.2216 | 1.283e-06 | 0.0235 |
| ZNF610|162963 | -0.2193 | 1.664e-06 | 0.0304 |
Figure S2. Get High-res Image As an example, this figure shows the association of RANBP17|64901 to 'AGE'. P value = 1.17e-08 with Spearman correlation analysis. The straight line presents the best linear regression.
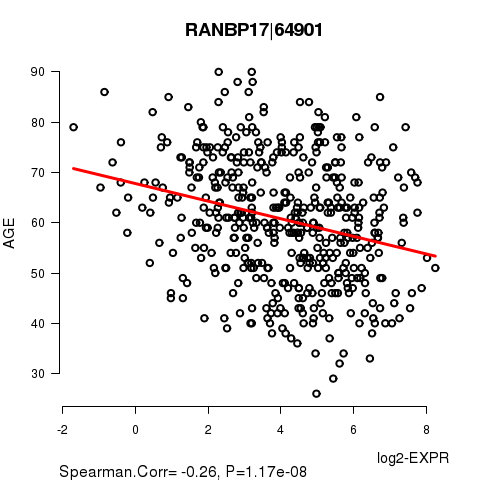
Table S5. Basic characteristics of clinical feature: 'GENDER'
| GENDER | Labels | N |
| FEMALE | 162 | |
| MALE | 307 | |
| Significant markers | N = 216 | |
| Higher in MALE | 131 | |
| Higher in FEMALE | 85 |
Table S6. Get Full Table List of top 10 genes differentially expressed by 'GENDER'
| T(pos if higher in 'MALE') | ttestP | Q | AUC | |
|---|---|---|---|---|
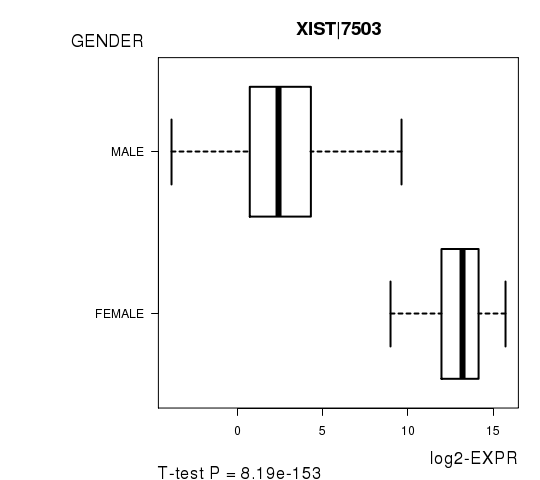
| XIST|7503 | -41.65 | 8.192e-153 | 1.5e-148 | 0.9814 |
| PRKY|5616 | 35.38 | 2.013e-94 | 3.68e-90 | 0.973 |
| NLGN4Y|22829 | 32.24 | 8.053e-69 | 1.47e-64 | 0.9727 |
| TSIX|9383 | -23.29 | 1.392e-66 | 2.55e-62 | 0.9657 |
| RPS4Y1|6192 | 32.29 | 2.264e-65 | 4.14e-61 | 0.9799 |
| ZFY|7544 | 31.14 | 8.747e-58 | 1.6e-53 | 0.9723 |
| DDX3Y|8653 | 27.62 | 3.594e-51 | 6.57e-47 | 0.9672 |
| KDM5C|8242 | -16.66 | 8.561e-48 | 1.57e-43 | 0.8963 |
| NCRNA00183|554203 | -16.13 | 7.218e-44 | 1.32e-39 | 0.8643 |
| HAUS7|55559 | 13.78 | 8.192e-36 | 1.5e-31 | 0.8354 |
Figure S3. Get High-res Image As an example, this figure shows the association of XIST|7503 to 'GENDER'. P value = 8.19e-153 with T-test analysis.
No gene related to 'KARNOFSKY.PERFORMANCE.SCORE'.
Table S7. Basic characteristics of clinical feature: 'KARNOFSKY.PERFORMANCE.SCORE'
| KARNOFSKY.PERFORMANCE.SCORE | Mean (SD) | 90.97 (19) |
| Score | N | |
| 0 | 1 | |
| 70 | 1 | |
| 80 | 3 | |
| 90 | 9 | |
| 100 | 17 | |
| Significant markers | N = 0 |
Table S8. Basic characteristics of clinical feature: 'PATHOLOGY.T'
| PATHOLOGY.T | Mean (SD) | 1.92 (0.97) |
| N | ||
| T1 | 229 | |
| T2 | 58 | |
| T3 | 171 | |
| T4 | 11 | |
| Significant markers | N = 2273 | |
| pos. correlated | 1236 | |
| neg. correlated | 1037 |
Table S9. Get Full Table List of top 10 genes significantly correlated to 'PATHOLOGY.T' by Spearman correlation test
| SpearmanCorr | corrP | Q | |
|---|---|---|---|
| NR3C2|4306 | -0.4006 | 1.662e-19 | 3.04e-15 |
| FKBP11|51303 | 0.3783 | 2.095e-17 | 3.83e-13 |
| FAM122A|116224 | -0.3759 | 3.452e-17 | 6.31e-13 |
| TMEM150C|441027 | -0.374 | 5.126e-17 | 9.38e-13 |
| ZNF132|7691 | -0.3721 | 7.623e-17 | 1.39e-12 |
| PLEKHA9|51054 | 0.3714 | 8.655e-17 | 1.58e-12 |
| CCDC121|79635 | -0.3673 | 1.998e-16 | 3.65e-12 |
| FAM160A1|729830 | -0.3665 | 2.357e-16 | 4.31e-12 |
| ACADSB|36 | -0.3654 | 2.926e-16 | 5.35e-12 |
| PTPRB|5787 | -0.3613 | 6.645e-16 | 1.22e-11 |
Figure S4. Get High-res Image As an example, this figure shows the association of NR3C2|4306 to 'PATHOLOGY.T'. P value = 1.66e-19 with Spearman correlation analysis.
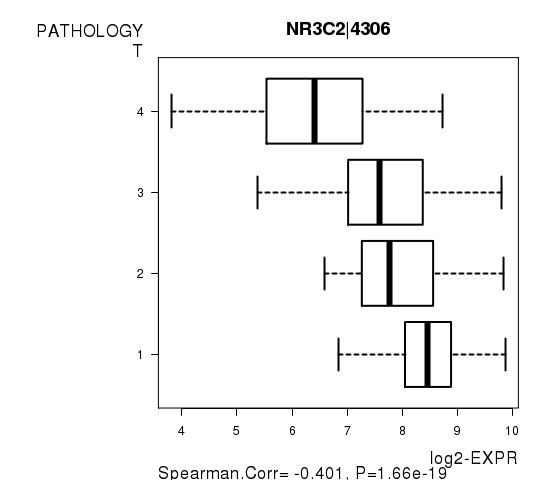
Table S10. Basic characteristics of clinical feature: 'PATHOLOGY.N'
| PATHOLOGY.N | Labels | N |
| N0 | 224 | |
| N1 | 17 | |
| Significant markers | N = 6 | |
| Higher in N1 | 1 | |
| Higher in N0 | 5 |
Table S11. Get Full Table List of 6 genes differentially expressed by 'PATHOLOGY.N'
| T(pos if higher in 'N1') | ttestP | Q | AUC | |
|---|---|---|---|---|
| C11ORF34|349633 | -7.8 | 4.243e-09 | 7.76e-05 | 0.7246 |
| HEMGN|55363 | -6.92 | 6.077e-09 | 0.000111 | 0.7661 |
| PITX2|5308 | 7.02 | 1.467e-07 | 0.00268 | 0.7909 |
| ATP6V1D|51382 | -6.11 | 4.424e-07 | 0.00809 | 0.7534 |
| ATP13A5|344905 | -5.94 | 7.995e-07 | 0.0146 | 0.7583 |
| PIGH|5283 | -6.22 | 2.161e-06 | 0.0395 | 0.7957 |
Figure S5. Get High-res Image As an example, this figure shows the association of C11ORF34|349633 to 'PATHOLOGY.N'. P value = 4.24e-09 with T-test analysis.
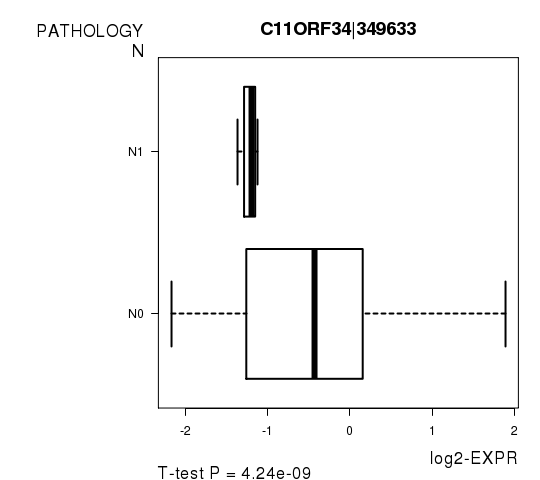
Table S12. Basic characteristics of clinical feature: 'PATHOLOGICSPREAD(M)'
| PATHOLOGICSPREAD(M) | Labels | N |
| M0 | 393 | |
| M1 | 76 | |
| Significant markers | N = 217 | |
| Higher in M1 | 189 | |
| Higher in M0 | 28 |
Table S13. Get Full Table List of top 10 genes differentially expressed by 'PATHOLOGICSPREAD(M)'
| T(pos if higher in 'M1') | ttestP | Q | AUC | |
|---|---|---|---|---|
| GARNL3|84253 | -6.98 | 2.217e-10 | 4.06e-06 | 0.7461 |
| IL20RB|53833 | 6.47 | 3.441e-09 | 6.29e-05 | 0.7257 |
| PLEKHA9|51054 | 6.4 | 3.967e-09 | 7.26e-05 | 0.7298 |
| BIRC5|332 | 6.36 | 5.767e-09 | 0.000105 | 0.7221 |
| C22ORF9|23313 | 6.31 | 5.966e-09 | 0.000109 | 0.727 |
| INHBE|83729 | 6.34 | 6.91e-09 | 0.000126 | 0.7218 |
| TYMP|1890 | 6.1 | 1.231e-08 | 0.000225 | 0.7029 |
| NFE2L3|9603 | 6.15 | 1.284e-08 | 0.000235 | 0.7157 |
| OIP5|11339 | 6.15 | 1.349e-08 | 0.000247 | 0.7214 |
| CEP55|55165 | 6.1 | 2.049e-08 | 0.000375 | 0.715 |
Figure S6. Get High-res Image As an example, this figure shows the association of GARNL3|84253 to 'PATHOLOGICSPREAD(M)'. P value = 2.22e-10 with T-test analysis.
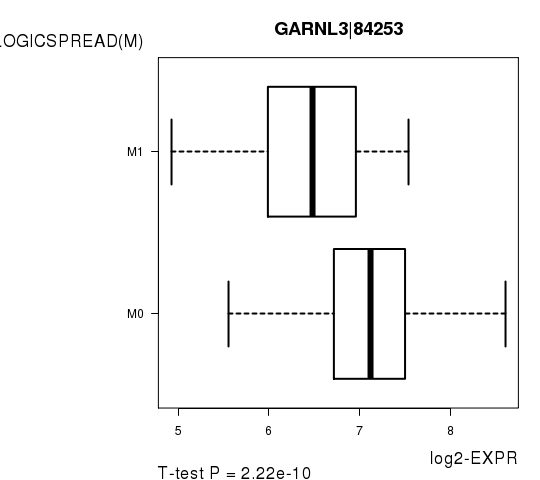
Table S14. Basic characteristics of clinical feature: 'TUMOR.STAGE'
| TUMOR.STAGE | Mean (SD) | 2.11 (1.2) |
| N | ||
| Stage 1 | 225 | |
| Stage 2 | 47 | |
| Stage 3 | 117 | |
| Stage 4 | 80 | |
| Significant markers | N = 2605 | |
| pos. correlated | 1412 | |
| neg. correlated | 1193 |
Table S15. Get Full Table List of top 10 genes significantly correlated to 'TUMOR.STAGE' by Spearman correlation test
| SpearmanCorr | corrP | Q | |
|---|---|---|---|
| NR3C2|4306 | -0.4018 | 1.255e-19 | 2.3e-15 |
| PLEKHA9|51054 | 0.4003 | 1.799e-19 | 3.29e-15 |
| FKBP11|51303 | 0.3926 | 9.788e-19 | 1.79e-14 |
| FAM122A|116224 | -0.3892 | 2.046e-18 | 3.74e-14 |
| TSPAN7|7102 | -0.3764 | 3.131e-17 | 5.73e-13 |
| ACADSB|36 | -0.3713 | 8.819e-17 | 1.61e-12 |
| FAM160A1|729830 | -0.3703 | 1.095e-16 | 2e-12 |
| NOP2|4839 | 0.3702 | 1.111e-16 | 2.03e-12 |
| SYNJ2BP|55333 | -0.3699 | 1.171e-16 | 2.14e-12 |
| ALDH6A1|4329 | -0.3695 | 1.282e-16 | 2.34e-12 |
Figure S7. Get High-res Image As an example, this figure shows the association of NR3C2|4306 to 'TUMOR.STAGE'. P value = 1.25e-19 with Spearman correlation analysis.
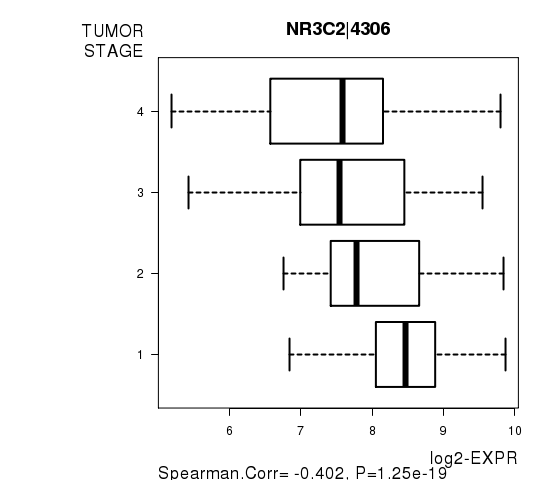
Table S16. Basic characteristics of clinical feature: 'NEOADJUVANT.THERAPY'
| NEOADJUVANT.THERAPY | Labels | N |
| NO | 5 | |
| YES | 464 | |
| Significant markers | N = 16 | |
| Higher in YES | 7 | |
| Higher in NO | 9 |
Table S17. Get Full Table List of top 10 genes differentially expressed by 'NEOADJUVANT.THERAPY'
| T(pos if higher in 'YES') | ttestP | Q | AUC | |
|---|---|---|---|---|
| GPR128|84873 | -23.31 | 3.092e-46 | 5.32e-42 | 0.9355 |
| PTPN20B|26095 | -17.07 | 5.488e-20 | 9.43e-16 | 0.8211 |
| USH1C|10083 | -10.67 | 5.068e-15 | 8.71e-11 | 0.8981 |
| HIST1H4D|8360 | -12.87 | 8.909e-13 | 1.53e-08 | 0.8423 |
| SPRY1|10252 | 14.22 | 2.871e-09 | 4.93e-05 | 0.8547 |
| NAPG|8774 | 14.44 | 3.261e-09 | 5.6e-05 | 0.8741 |
| CILP2|148113 | -7.27 | 3.059e-08 | 0.000526 | 0.6936 |
| ZFYVE20|64145 | 17.48 | 3.556e-08 | 0.000611 | 0.9151 |
| RASA3|22821 | 11.73 | 1.034e-07 | 0.00178 | 0.8884 |
| SEMA6A|57556 | -9.8 | 6.457e-07 | 0.0111 | 0.7892 |
Figure S8. Get High-res Image As an example, this figure shows the association of GPR128|84873 to 'NEOADJUVANT.THERAPY'. P value = 3.09e-46 with T-test analysis.
-
Expresson data file = KIRC.uncv2.mRNAseq_RSEM_normalized_log2.txt
-
Clinical data file = KIRC.clin.merged.picked.txt
-
Number of patients = 469
-
Number of genes = 18294
-
Number of clinical features = 9
For survival clinical features, Wald's test in univariate Cox regression analysis with proportional hazards model (Andersen and Gill 1982) was used to estimate the P values using the 'coxph' function in R. Kaplan-Meier survival curves were plot using the four quartile subgroups of patients based on expression levels
For continuous numerical clinical features, Spearman's rank correlation coefficients (Spearman 1904) and two-tailed P values were estimated using 'cor.test' function in R
For two-class clinical features, two-tailed Student's t test with unequal variance (Lehmann and Romano 2005) was applied to compare the log2-expression levels between the two clinical classes using 't.test' function in R
For multiple hypothesis correction, Q value is the False Discovery Rate (FDR) analogue of the P value (Benjamini and Hochberg 1995), defined as the minimum FDR at which the test may be called significant. We used the 'Benjamini and Hochberg' method of 'p.adjust' function in R to convert P values into Q values.
This is an experimental feature. The full results of the analysis summarized in this report can be downloaded from the TCGA Data Coordination Center.