This pipeline uses various statistical tests to identify genes whose promoter methylation levels correlated to selected clinical features.
Testing the association between 17380 genes and 9 clinical features across 263 samples, statistically thresholded by Q value < 0.05, 8 clinical features related to at least one genes.
-
334 genes correlated to 'Time to Death'.
-
PPP3CB , RPRD2 , RIOK3 , ARHGEF12 , PTK2B , ...
-
16 genes correlated to 'AGE'.
-
ELOVL2 , MRPS33 , UNC80 , DOK6 , TSPYL5 , ...
-
86 genes correlated to 'GENDER'.
-
UTP14C , KIF4B , CCDC146 , CAV2 , UQCRH , ...
-
621 genes correlated to 'PATHOLOGY.T'.
-
KDR , DBX2 , ACTA1 , OPRK1 , NR5A1 , ...
-
8 genes correlated to 'PATHOLOGY.N'.
-
CARD16 , CASP1 , SFXN5 , LOC339535 , VGF , ...
-
46 genes correlated to 'PATHOLOGICSPREAD(M)'.
-
CMTM8 , C20ORF112 , OPRK1 , HTR6 , PLCD1 , ...
-
648 genes correlated to 'TUMOR.STAGE'.
-
KDR , ACTA1 , OPRK1 , DBX2 , FAM38B , ...
-
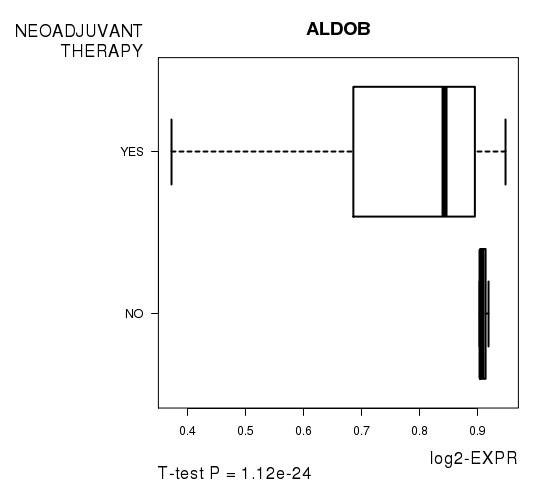
130 genes correlated to 'NEOADJUVANT.THERAPY'.
-
ALDOB , NKIRAS2 , PLXNB2 , MREG , UQCRH , ...
-
No genes correlated to 'KARNOFSKY.PERFORMANCE.SCORE'
Complete statistical result table is provided in Supplement Table 1
Table 1. Get Full Table This table shows the clinical features, statistical methods used, and the number of genes that are significantly associated with each clinical feature at Q value < 0.05.
| Clinical feature | Statistical test | Significant genes | Associated with | Associated with | ||
|---|---|---|---|---|---|---|
| Time to Death | Cox regression test | N=334 | shorter survival | N=203 | longer survival | N=131 |
| AGE | Spearman correlation test | N=16 | older | N=14 | younger | N=2 |
| GENDER | t test | N=86 | male | N=8 | female | N=78 |
| KARNOFSKY PERFORMANCE SCORE | Spearman correlation test | N=0 | ||||
| PATHOLOGY T | Spearman correlation test | N=621 | higher pT | N=314 | lower pT | N=307 |
| PATHOLOGY N | t test | N=8 | n1 | N=1 | n0 | N=7 |
| PATHOLOGICSPREAD(M) | t test | N=46 | m1 | N=43 | m0 | N=3 |
| TUMOR STAGE | Spearman correlation test | N=648 | higher stage | N=418 | lower stage | N=230 |
| NEOADJUVANT THERAPY | t test | N=130 | yes | N=51 | no | N=79 |
Table S1. Basic characteristics of clinical feature: 'Time to Death'
| Time to Death | Duration (Months) | 0.1-109.9 (median=28.3) |
| censored | N = 169 | |
| death | N = 91 | |
| Significant markers | N = 334 | |
| associated with shorter survival | 203 | |
| associated with longer survival | 131 |
Table S2. Get Full Table List of top 10 genes significantly associated with 'Time to Death' by Cox regression test
| HazardRatio | Wald_P | Q | C_index | |
|---|---|---|---|---|
| PPP3CB | 0 | 2.657e-11 | 4.6e-07 | 0.332 |
| RPRD2 | 50 | 7.839e-11 | 1.4e-06 | 0.676 |
| RIOK3 | 6001 | 1.019e-10 | 1.8e-06 | 0.661 |
| ARHGEF12 | 38 | 2.288e-10 | 4e-06 | 0.64 |
| PTK2B | 0 | 3.038e-10 | 5.3e-06 | 0.327 |
| IGLL1 | 0.01 | 4.758e-10 | 8.3e-06 | 0.315 |
| MBNL2 | 26 | 5.475e-10 | 9.5e-06 | 0.666 |
| EVI2A | 0.04 | 5.908e-10 | 1e-05 | 0.352 |
| CCL26 | 0.07 | 6e-10 | 1e-05 | 0.358 |
| SALL1 | 10.1 | 9.264e-10 | 1.6e-05 | 0.601 |
Figure S1. Get High-res Image As an example, this figure shows the association of PPP3CB to 'Time to Death'. four curves present the cumulative survival rates of 4 quartile subsets of patients. P value = 2.66e-11 with univariate Cox regression analysis using continuous log-2 expression values.
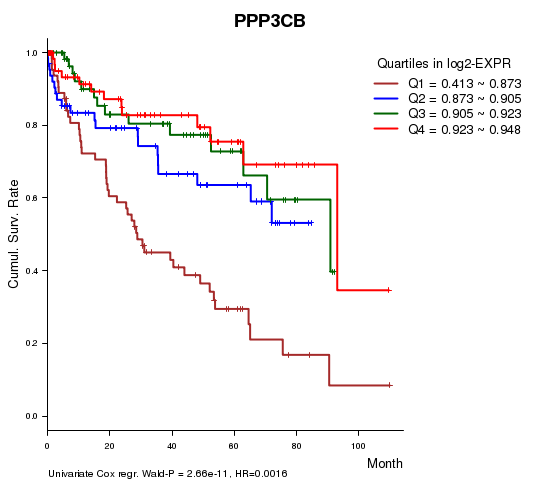
Table S3. Basic characteristics of clinical feature: 'AGE'
| AGE | Mean (SD) | 61.45 (12) |
| Significant markers | N = 16 | |
| pos. correlated | 14 | |
| neg. correlated | 2 |
Table S4. Get Full Table List of top 10 genes significantly correlated to 'AGE' by Spearman correlation test
| SpearmanCorr | corrP | Q | |
|---|---|---|---|
| ELOVL2 | 0.4639 | 1.942e-15 | 3.38e-11 |
| MRPS33 | 0.3348 | 2.626e-08 | 0.000456 |
| UNC80 | 0.3241 | 7.597e-08 | 0.00132 |
| DOK6 | 0.3232 | 8.284e-08 | 0.00144 |
| TSPYL5 | 0.3108 | 2.681e-07 | 0.00466 |
| RANBP17 | 0.3102 | 2.837e-07 | 0.00493 |
| ZYG11A | 0.3056 | 4.319e-07 | 0.0075 |
| C7ORF13 | 0.3039 | 5.048e-07 | 0.00877 |
| RNF32 | 0.3039 | 5.048e-07 | 0.00877 |
| PVT1 | -0.3001 | 7.108e-07 | 0.0123 |
Figure S2. Get High-res Image As an example, this figure shows the association of ELOVL2 to 'AGE'. P value = 1.94e-15 with Spearman correlation analysis. The straight line presents the best linear regression.
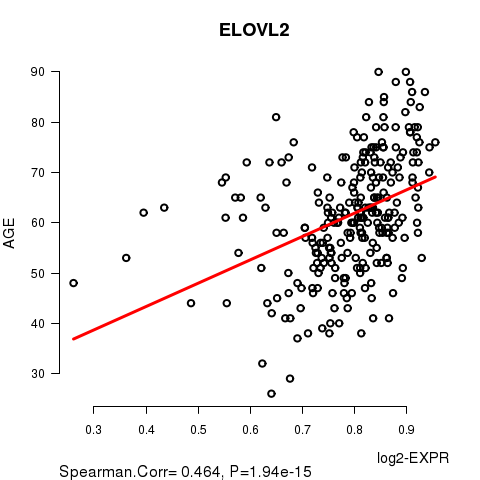
Table S5. Basic characteristics of clinical feature: 'GENDER'
| GENDER | Labels | N |
| FEMALE | 89 | |
| MALE | 174 | |
| Significant markers | N = 86 | |
| Higher in MALE | 8 | |
| Higher in FEMALE | 78 |
Table S6. Get Full Table List of top 10 genes differentially expressed by 'GENDER'
| T(pos if higher in 'MALE') | ttestP | Q | AUC | |
|---|---|---|---|---|
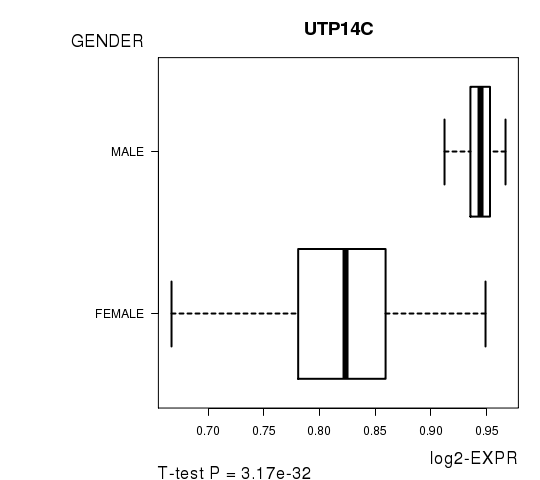
| UTP14C | 17.16 | 3.173e-32 | 5.52e-28 | 0.9707 |
| KIF4B | -11.32 | 3.408e-23 | 5.92e-19 | 0.875 |
| CCDC146 | -10.37 | 3.088e-21 | 5.37e-17 | 0.8014 |
| CAV2 | -9.9 | 2.448e-19 | 4.25e-15 | 0.8063 |
| UQCRH | 9.84 | 6.178e-19 | 1.07e-14 | 0.7634 |
| DNAJB13 | -9.53 | 1.652e-18 | 2.87e-14 | 0.7841 |
| SNORA48 | -9.2 | 1.193e-16 | 2.07e-12 | 0.8144 |
| TLE1 | -9.1 | 3.69e-16 | 6.41e-12 | 0.8029 |
| RERG | -8.38 | 7.736e-15 | 1.34e-10 | 0.7701 |
| ADAMTS10 | -8.1 | 2.187e-14 | 3.8e-10 | 0.733 |
Figure S3. Get High-res Image As an example, this figure shows the association of UTP14C to 'GENDER'. P value = 3.17e-32 with T-test analysis.
No gene related to 'KARNOFSKY.PERFORMANCE.SCORE'.
Table S7. Basic characteristics of clinical feature: 'KARNOFSKY.PERFORMANCE.SCORE'
| KARNOFSKY.PERFORMANCE.SCORE | Mean (SD) | 92.92 (8.6) |
| Score | N | |
| 70 | 1 | |
| 80 | 3 | |
| 90 | 8 | |
| 100 | 12 | |
| Significant markers | N = 0 |
Table S8. Basic characteristics of clinical feature: 'PATHOLOGY.T'
| PATHOLOGY.T | Mean (SD) | 1.99 (0.99) |
| N | ||
| T1 | 121 | |
| T2 | 32 | |
| T3 | 102 | |
| T4 | 8 | |
| Significant markers | N = 621 | |
| pos. correlated | 314 | |
| neg. correlated | 307 |
Table S9. Get Full Table List of top 10 genes significantly correlated to 'PATHOLOGY.T' by Spearman correlation test
| SpearmanCorr | corrP | Q | |
|---|---|---|---|
| KDR | 0.4995 | 5.251e-18 | 9.13e-14 |
| DBX2 | 0.4605 | 3.275e-15 | 5.69e-11 |
| ACTA1 | 0.456 | 6.593e-15 | 1.15e-10 |
| OPRK1 | 0.452 | 1.196e-14 | 2.08e-10 |
| NR5A1 | 0.436 | 1.251e-13 | 2.17e-09 |
| SLC35F1 | 0.4346 | 1.528e-13 | 2.66e-09 |
| AVPR1A | 0.4299 | 2.97e-13 | 5.16e-09 |
| RRM2 | -0.4298 | 3.015e-13 | 5.24e-09 |
| FAM38B | 0.4207 | 1.047e-12 | 1.82e-08 |
| DLL3 | 0.4205 | 1.08e-12 | 1.88e-08 |
Figure S4. Get High-res Image As an example, this figure shows the association of KDR to 'PATHOLOGY.T'. P value = 5.25e-18 with Spearman correlation analysis.
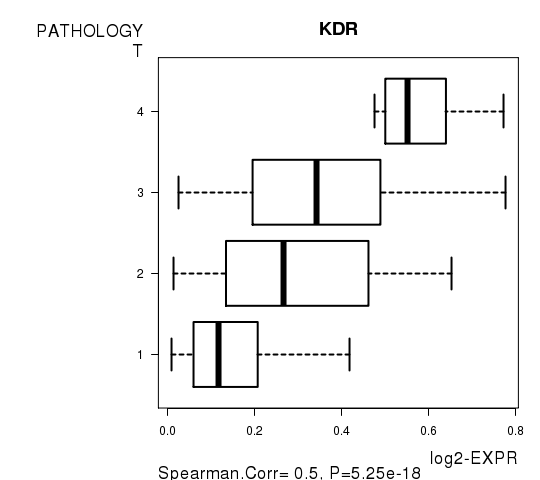
Table S10. Basic characteristics of clinical feature: 'PATHOLOGY.N'
| PATHOLOGY.N | Labels | N |
| N0 | 118 | |
| N1 | 9 | |
| Significant markers | N = 8 | |
| Higher in N1 | 1 | |
| Higher in N0 | 7 |
Table S11. Get Full Table List of 8 genes differentially expressed by 'PATHOLOGY.N'
| T(pos if higher in 'N1') | ttestP | Q | AUC | |
|---|---|---|---|---|
| CARD16 | -6.25 | 1.428e-08 | 0.000248 | 0.6638 |
| CASP1 | -6.25 | 1.428e-08 | 0.000248 | 0.6638 |
| SFXN5 | -6.21 | 3.299e-07 | 0.00573 | 0.7109 |
| LOC339535 | 6.16 | 7.641e-07 | 0.0133 | 0.7881 |
| VGF | -5.16 | 9.519e-07 | 0.0165 | 0.6544 |
| ALKBH2 | -5.09 | 1.458e-06 | 0.0253 | 0.6704 |
| SYNCRIP | -5.02 | 2.001e-06 | 0.0348 | 0.7354 |
| PLAG1 | -4.91 | 2.814e-06 | 0.0489 | 0.7702 |
Figure S5. Get High-res Image As an example, this figure shows the association of CARD16 to 'PATHOLOGY.N'. P value = 1.43e-08 with T-test analysis.
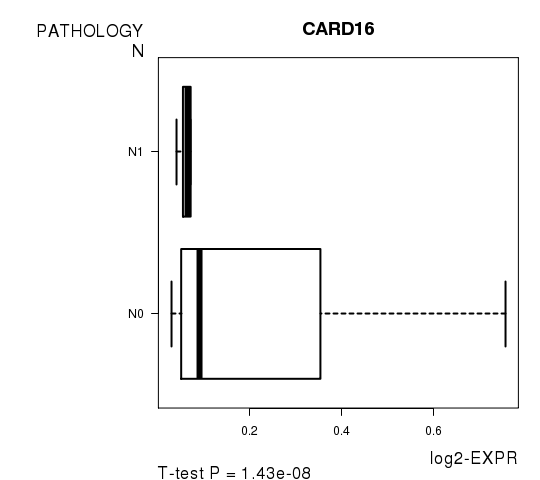
Table S12. Basic characteristics of clinical feature: 'PATHOLOGICSPREAD(M)'
| PATHOLOGICSPREAD(M) | Labels | N |
| M0 | 213 | |
| M1 | 50 | |
| Significant markers | N = 46 | |
| Higher in M1 | 43 | |
| Higher in M0 | 3 |
Table S13. Get Full Table List of top 10 genes differentially expressed by 'PATHOLOGICSPREAD(M)'
| T(pos if higher in 'M1') | ttestP | Q | AUC | |
|---|---|---|---|---|
| CMTM8 | 7.28 | 1.127e-11 | 1.96e-07 | 0.7229 |
| C20ORF112 | 7.2 | 2.774e-11 | 4.82e-07 | 0.7599 |
| OPRK1 | 7.21 | 1.558e-10 | 2.71e-06 | 0.7607 |
| HTR6 | 6.94 | 8.291e-10 | 1.44e-05 | 0.7642 |
| PLCD1 | 6.33 | 1.963e-09 | 3.41e-05 | 0.7057 |
| SESN1 | 6.03 | 1.465e-08 | 0.000255 | 0.7013 |
| GFPT1 | 5.96 | 2.322e-08 | 0.000403 | 0.6902 |
| MUSK | 5.95 | 2.423e-08 | 0.000421 | 0.7065 |
| STK24 | 6.09 | 2.51e-08 | 0.000436 | 0.7486 |
| ASB4 | 5.98 | 3.053e-08 | 0.00053 | 0.7233 |
Figure S6. Get High-res Image As an example, this figure shows the association of CMTM8 to 'PATHOLOGICSPREAD(M)'. P value = 1.13e-11 with T-test analysis.
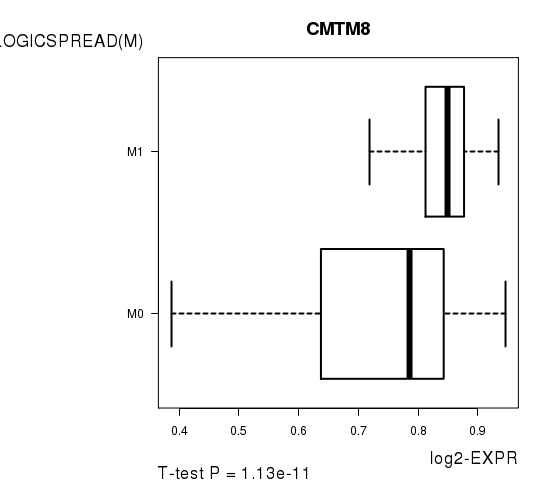
Table S14. Basic characteristics of clinical feature: 'TUMOR.STAGE'
| TUMOR.STAGE | Mean (SD) | 2.22 (1.2) |
| N | ||
| Stage 1 | 119 | |
| Stage 2 | 21 | |
| Stage 3 | 68 | |
| Stage 4 | 55 | |
| Significant markers | N = 648 | |
| pos. correlated | 418 | |
| neg. correlated | 230 |
Table S15. Get Full Table List of top 10 genes significantly correlated to 'TUMOR.STAGE' by Spearman correlation test
| SpearmanCorr | corrP | Q | |
|---|---|---|---|
| KDR | 0.5203 | 1.214e-19 | 2.11e-15 |
| ACTA1 | 0.4863 | 5.134e-17 | 8.92e-13 |
| OPRK1 | 0.4738 | 3.991e-16 | 6.93e-12 |
| DBX2 | 0.4657 | 1.47e-15 | 2.56e-11 |
| FAM38B | 0.4601 | 3.481e-15 | 6.05e-11 |
| NR5A1 | 0.4537 | 9.253e-15 | 1.61e-10 |
| DLL3 | 0.4516 | 1.267e-14 | 2.2e-10 |
| AVPR1A | 0.4515 | 1.287e-14 | 2.24e-10 |
| NEUROD2 | 0.4464 | 2.764e-14 | 4.8e-10 |
| RRM2 | -0.4402 | 6.83e-14 | 1.19e-09 |
Figure S7. Get High-res Image As an example, this figure shows the association of KDR to 'TUMOR.STAGE'. P value = 1.21e-19 with Spearman correlation analysis.
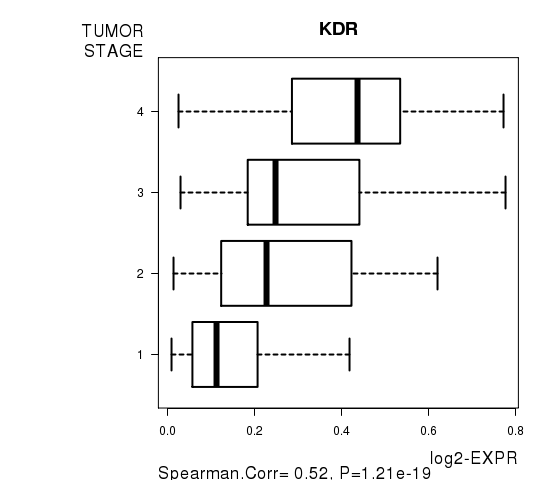
Table S16. Basic characteristics of clinical feature: 'NEOADJUVANT.THERAPY'
| NEOADJUVANT.THERAPY | Labels | N |
| NO | 4 | |
| YES | 259 | |
| Significant markers | N = 130 | |
| Higher in YES | 51 | |
| Higher in NO | 79 |
Table S17. Get Full Table List of top 10 genes differentially expressed by 'NEOADJUVANT.THERAPY'
| T(pos if higher in 'YES') | ttestP | Q | AUC | |
|---|---|---|---|---|
| ALDOB | -12.78 | 1.119e-24 | 1.94e-20 | 0.8243 |
| NKIRAS2 | 12.69 | 2.189e-23 | 3.8e-19 | 0.8909 |
| PLXNB2 | 11.55 | 6.458e-22 | 1.12e-17 | 0.7761 |
| MREG | 11.5 | 6.338e-20 | 1.1e-15 | 0.7597 |
| UQCRH | 9.8 | 1.679e-19 | 2.91e-15 | 0.6467 |
| RDX | 20.73 | 8.317e-19 | 1.44e-14 | 0.9479 |
| METTL3 | -17.65 | 1.49e-18 | 2.59e-14 | 0.8983 |
| KIAA0114 | 8.87 | 5.748e-16 | 9.98e-12 | 0.7191 |
| GRIN1 | -10.33 | 6.6e-16 | 1.15e-11 | 0.8485 |
| GTF2A1L | -8.6 | 7.988e-16 | 1.39e-11 | 0.6525 |
Figure S8. Get High-res Image As an example, this figure shows the association of ALDOB to 'NEOADJUVANT.THERAPY'. P value = 1.12e-24 with T-test analysis.
-
Expresson data file = KIRC.meth.for_correlation.filtered_data.txt
-
Clinical data file = KIRC.clin.merged.picked.txt
-
Number of patients = 263
-
Number of genes = 17380
-
Number of clinical features = 9
For survival clinical features, Wald's test in univariate Cox regression analysis with proportional hazards model (Andersen and Gill 1982) was used to estimate the P values using the 'coxph' function in R. Kaplan-Meier survival curves were plot using the four quartile subgroups of patients based on expression levels
For continuous numerical clinical features, Spearman's rank correlation coefficients (Spearman 1904) and two-tailed P values were estimated using 'cor.test' function in R
For two-class clinical features, two-tailed Student's t test with unequal variance (Lehmann and Romano 2005) was applied to compare the log2-expression levels between the two clinical classes using 't.test' function in R
For multiple hypothesis correction, Q value is the False Discovery Rate (FDR) analogue of the P value (Benjamini and Hochberg 1995), defined as the minimum FDR at which the test may be called significant. We used the 'Benjamini and Hochberg' method of 'p.adjust' function in R to convert P values into Q values.
This is an experimental feature. The full results of the analysis summarized in this report can be downloaded from the TCGA Data Coordination Center.