This pipeline computes the correlation between cancer subtypes identified by different molecular patterns and selected clinical features.
Testing the association between subtypes identified by 10 different clustering approaches and 9 clinical features across 502 patients, 47 significant findings detected with P value < 0.05.
-
CNMF clustering analysis on array-based mRNA expression data identified 3 subtypes that correlate to 'PATHOLOGY.T' and 'TUMOR.STAGE'.
-
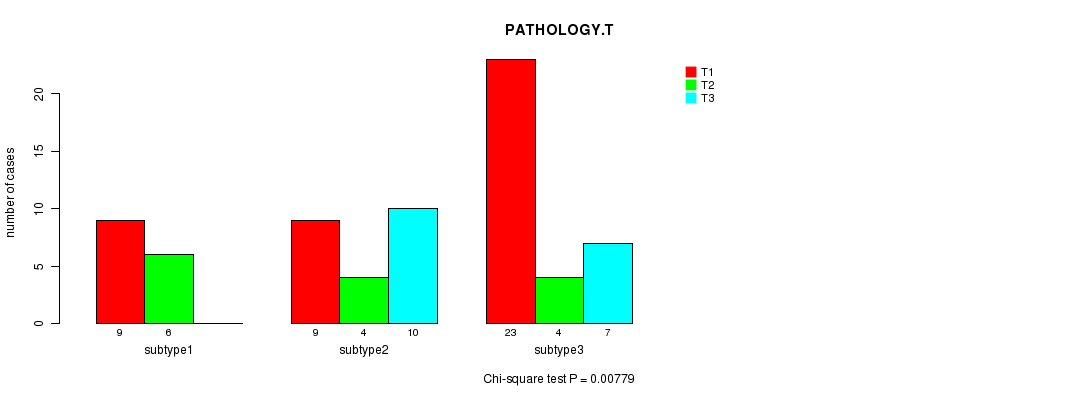
Consensus hierarchical clustering analysis on array-based mRNA expression data identified 3 subtypes that correlate to 'PATHOLOGY.T' and 'TUMOR.STAGE'.
-
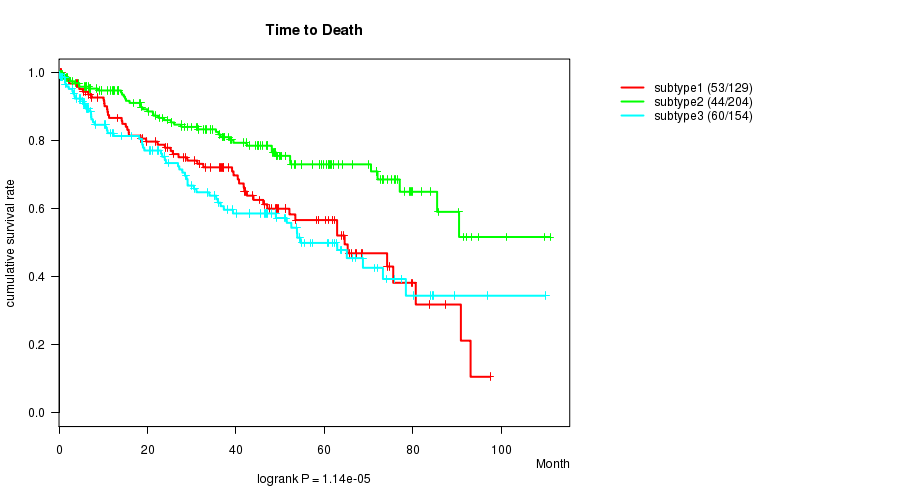
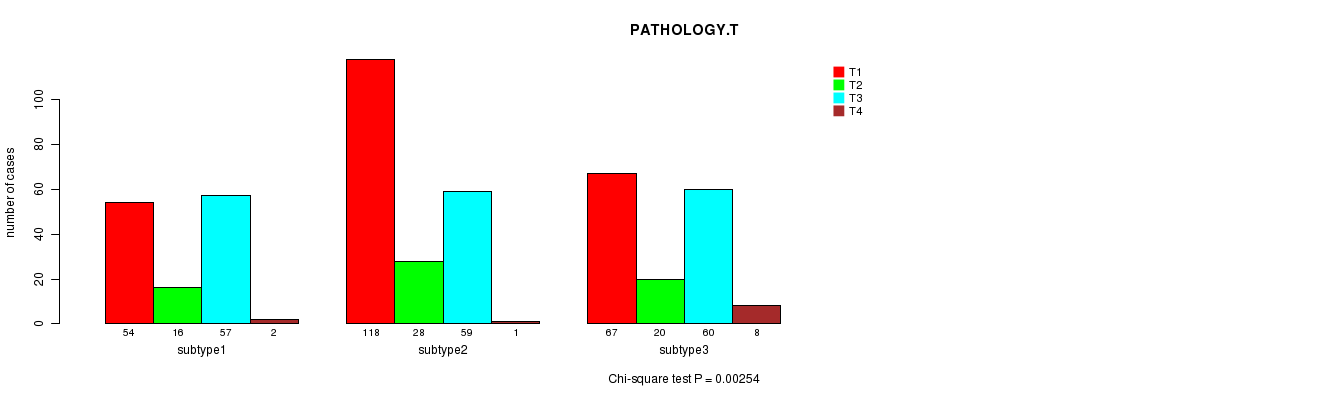
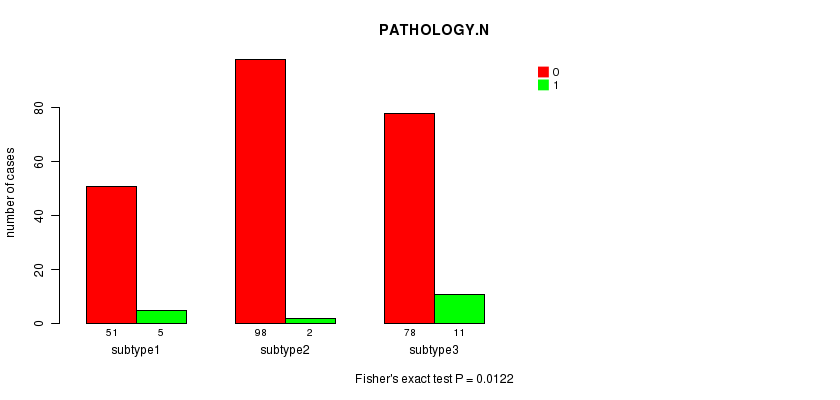
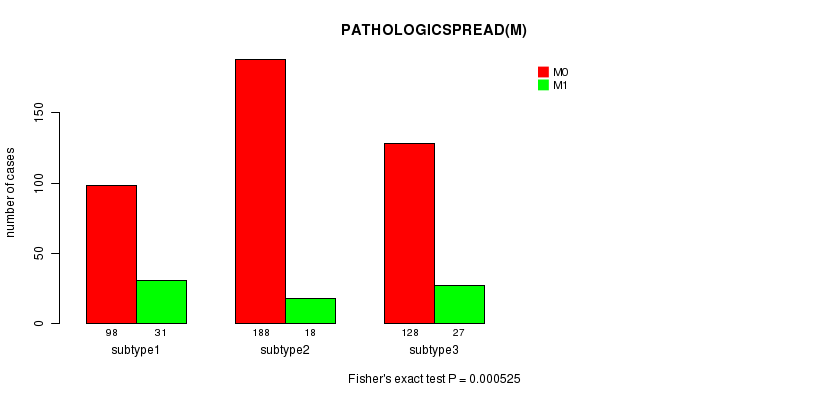
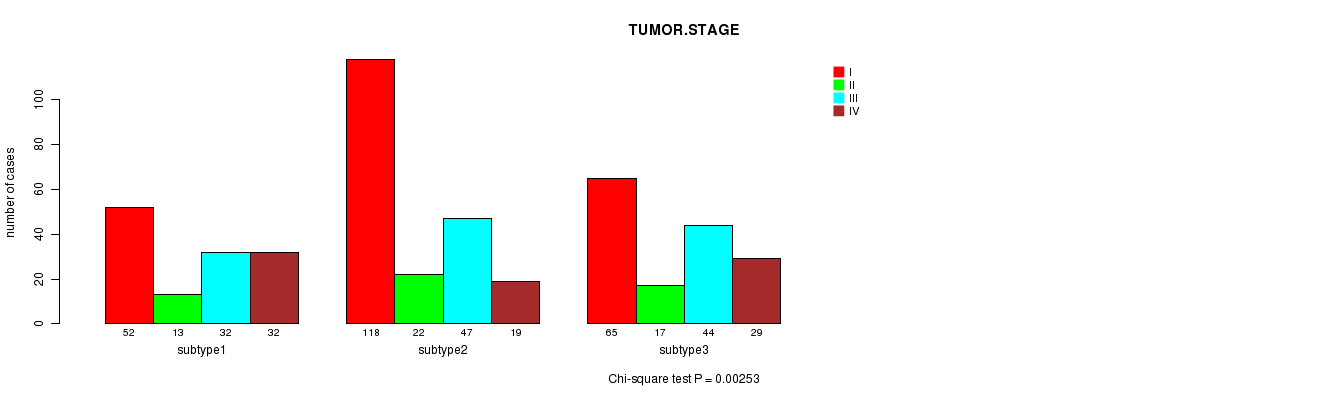
3 subtypes identified in current cancer cohort by 'CN CNMF'. These subtypes correlate to 'Time to Death', 'GENDER', 'PATHOLOGY.T', 'PATHOLOGY.N', 'PATHOLOGICSPREAD(M)', and 'TUMOR.STAGE'.
-
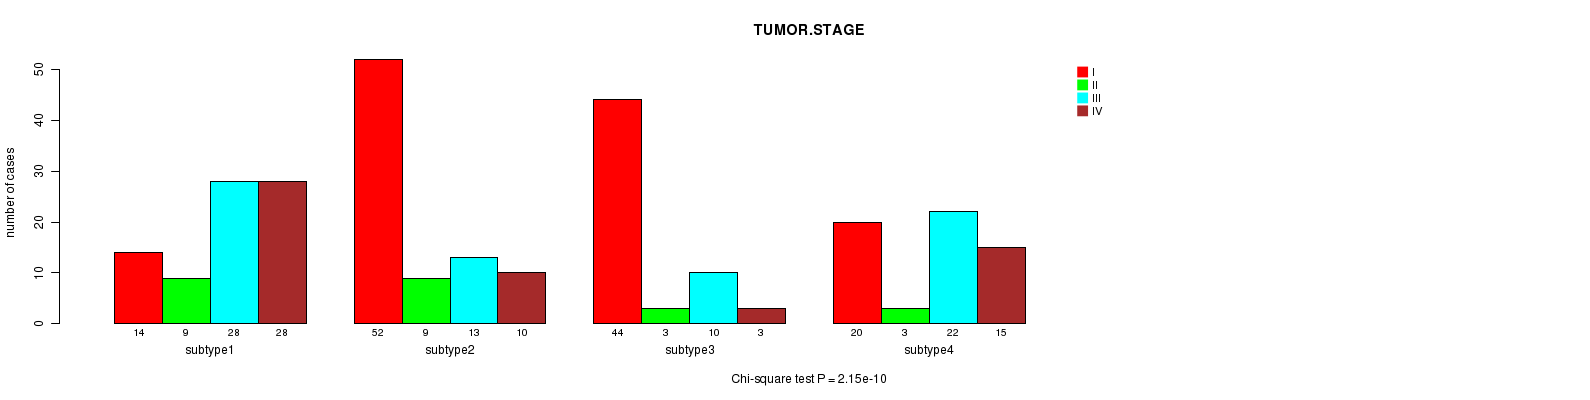
4 subtypes identified in current cancer cohort by 'METHLYATION CNMF'. These subtypes correlate to 'Time to Death', 'AGE', 'GENDER', 'PATHOLOGY.T', 'PATHOLOGICSPREAD(M)', and 'TUMOR.STAGE'.
-
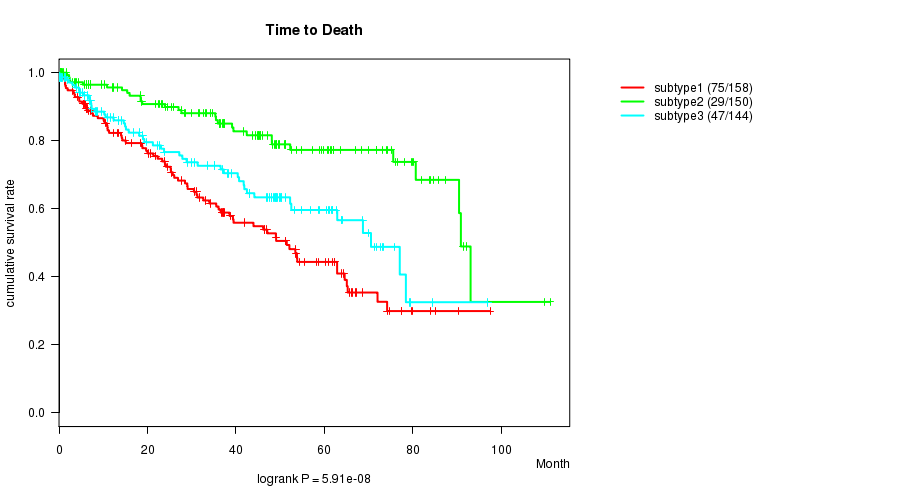
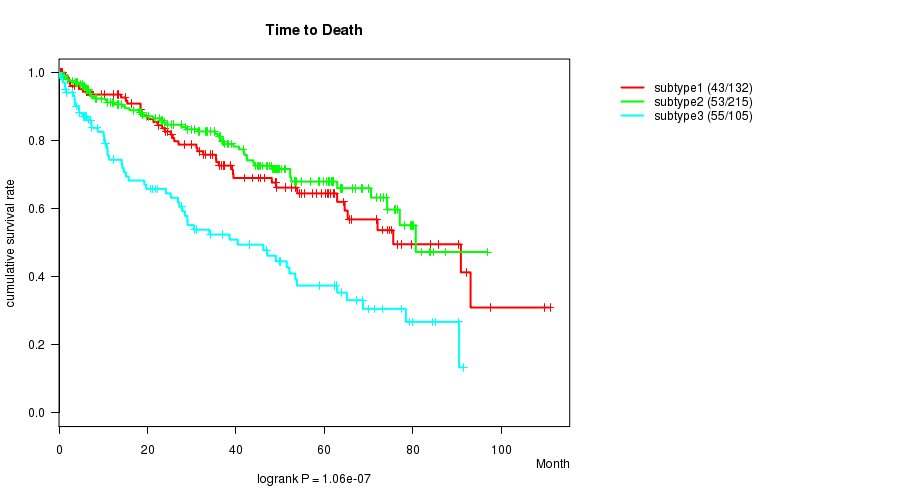
CNMF clustering analysis on RPPA data identified 3 subtypes that correlate to 'Time to Death', 'PATHOLOGY.T', 'PATHOLOGICSPREAD(M)', and 'TUMOR.STAGE'.
-
Consensus hierarchical clustering analysis on RPPA data identified 3 subtypes that correlate to 'Time to Death', 'KARNOFSKY.PERFORMANCE.SCORE', 'PATHOLOGY.T', 'PATHOLOGICSPREAD(M)', and 'TUMOR.STAGE'.
-
CNMF clustering analysis on sequencing-based mRNA expression data identified 3 subtypes that correlate to 'Time to Death', 'GENDER', 'PATHOLOGY.T', 'PATHOLOGY.N', 'PATHOLOGICSPREAD(M)', and 'TUMOR.STAGE'.
-
Consensus hierarchical clustering analysis on sequencing-based mRNA expression data identified 3 subtypes that correlate to 'Time to Death', 'GENDER', 'PATHOLOGY.T', 'PATHOLOGY.N', 'PATHOLOGICSPREAD(M)', and 'TUMOR.STAGE'.
-
CNMF clustering analysis on sequencing-based miR expression data identified 3 subtypes that correlate to 'Time to Death', 'GENDER', 'PATHOLOGY.T', 'PATHOLOGY.N', 'PATHOLOGICSPREAD(M)', and 'TUMOR.STAGE'.
-
Consensus hierarchical clustering analysis on sequencing-based miR expression data identified 3 subtypes that correlate to 'Time to Death', 'PATHOLOGY.T', 'PATHOLOGY.N', and 'TUMOR.STAGE'.
Table 1. Get Full Table Overview of the association between subtypes identified by 10 different clustering approaches and 9 clinical features. Shown in the table are P values from statistical tests. Thresholded by P value < 0.05, 47 significant findings detected.
|
Clinical Features |
Time to Death |
AGE | GENDER |
KARNOFSKY PERFORMANCE SCORE |
PATHOLOGY T |
PATHOLOGY N |
PATHOLOGICSPREAD(M) |
TUMOR STAGE |
NEOADJUVANT THERAPY |
| Statistical Tests | logrank test | ANOVA | Fisher's exact test | ANOVA | Chi-square test | Fisher's exact test | Fisher's exact test | Chi-square test | Fisher's exact test |
| mRNA CNMF subtypes | 0.0868 | 0.795 | 0.634 | 0.00911 | 0.0704 | 0.12 | 0.0134 | 0.194 | |
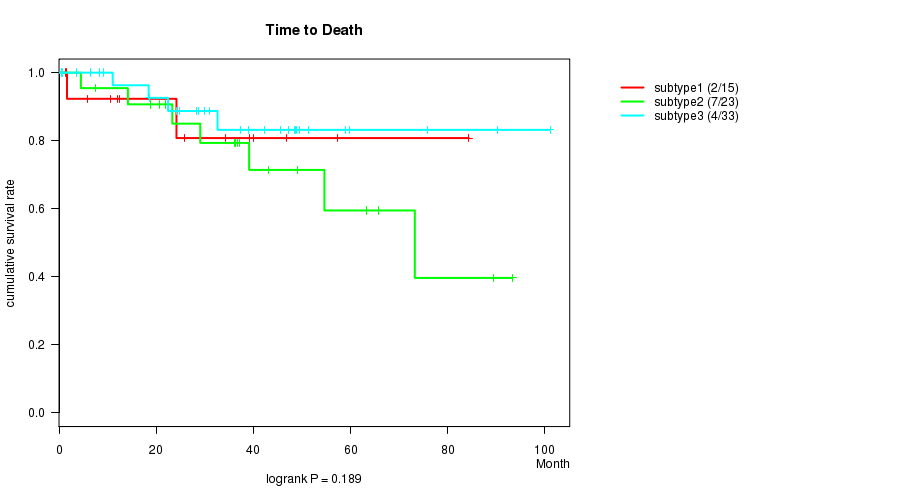
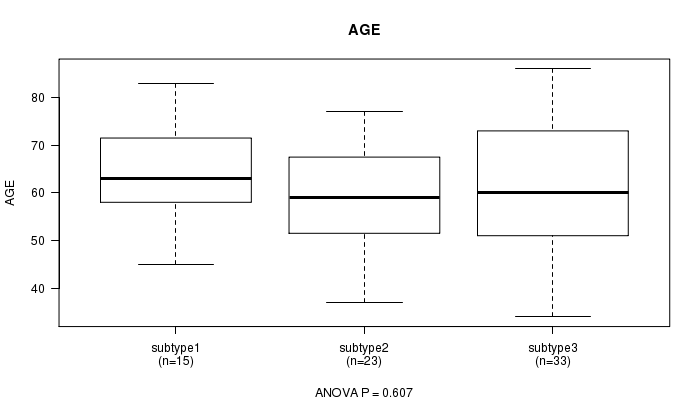
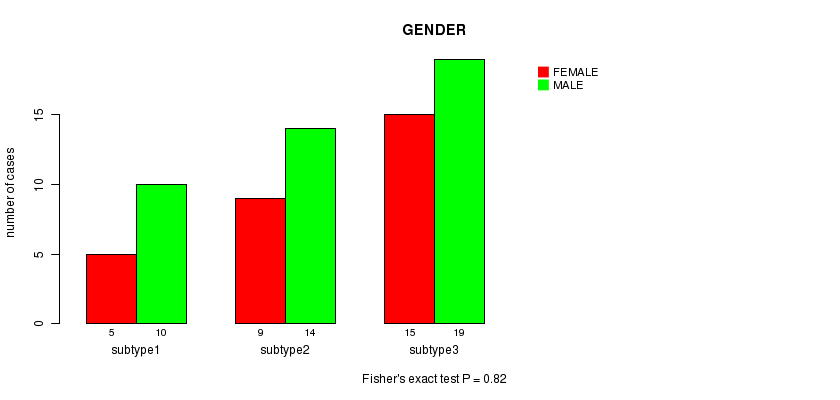
| mRNA cHierClus subtypes | 0.189 | 0.607 | 0.82 | 0.00779 | 0.124 | 0.0988 | 0.0102 | 0.208 | |
| CN CNMF | 1.14e-05 | 0.0703 | 0.0383 | 0.888 | 0.00254 | 0.0122 | 0.000525 | 0.00253 | 0.735 |
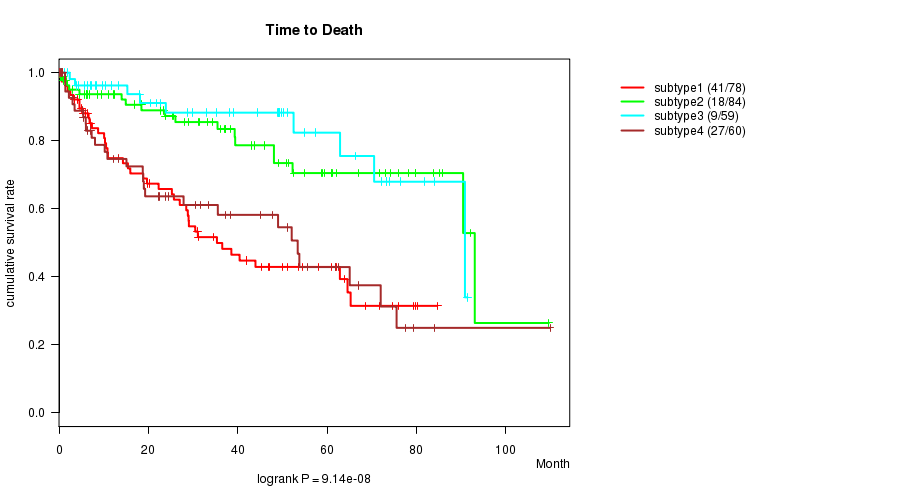
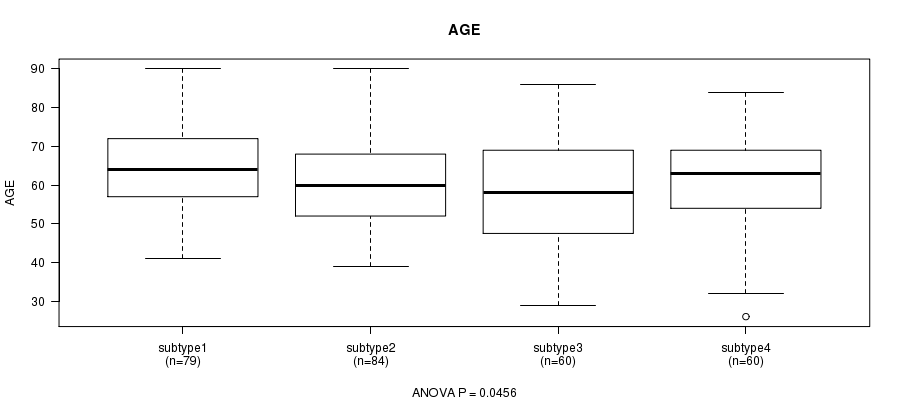
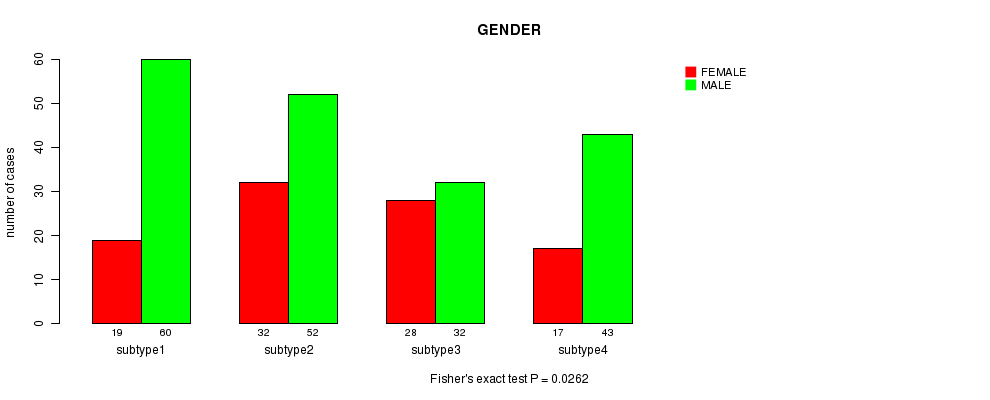
| METHLYATION CNMF | 9.14e-08 | 0.0456 | 0.0262 | 0.647 | 8.27e-11 | 0.0718 | 9.62e-05 | 2.15e-10 | 0.782 |
| RPPA CNMF subtypes | 5.91e-08 | 0.127 | 0.22 | 0.552 | 4.3e-06 | 0.149 | 5.29e-06 | 9.71e-08 | 0.332 |
| RPPA cHierClus subtypes | 1.06e-07 | 0.0772 | 0.336 | 0.0291 | 1.02e-07 | 0.252 | 0.000361 | 1.59e-07 | 0.1 |
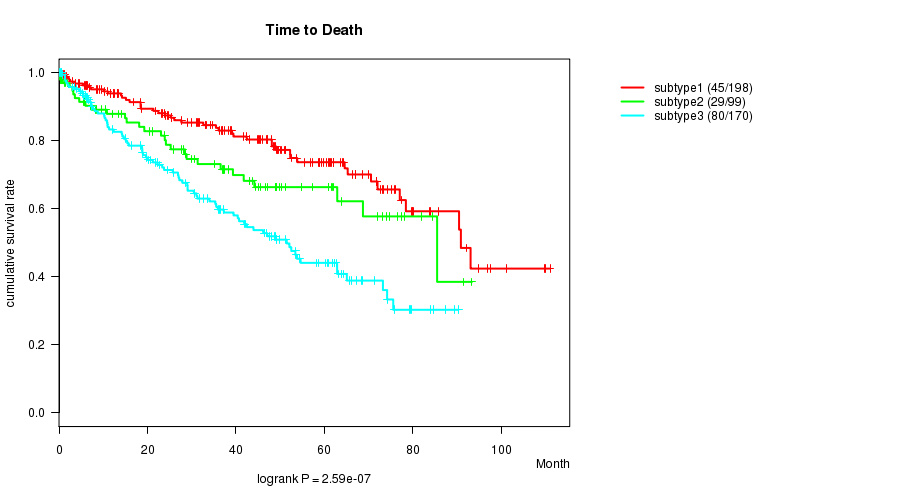
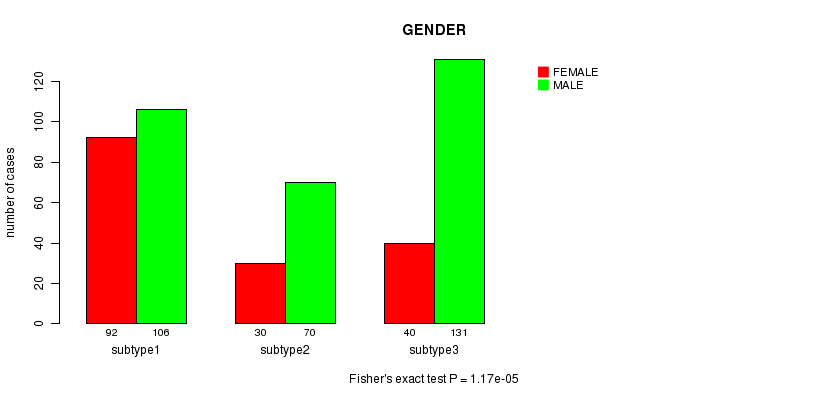
| RNAseq CNMF subtypes | 2.59e-07 | 0.323 | 1.17e-05 | 0.709 | 1.37e-05 | 0.00986 | 0.000475 | 2.6e-06 | 1 |
| RNAseq cHierClus subtypes | 1.03e-09 | 0.335 | 0.00361 | 0.342 | 1.66e-10 | 0.00446 | 4.85e-05 | 7.47e-11 | 0.654 |
| MIRseq CNMF subtypes | 1.29e-06 | 0.0537 | 0.00265 | 0.149 | 0.00028 | 0.00693 | 0.000305 | 8.11e-05 | 0.53 |
| MIRseq cHierClus subtypes | 4.57e-06 | 0.0521 | 0.182 | 0.849 | 0.00064 | 0.00892 | 0.282 | 0.0143 | 0.123 |
Table S1. Get Full Table Description of clustering approach #1: 'mRNA CNMF subtypes'
| Cluster Labels | 1 | 2 | 3 |
|---|---|---|---|
| Number of samples | 34 | 24 | 14 |
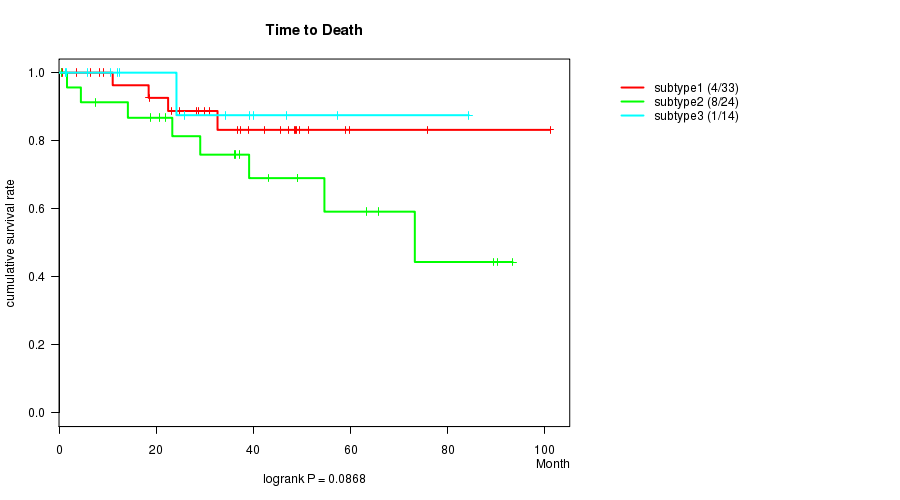
P value = 0.0868 (logrank test)
Table S2. Clustering Approach #1: 'mRNA CNMF subtypes' versus Clinical Feature #1: 'Time to Death'
| nPatients | nDeath | Duration Range (Median), Month | |
|---|---|---|---|
| ALL | 71 | 13 | 0.5 - 101.1 (32.6) |
| subtype1 | 33 | 4 | 0.5 - 101.1 (31.0) |
| subtype2 | 24 | 8 | 0.5 - 93.3 (36.7) |
| subtype3 | 14 | 1 | 1.3 - 84.4 (25.0) |
Figure S1. Get High-res Image Clustering Approach #1: 'mRNA CNMF subtypes' versus Clinical Feature #1: 'Time to Death'
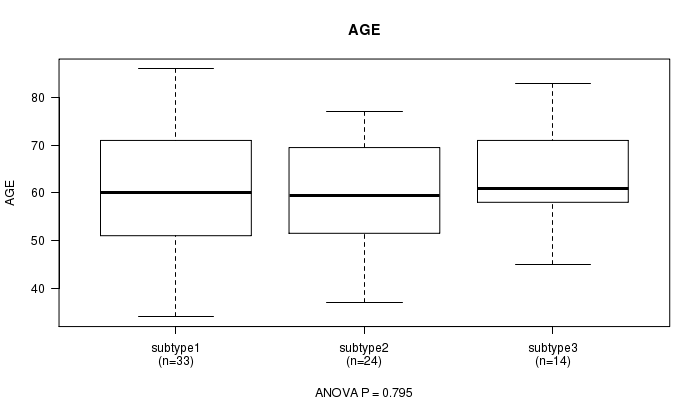
P value = 0.795 (ANOVA)
Table S3. Clustering Approach #1: 'mRNA CNMF subtypes' versus Clinical Feature #2: 'AGE'
| nPatients | Mean (Std.Dev) | |
|---|---|---|
| ALL | 71 | 60.5 (12.4) |
| subtype1 | 33 | 60.2 (13.8) |
| subtype2 | 24 | 59.9 (11.1) |
| subtype3 | 14 | 62.6 (11.3) |
Figure S2. Get High-res Image Clustering Approach #1: 'mRNA CNMF subtypes' versus Clinical Feature #2: 'AGE'
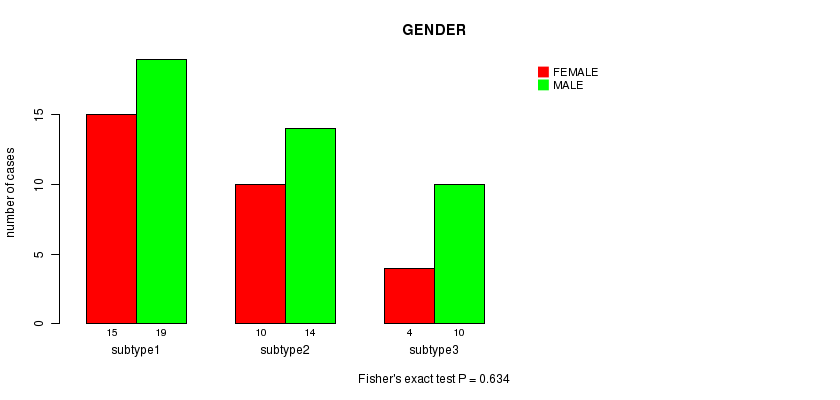
P value = 0.634 (Fisher's exact test)
Table S4. Clustering Approach #1: 'mRNA CNMF subtypes' versus Clinical Feature #3: 'GENDER'
| nPatients | FEMALE | MALE |
|---|---|---|
| ALL | 29 | 43 |
| subtype1 | 15 | 19 |
| subtype2 | 10 | 14 |
| subtype3 | 4 | 10 |
Figure S3. Get High-res Image Clustering Approach #1: 'mRNA CNMF subtypes' versus Clinical Feature #3: 'GENDER'
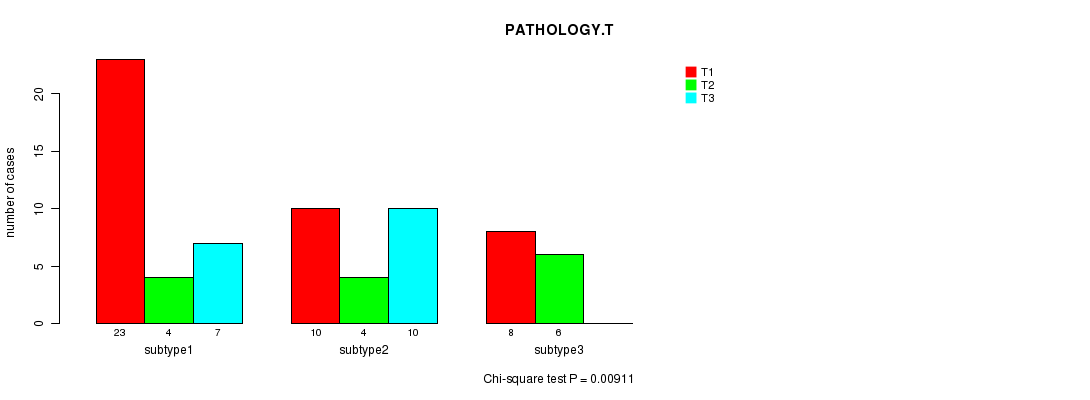
P value = 0.00911 (Chi-square test)
Table S5. Clustering Approach #1: 'mRNA CNMF subtypes' versus Clinical Feature #5: 'PATHOLOGY.T'
| nPatients | T1 | T2 | T3 |
|---|---|---|---|
| ALL | 41 | 14 | 17 |
| subtype1 | 23 | 4 | 7 |
| subtype2 | 10 | 4 | 10 |
| subtype3 | 8 | 6 | 0 |
Figure S4. Get High-res Image Clustering Approach #1: 'mRNA CNMF subtypes' versus Clinical Feature #5: 'PATHOLOGY.T'
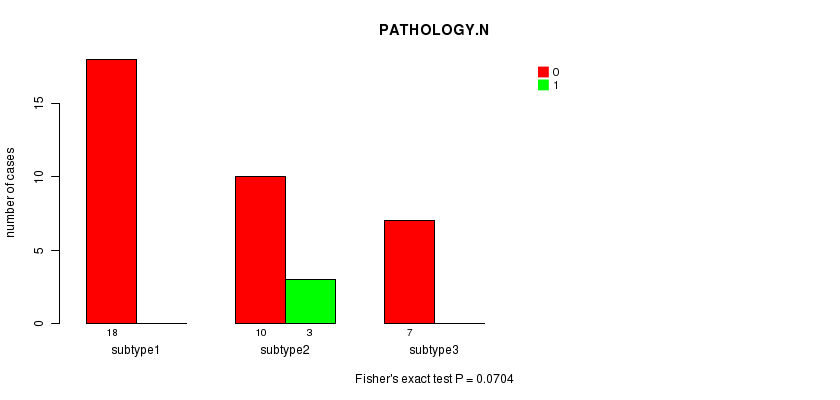
P value = 0.0704 (Fisher's exact test)
Table S6. Clustering Approach #1: 'mRNA CNMF subtypes' versus Clinical Feature #6: 'PATHOLOGY.N'
| nPatients | 0 | 1 |
|---|---|---|
| ALL | 35 | 3 |
| subtype1 | 18 | 0 |
| subtype2 | 10 | 3 |
| subtype3 | 7 | 0 |
Figure S5. Get High-res Image Clustering Approach #1: 'mRNA CNMF subtypes' versus Clinical Feature #6: 'PATHOLOGY.N'
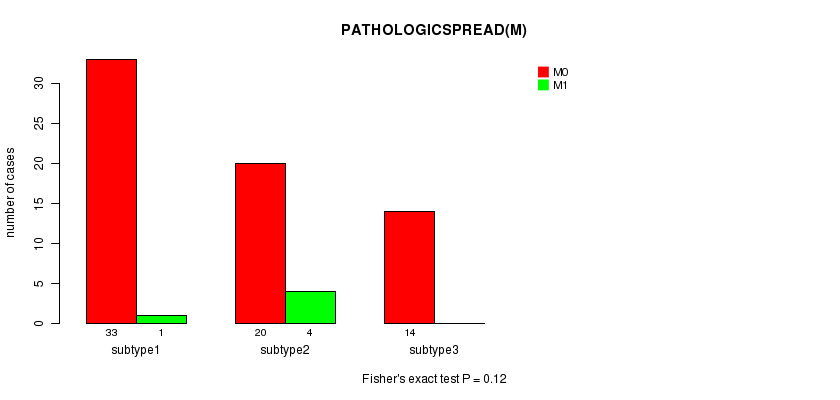
P value = 0.12 (Fisher's exact test)
Table S7. Clustering Approach #1: 'mRNA CNMF subtypes' versus Clinical Feature #7: 'PATHOLOGICSPREAD(M)'
| nPatients | M0 | M1 |
|---|---|---|
| ALL | 67 | 5 |
| subtype1 | 33 | 1 |
| subtype2 | 20 | 4 |
| subtype3 | 14 | 0 |
Figure S6. Get High-res Image Clustering Approach #1: 'mRNA CNMF subtypes' versus Clinical Feature #7: 'PATHOLOGICSPREAD(M)'
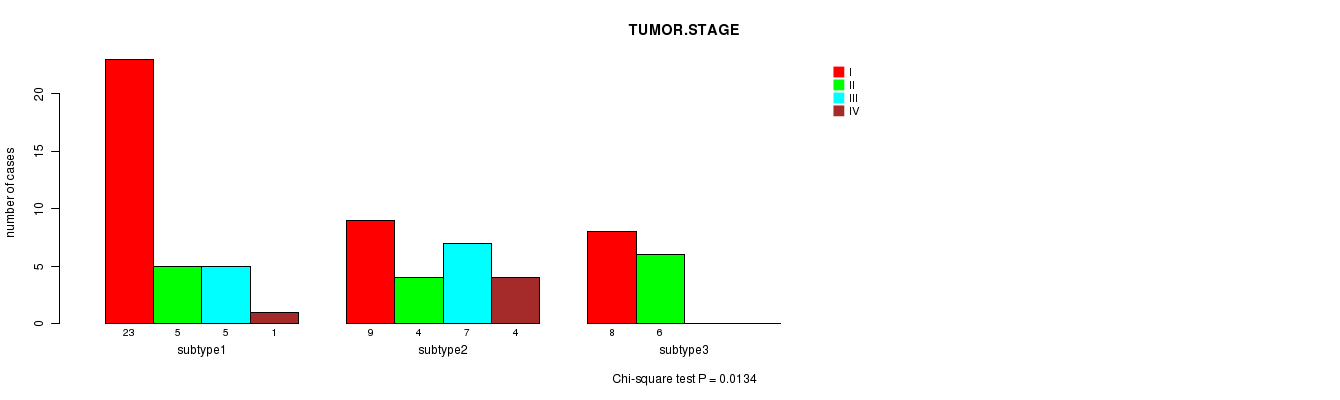
P value = 0.0134 (Chi-square test)
Table S8. Clustering Approach #1: 'mRNA CNMF subtypes' versus Clinical Feature #8: 'TUMOR.STAGE'
| nPatients | I | II | III | IV |
|---|---|---|---|---|
| ALL | 40 | 15 | 12 | 5 |
| subtype1 | 23 | 5 | 5 | 1 |
| subtype2 | 9 | 4 | 7 | 4 |
| subtype3 | 8 | 6 | 0 | 0 |
Figure S7. Get High-res Image Clustering Approach #1: 'mRNA CNMF subtypes' versus Clinical Feature #8: 'TUMOR.STAGE'
P value = 0.194 (Fisher's exact test)
Table S9. Clustering Approach #1: 'mRNA CNMF subtypes' versus Clinical Feature #9: 'NEOADJUVANT.THERAPY'
| nPatients | NO | YES |
|---|---|---|
| ALL | 1 | 71 |
| subtype1 | 0 | 34 |
| subtype2 | 0 | 24 |
| subtype3 | 1 | 13 |
Figure S8. Get High-res Image Clustering Approach #1: 'mRNA CNMF subtypes' versus Clinical Feature #9: 'NEOADJUVANT.THERAPY'
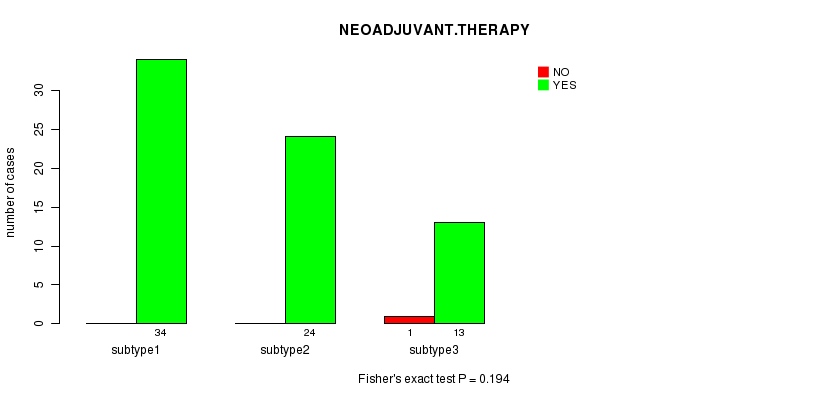
Table S10. Get Full Table Description of clustering approach #2: 'mRNA cHierClus subtypes'
| Cluster Labels | 1 | 2 | 3 |
|---|---|---|---|
| Number of samples | 15 | 23 | 34 |
P value = 0.189 (logrank test)
Table S11. Clustering Approach #2: 'mRNA cHierClus subtypes' versus Clinical Feature #1: 'Time to Death'
| nPatients | nDeath | Duration Range (Median), Month | |
|---|---|---|---|
| ALL | 71 | 13 | 0.5 - 101.1 (32.6) |
| subtype1 | 15 | 2 | 1.3 - 84.4 (24.2) |
| subtype2 | 23 | 7 | 0.5 - 93.3 (36.8) |
| subtype3 | 33 | 4 | 0.5 - 101.1 (31.0) |
Figure S9. Get High-res Image Clustering Approach #2: 'mRNA cHierClus subtypes' versus Clinical Feature #1: 'Time to Death'
P value = 0.607 (ANOVA)
Table S12. Clustering Approach #2: 'mRNA cHierClus subtypes' versus Clinical Feature #2: 'AGE'
| nPatients | Mean (Std.Dev) | |
|---|---|---|
| ALL | 71 | 60.5 (12.4) |
| subtype1 | 15 | 63.2 (11.2) |
| subtype2 | 23 | 59.1 (10.7) |
| subtype3 | 33 | 60.4 (14.0) |
Figure S10. Get High-res Image Clustering Approach #2: 'mRNA cHierClus subtypes' versus Clinical Feature #2: 'AGE'
P value = 0.82 (Fisher's exact test)
Table S13. Clustering Approach #2: 'mRNA cHierClus subtypes' versus Clinical Feature #3: 'GENDER'
| nPatients | FEMALE | MALE |
|---|---|---|
| ALL | 29 | 43 |
| subtype1 | 5 | 10 |
| subtype2 | 9 | 14 |
| subtype3 | 15 | 19 |
Figure S11. Get High-res Image Clustering Approach #2: 'mRNA cHierClus subtypes' versus Clinical Feature #3: 'GENDER'
P value = 0.00779 (Chi-square test)
Table S14. Clustering Approach #2: 'mRNA cHierClus subtypes' versus Clinical Feature #5: 'PATHOLOGY.T'
| nPatients | T1 | T2 | T3 |
|---|---|---|---|
| ALL | 41 | 14 | 17 |
| subtype1 | 9 | 6 | 0 |
| subtype2 | 9 | 4 | 10 |
| subtype3 | 23 | 4 | 7 |
Figure S12. Get High-res Image Clustering Approach #2: 'mRNA cHierClus subtypes' versus Clinical Feature #5: 'PATHOLOGY.T'
P value = 0.124 (Fisher's exact test)
Table S15. Clustering Approach #2: 'mRNA cHierClus subtypes' versus Clinical Feature #6: 'PATHOLOGY.N'
| nPatients | 0 | 1 |
|---|---|---|
| ALL | 35 | 3 |
| subtype1 | 7 | 0 |
| subtype2 | 11 | 3 |
| subtype3 | 17 | 0 |
Figure S13. Get High-res Image Clustering Approach #2: 'mRNA cHierClus subtypes' versus Clinical Feature #6: 'PATHOLOGY.N'
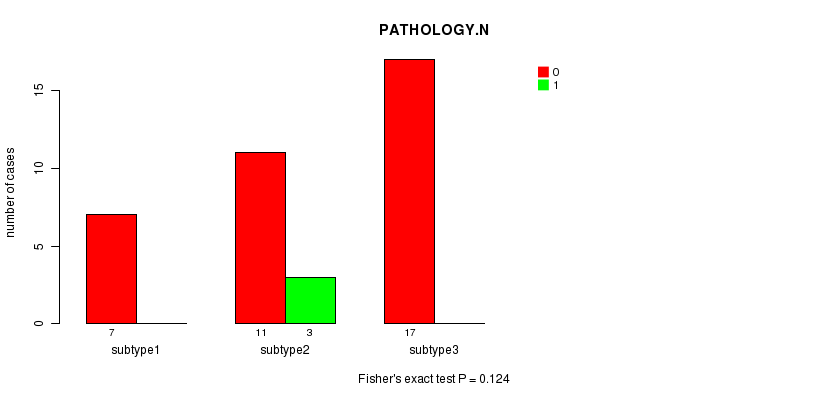
P value = 0.0988 (Fisher's exact test)
Table S16. Clustering Approach #2: 'mRNA cHierClus subtypes' versus Clinical Feature #7: 'PATHOLOGICSPREAD(M)'
| nPatients | M0 | M1 |
|---|---|---|
| ALL | 67 | 5 |
| subtype1 | 15 | 0 |
| subtype2 | 19 | 4 |
| subtype3 | 33 | 1 |
Figure S14. Get High-res Image Clustering Approach #2: 'mRNA cHierClus subtypes' versus Clinical Feature #7: 'PATHOLOGICSPREAD(M)'
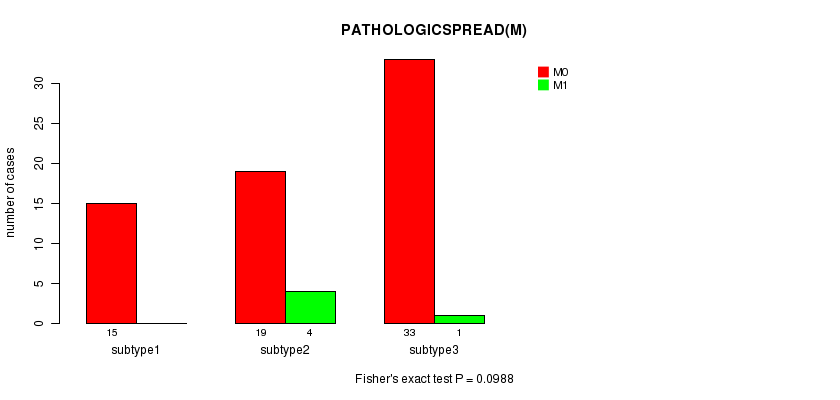
P value = 0.0102 (Chi-square test)
Table S17. Clustering Approach #2: 'mRNA cHierClus subtypes' versus Clinical Feature #8: 'TUMOR.STAGE'
| nPatients | I | II | III | IV |
|---|---|---|---|---|
| ALL | 40 | 15 | 12 | 5 |
| subtype1 | 9 | 6 | 0 | 0 |
| subtype2 | 8 | 4 | 7 | 4 |
| subtype3 | 23 | 5 | 5 | 1 |
Figure S15. Get High-res Image Clustering Approach #2: 'mRNA cHierClus subtypes' versus Clinical Feature #8: 'TUMOR.STAGE'
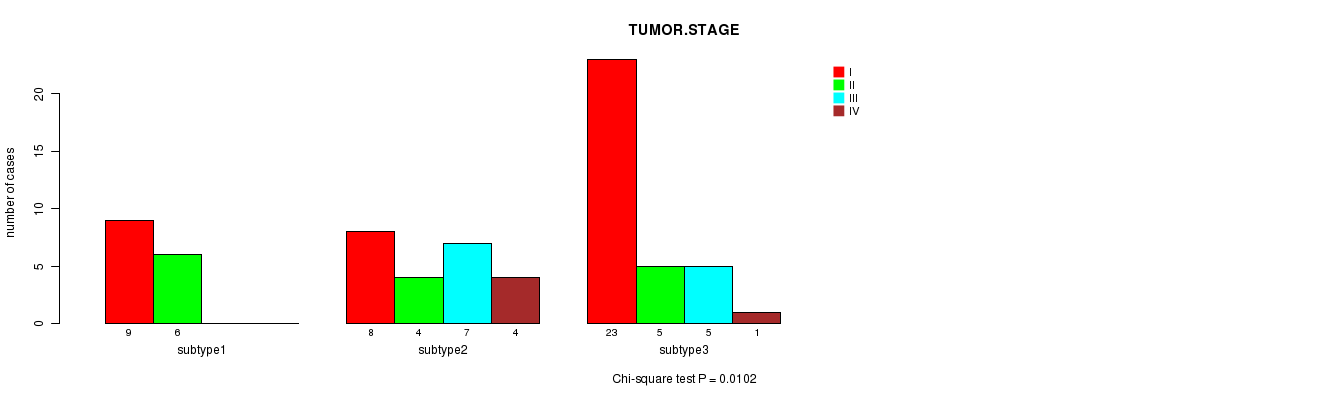
P value = 0.208 (Fisher's exact test)
Table S18. Clustering Approach #2: 'mRNA cHierClus subtypes' versus Clinical Feature #9: 'NEOADJUVANT.THERAPY'
| nPatients | NO | YES |
|---|---|---|
| ALL | 1 | 71 |
| subtype1 | 1 | 14 |
| subtype2 | 0 | 23 |
| subtype3 | 0 | 34 |
Figure S16. Get High-res Image Clustering Approach #2: 'mRNA cHierClus subtypes' versus Clinical Feature #9: 'NEOADJUVANT.THERAPY'
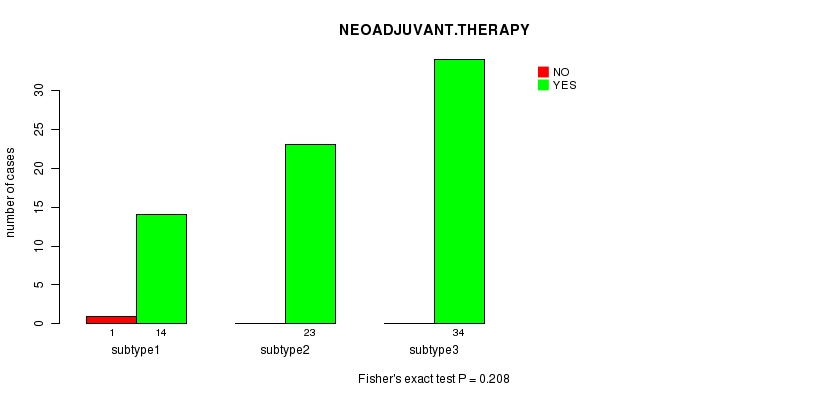
Table S19. Get Full Table Description of clustering approach #3: 'CN CNMF'
| Cluster Labels | 1 | 2 | 3 |
|---|---|---|---|
| Number of samples | 129 | 206 | 155 |
P value = 1.14e-05 (logrank test)
Table S20. Clustering Approach #3: 'CN CNMF' versus Clinical Feature #1: 'Time to Death'
| nPatients | nDeath | Duration Range (Median), Month | |
|---|---|---|---|
| ALL | 487 | 157 | 0.1 - 111.0 (34.6) |
| subtype1 | 129 | 53 | 0.3 - 97.5 (37.1) |
| subtype2 | 204 | 44 | 0.1 - 111.0 (37.3) |
| subtype3 | 154 | 60 | 0.1 - 109.9 (27.0) |
Figure S17. Get High-res Image Clustering Approach #3: 'CN CNMF' versus Clinical Feature #1: 'Time to Death'
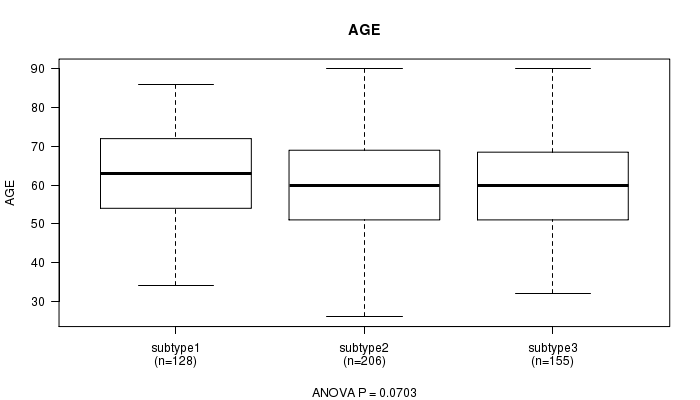
P value = 0.0703 (ANOVA)
Table S21. Clustering Approach #3: 'CN CNMF' versus Clinical Feature #2: 'AGE'
| nPatients | Mean (Std.Dev) | |
|---|---|---|
| ALL | 489 | 60.6 (12.2) |
| subtype1 | 128 | 62.8 (11.8) |
| subtype2 | 206 | 59.8 (12.6) |
| subtype3 | 155 | 59.9 (11.8) |
Figure S18. Get High-res Image Clustering Approach #3: 'CN CNMF' versus Clinical Feature #2: 'AGE'
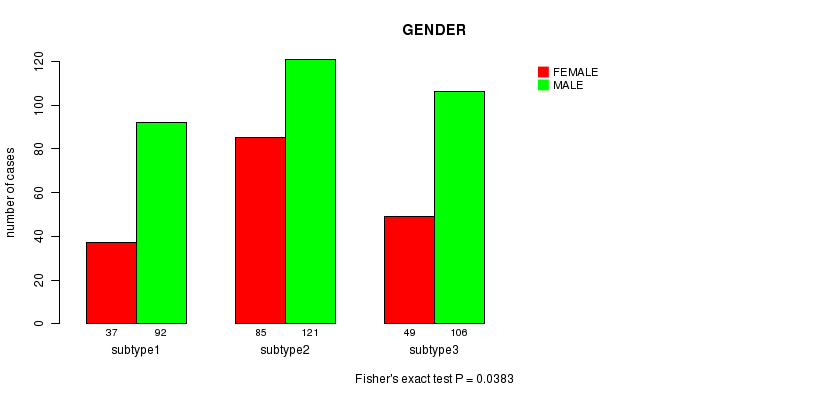
P value = 0.0383 (Fisher's exact test)
Table S22. Clustering Approach #3: 'CN CNMF' versus Clinical Feature #3: 'GENDER'
| nPatients | FEMALE | MALE |
|---|---|---|
| ALL | 171 | 319 |
| subtype1 | 37 | 92 |
| subtype2 | 85 | 121 |
| subtype3 | 49 | 106 |
Figure S19. Get High-res Image Clustering Approach #3: 'CN CNMF' versus Clinical Feature #3: 'GENDER'
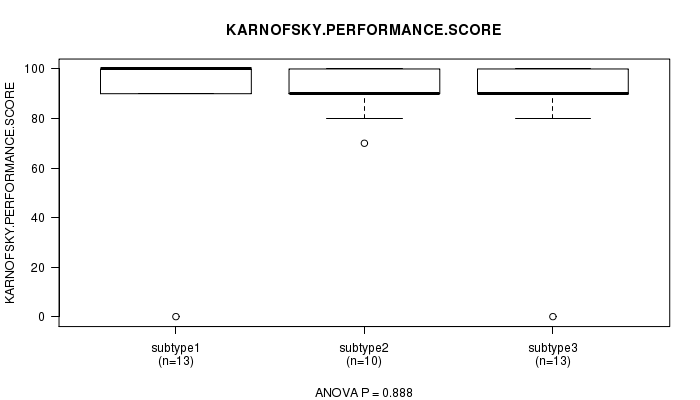
P value = 0.888 (ANOVA)
Table S23. Clustering Approach #3: 'CN CNMF' versus Clinical Feature #4: 'KARNOFSKY.PERFORMANCE.SCORE'
| nPatients | Mean (Std.Dev) | |
|---|---|---|
| ALL | 36 | 88.3 (23.0) |
| subtype1 | 13 | 88.5 (27.0) |
| subtype2 | 10 | 91.0 (9.9) |
| subtype3 | 13 | 86.2 (26.9) |
Figure S20. Get High-res Image Clustering Approach #3: 'CN CNMF' versus Clinical Feature #4: 'KARNOFSKY.PERFORMANCE.SCORE'
P value = 0.00254 (Chi-square test)
Table S24. Clustering Approach #3: 'CN CNMF' versus Clinical Feature #5: 'PATHOLOGY.T'
| nPatients | T1 | T2 | T3 | T4 |
|---|---|---|---|---|
| ALL | 239 | 64 | 176 | 11 |
| subtype1 | 54 | 16 | 57 | 2 |
| subtype2 | 118 | 28 | 59 | 1 |
| subtype3 | 67 | 20 | 60 | 8 |
Figure S21. Get High-res Image Clustering Approach #3: 'CN CNMF' versus Clinical Feature #5: 'PATHOLOGY.T'
P value = 0.0122 (Fisher's exact test)
Table S25. Clustering Approach #3: 'CN CNMF' versus Clinical Feature #6: 'PATHOLOGY.N'
| nPatients | 0 | 1 |
|---|---|---|
| ALL | 227 | 18 |
| subtype1 | 51 | 5 |
| subtype2 | 98 | 2 |
| subtype3 | 78 | 11 |
Figure S22. Get High-res Image Clustering Approach #3: 'CN CNMF' versus Clinical Feature #6: 'PATHOLOGY.N'
P value = 0.000525 (Fisher's exact test)
Table S26. Clustering Approach #3: 'CN CNMF' versus Clinical Feature #7: 'PATHOLOGICSPREAD(M)'
| nPatients | M0 | M1 |
|---|---|---|
| ALL | 414 | 76 |
| subtype1 | 98 | 31 |
| subtype2 | 188 | 18 |
| subtype3 | 128 | 27 |
Figure S23. Get High-res Image Clustering Approach #3: 'CN CNMF' versus Clinical Feature #7: 'PATHOLOGICSPREAD(M)'
P value = 0.00253 (Chi-square test)
Table S27. Clustering Approach #3: 'CN CNMF' versus Clinical Feature #8: 'TUMOR.STAGE'
| nPatients | I | II | III | IV |
|---|---|---|---|---|
| ALL | 235 | 52 | 123 | 80 |
| subtype1 | 52 | 13 | 32 | 32 |
| subtype2 | 118 | 22 | 47 | 19 |
| subtype3 | 65 | 17 | 44 | 29 |
Figure S24. Get High-res Image Clustering Approach #3: 'CN CNMF' versus Clinical Feature #8: 'TUMOR.STAGE'
P value = 0.735 (Fisher's exact test)
Table S28. Clustering Approach #3: 'CN CNMF' versus Clinical Feature #9: 'NEOADJUVANT.THERAPY'
| nPatients | NO | YES |
|---|---|---|
| ALL | 5 | 485 |
| subtype1 | 2 | 127 |
| subtype2 | 2 | 204 |
| subtype3 | 1 | 154 |
Figure S25. Get High-res Image Clustering Approach #3: 'CN CNMF' versus Clinical Feature #9: 'NEOADJUVANT.THERAPY'
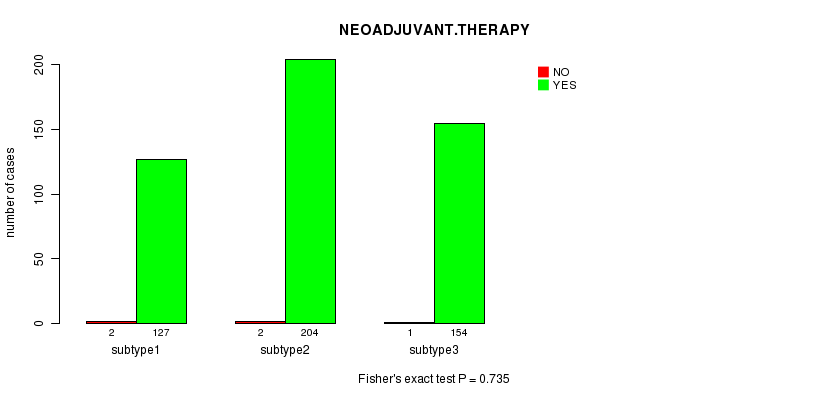
Table S29. Get Full Table Description of clustering approach #4: 'METHLYATION CNMF'
| Cluster Labels | 1 | 2 | 3 | 4 |
|---|---|---|---|---|
| Number of samples | 79 | 84 | 60 | 60 |
P value = 9.14e-08 (logrank test)
Table S30. Clustering Approach #4: 'METHLYATION CNMF' versus Clinical Feature #1: 'Time to Death'
| nPatients | nDeath | Duration Range (Median), Month | |
|---|---|---|---|
| ALL | 281 | 95 | 0.1 - 109.9 (28.5) |
| subtype1 | 78 | 41 | 0.2 - 84.7 (27.7) |
| subtype2 | 84 | 18 | 0.1 - 109.6 (34.9) |
| subtype3 | 59 | 9 | 0.3 - 91.4 (29.9) |
| subtype4 | 60 | 27 | 0.1 - 109.9 (19.1) |
Figure S26. Get High-res Image Clustering Approach #4: 'METHLYATION CNMF' versus Clinical Feature #1: 'Time to Death'
P value = 0.0456 (ANOVA)
Table S31. Clustering Approach #4: 'METHLYATION CNMF' versus Clinical Feature #2: 'AGE'
| nPatients | Mean (Std.Dev) | |
|---|---|---|
| ALL | 283 | 61.5 (12.0) |
| subtype1 | 79 | 64.2 (10.7) |
| subtype2 | 84 | 60.8 (11.7) |
| subtype3 | 60 | 58.6 (13.7) |
| subtype4 | 60 | 61.7 (11.7) |
Figure S27. Get High-res Image Clustering Approach #4: 'METHLYATION CNMF' versus Clinical Feature #2: 'AGE'
P value = 0.0262 (Fisher's exact test)
Table S32. Clustering Approach #4: 'METHLYATION CNMF' versus Clinical Feature #3: 'GENDER'
| nPatients | FEMALE | MALE |
|---|---|---|
| ALL | 96 | 187 |
| subtype1 | 19 | 60 |
| subtype2 | 32 | 52 |
| subtype3 | 28 | 32 |
| subtype4 | 17 | 43 |
Figure S28. Get High-res Image Clustering Approach #4: 'METHLYATION CNMF' versus Clinical Feature #3: 'GENDER'
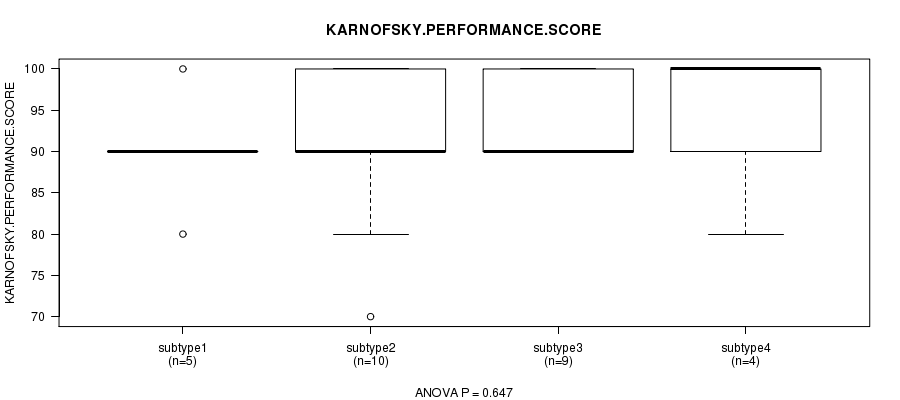
P value = 0.647 (ANOVA)
Table S33. Clustering Approach #4: 'METHLYATION CNMF' versus Clinical Feature #4: 'KARNOFSKY.PERFORMANCE.SCORE'
| nPatients | Mean (Std.Dev) | |
|---|---|---|
| ALL | 28 | 92.5 (8.0) |
| subtype1 | 5 | 90.0 (7.1) |
| subtype2 | 10 | 91.0 (9.9) |
| subtype3 | 9 | 94.4 (5.3) |
| subtype4 | 4 | 95.0 (10.0) |
Figure S29. Get High-res Image Clustering Approach #4: 'METHLYATION CNMF' versus Clinical Feature #4: 'KARNOFSKY.PERFORMANCE.SCORE'
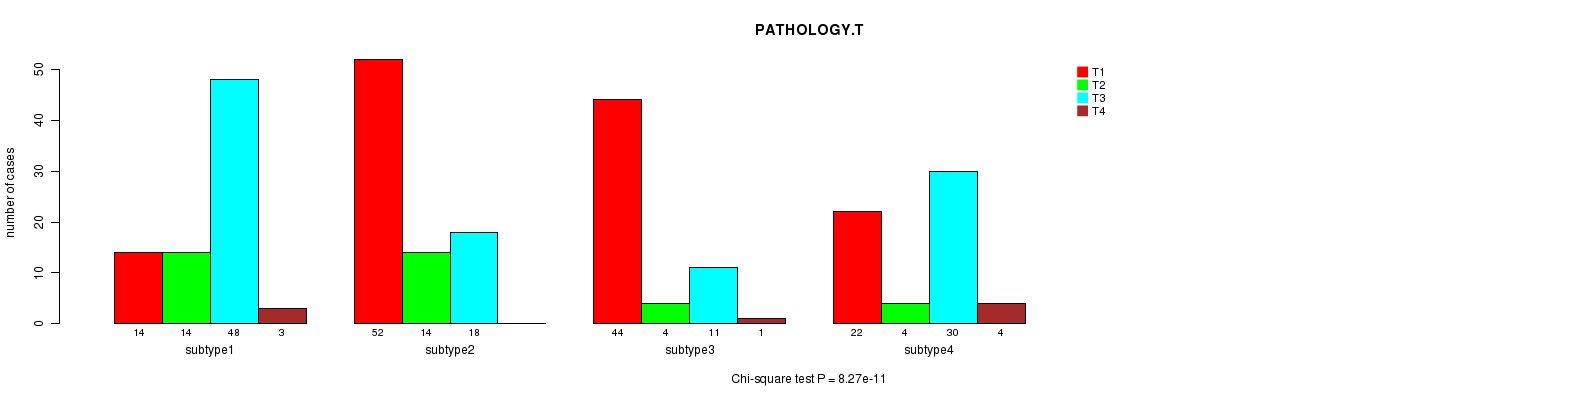
P value = 8.27e-11 (Chi-square test)
Table S34. Clustering Approach #4: 'METHLYATION CNMF' versus Clinical Feature #5: 'PATHOLOGY.T'
| nPatients | T1 | T2 | T3 | T4 |
|---|---|---|---|---|
| ALL | 132 | 36 | 107 | 8 |
| subtype1 | 14 | 14 | 48 | 3 |
| subtype2 | 52 | 14 | 18 | 0 |
| subtype3 | 44 | 4 | 11 | 1 |
| subtype4 | 22 | 4 | 30 | 4 |
Figure S30. Get High-res Image Clustering Approach #4: 'METHLYATION CNMF' versus Clinical Feature #5: 'PATHOLOGY.T'
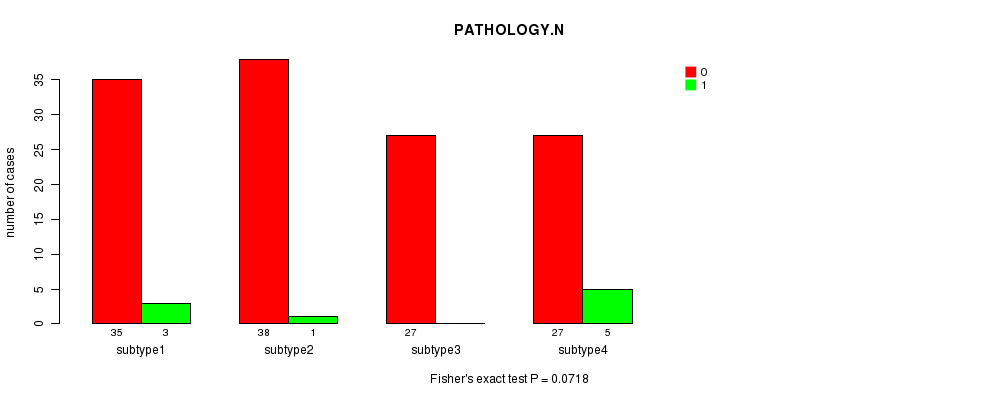
P value = 0.0718 (Fisher's exact test)
Table S35. Clustering Approach #4: 'METHLYATION CNMF' versus Clinical Feature #6: 'PATHOLOGY.N'
| nPatients | 0 | 1 |
|---|---|---|
| ALL | 127 | 9 |
| subtype1 | 35 | 3 |
| subtype2 | 38 | 1 |
| subtype3 | 27 | 0 |
| subtype4 | 27 | 5 |
Figure S31. Get High-res Image Clustering Approach #4: 'METHLYATION CNMF' versus Clinical Feature #6: 'PATHOLOGY.N'
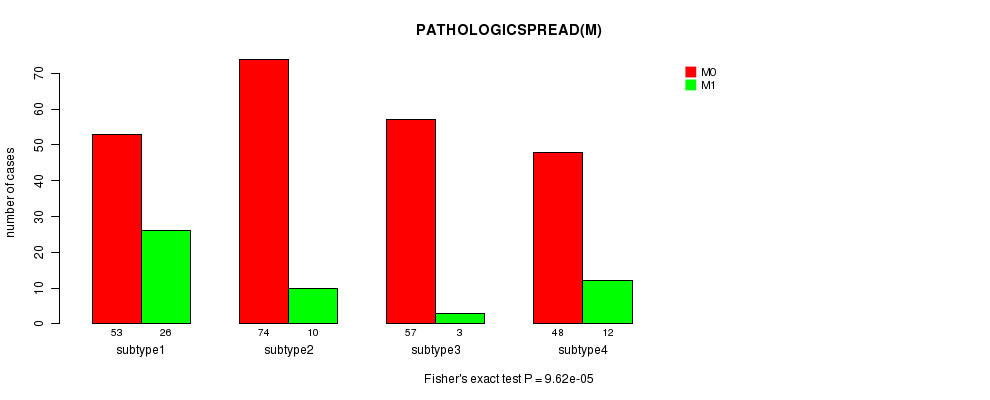
P value = 9.62e-05 (Fisher's exact test)
Table S36. Clustering Approach #4: 'METHLYATION CNMF' versus Clinical Feature #7: 'PATHOLOGICSPREAD(M)'
| nPatients | M0 | M1 |
|---|---|---|
| ALL | 232 | 51 |
| subtype1 | 53 | 26 |
| subtype2 | 74 | 10 |
| subtype3 | 57 | 3 |
| subtype4 | 48 | 12 |
Figure S32. Get High-res Image Clustering Approach #4: 'METHLYATION CNMF' versus Clinical Feature #7: 'PATHOLOGICSPREAD(M)'
P value = 2.15e-10 (Chi-square test)
Table S37. Clustering Approach #4: 'METHLYATION CNMF' versus Clinical Feature #8: 'TUMOR.STAGE'
| nPatients | I | II | III | IV |
|---|---|---|---|---|
| ALL | 130 | 24 | 73 | 56 |
| subtype1 | 14 | 9 | 28 | 28 |
| subtype2 | 52 | 9 | 13 | 10 |
| subtype3 | 44 | 3 | 10 | 3 |
| subtype4 | 20 | 3 | 22 | 15 |
Figure S33. Get High-res Image Clustering Approach #4: 'METHLYATION CNMF' versus Clinical Feature #8: 'TUMOR.STAGE'
P value = 0.782 (Fisher's exact test)
Table S38. Clustering Approach #4: 'METHLYATION CNMF' versus Clinical Feature #9: 'NEOADJUVANT.THERAPY'
| nPatients | NO | YES |
|---|---|---|
| ALL | 4 | 279 |
| subtype1 | 2 | 77 |
| subtype2 | 1 | 83 |
| subtype3 | 1 | 59 |
| subtype4 | 0 | 60 |
Figure S34. Get High-res Image Clustering Approach #4: 'METHLYATION CNMF' versus Clinical Feature #9: 'NEOADJUVANT.THERAPY'
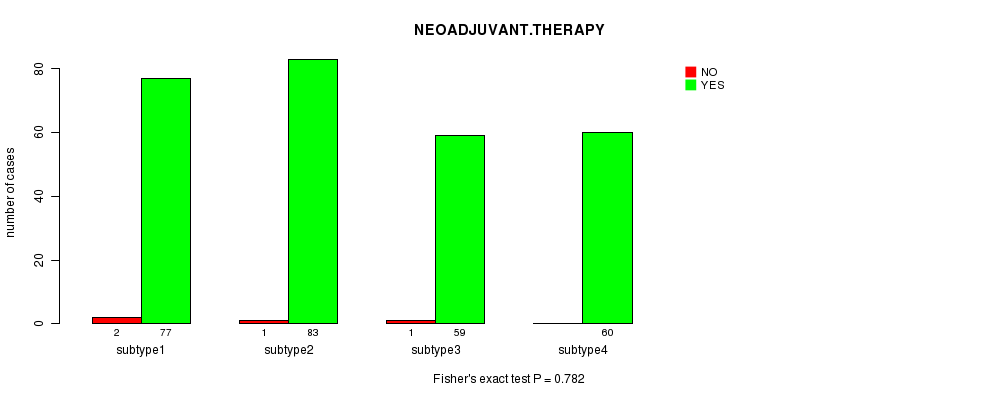
Table S39. Get Full Table Description of clustering approach #5: 'RPPA CNMF subtypes'
| Cluster Labels | 1 | 2 | 3 |
|---|---|---|---|
| Number of samples | 160 | 150 | 144 |
P value = 5.91e-08 (logrank test)
Table S40. Clustering Approach #5: 'RPPA CNMF subtypes' versus Clinical Feature #1: 'Time to Death'
| nPatients | nDeath | Duration Range (Median), Month | |
|---|---|---|---|
| ALL | 452 | 151 | 0.1 - 111.0 (34.3) |
| subtype1 | 158 | 75 | 0.2 - 97.5 (30.6) |
| subtype2 | 150 | 29 | 0.3 - 111.0 (38.3) |
| subtype3 | 144 | 47 | 0.1 - 96.8 (30.2) |
Figure S35. Get High-res Image Clustering Approach #5: 'RPPA CNMF subtypes' versus Clinical Feature #1: 'Time to Death'
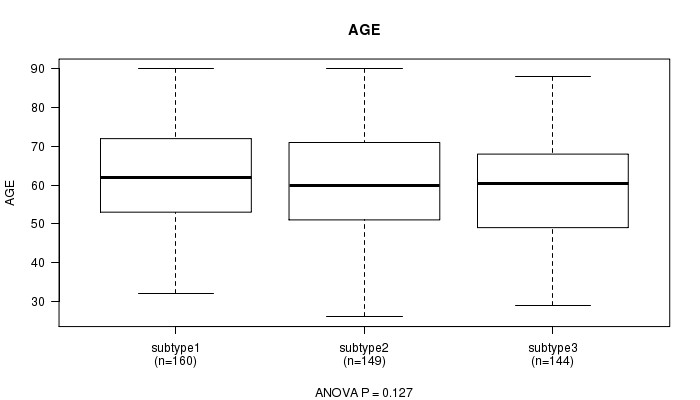
P value = 0.127 (ANOVA)
Table S41. Clustering Approach #5: 'RPPA CNMF subtypes' versus Clinical Feature #2: 'AGE'
| nPatients | Mean (Std.Dev) | |
|---|---|---|
| ALL | 453 | 60.4 (12.3) |
| subtype1 | 160 | 61.9 (12.1) |
| subtype2 | 149 | 60.2 (12.7) |
| subtype3 | 144 | 59.0 (12.0) |
Figure S36. Get High-res Image Clustering Approach #5: 'RPPA CNMF subtypes' versus Clinical Feature #2: 'AGE'
P value = 0.22 (Fisher's exact test)
Table S42. Clustering Approach #5: 'RPPA CNMF subtypes' versus Clinical Feature #3: 'GENDER'
| nPatients | FEMALE | MALE |
|---|---|---|
| ALL | 151 | 303 |
| subtype1 | 45 | 115 |
| subtype2 | 55 | 95 |
| subtype3 | 51 | 93 |
Figure S37. Get High-res Image Clustering Approach #5: 'RPPA CNMF subtypes' versus Clinical Feature #3: 'GENDER'
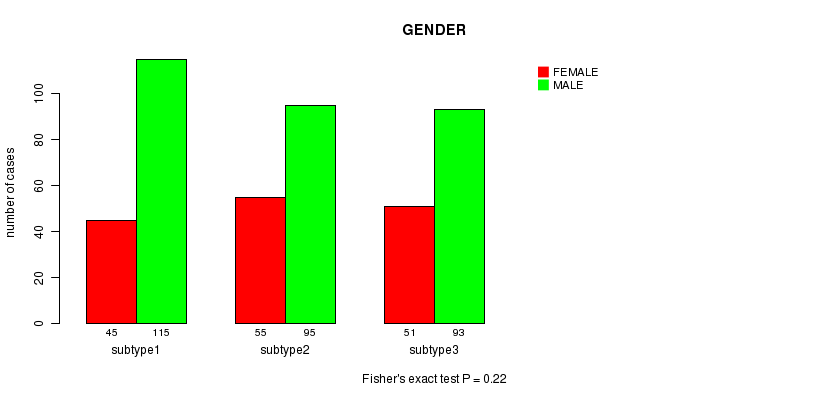
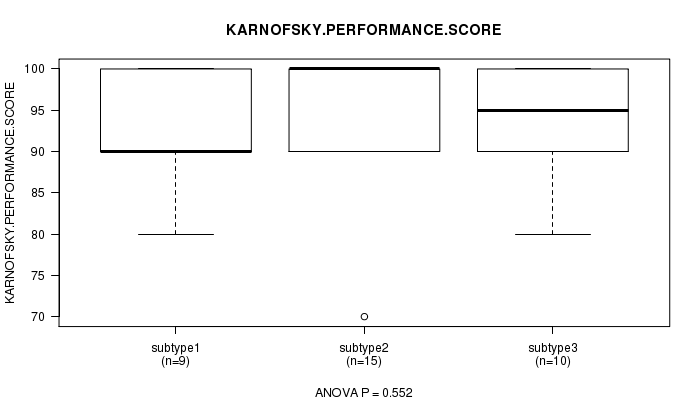
P value = 0.552 (ANOVA)
Table S43. Clustering Approach #5: 'RPPA CNMF subtypes' versus Clinical Feature #4: 'KARNOFSKY.PERFORMANCE.SCORE'
| nPatients | Mean (Std.Dev) | |
|---|---|---|
| ALL | 34 | 93.5 (7.7) |
| subtype1 | 9 | 91.1 (7.8) |
| subtype2 | 15 | 94.7 (8.3) |
| subtype3 | 10 | 94.0 (7.0) |
Figure S38. Get High-res Image Clustering Approach #5: 'RPPA CNMF subtypes' versus Clinical Feature #4: 'KARNOFSKY.PERFORMANCE.SCORE'
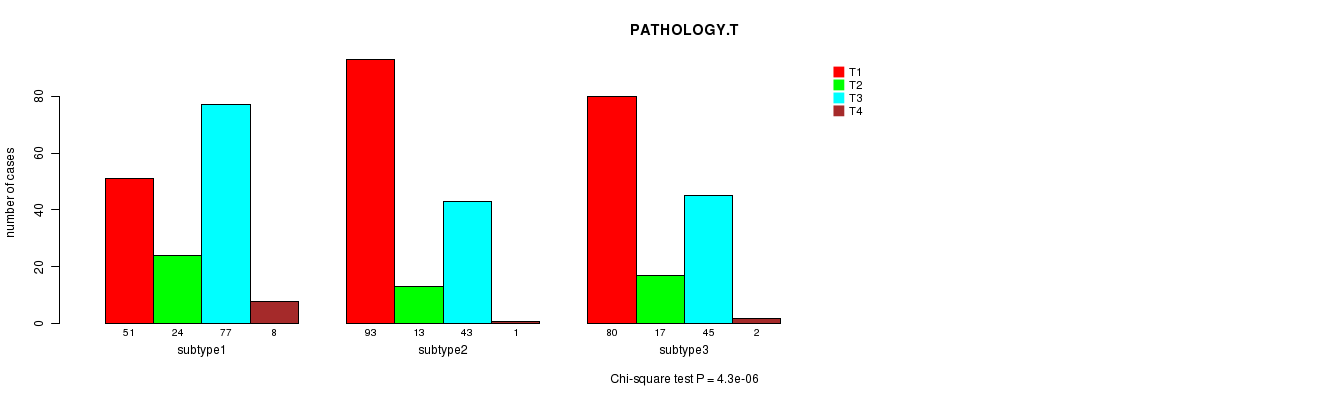
P value = 4.3e-06 (Chi-square test)
Table S44. Clustering Approach #5: 'RPPA CNMF subtypes' versus Clinical Feature #5: 'PATHOLOGY.T'
| nPatients | T1 | T2 | T3 | T4 |
|---|---|---|---|---|
| ALL | 224 | 54 | 165 | 11 |
| subtype1 | 51 | 24 | 77 | 8 |
| subtype2 | 93 | 13 | 43 | 1 |
| subtype3 | 80 | 17 | 45 | 2 |
Figure S39. Get High-res Image Clustering Approach #5: 'RPPA CNMF subtypes' versus Clinical Feature #5: 'PATHOLOGY.T'
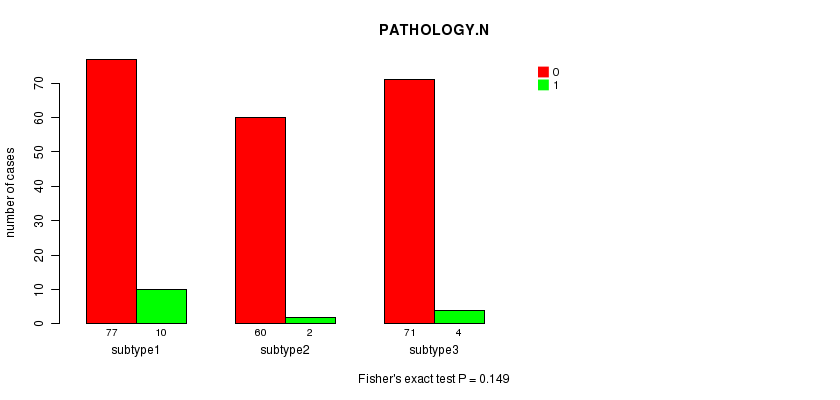
P value = 0.149 (Fisher's exact test)
Table S45. Clustering Approach #5: 'RPPA CNMF subtypes' versus Clinical Feature #6: 'PATHOLOGY.N'
| nPatients | 0 | 1 |
|---|---|---|
| ALL | 208 | 16 |
| subtype1 | 77 | 10 |
| subtype2 | 60 | 2 |
| subtype3 | 71 | 4 |
Figure S40. Get High-res Image Clustering Approach #5: 'RPPA CNMF subtypes' versus Clinical Feature #6: 'PATHOLOGY.N'
P value = 5.29e-06 (Fisher's exact test)
Table S46. Clustering Approach #5: 'RPPA CNMF subtypes' versus Clinical Feature #7: 'PATHOLOGICSPREAD(M)'
| nPatients | M0 | M1 |
|---|---|---|
| ALL | 380 | 74 |
| subtype1 | 116 | 44 |
| subtype2 | 139 | 11 |
| subtype3 | 125 | 19 |
Figure S41. Get High-res Image Clustering Approach #5: 'RPPA CNMF subtypes' versus Clinical Feature #7: 'PATHOLOGICSPREAD(M)'
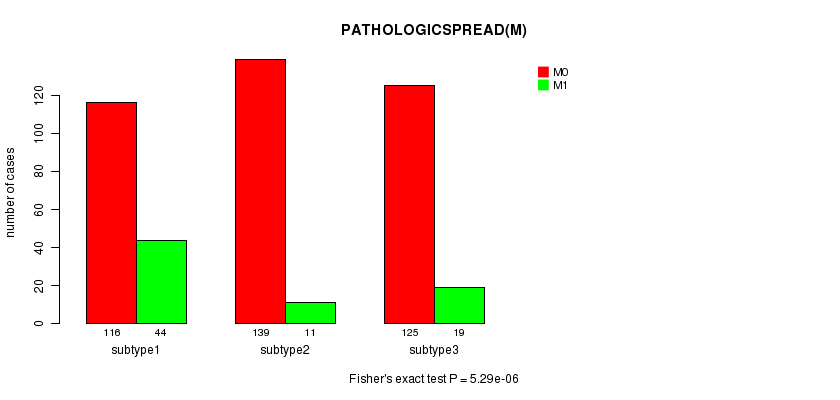
P value = 9.71e-08 (Chi-square test)
Table S47. Clustering Approach #5: 'RPPA CNMF subtypes' versus Clinical Feature #8: 'TUMOR.STAGE'
| nPatients | I | II | III | IV |
|---|---|---|---|---|
| ALL | 219 | 43 | 114 | 78 |
| subtype1 | 49 | 18 | 46 | 47 |
| subtype2 | 92 | 10 | 37 | 11 |
| subtype3 | 78 | 15 | 31 | 20 |
Figure S42. Get High-res Image Clustering Approach #5: 'RPPA CNMF subtypes' versus Clinical Feature #8: 'TUMOR.STAGE'
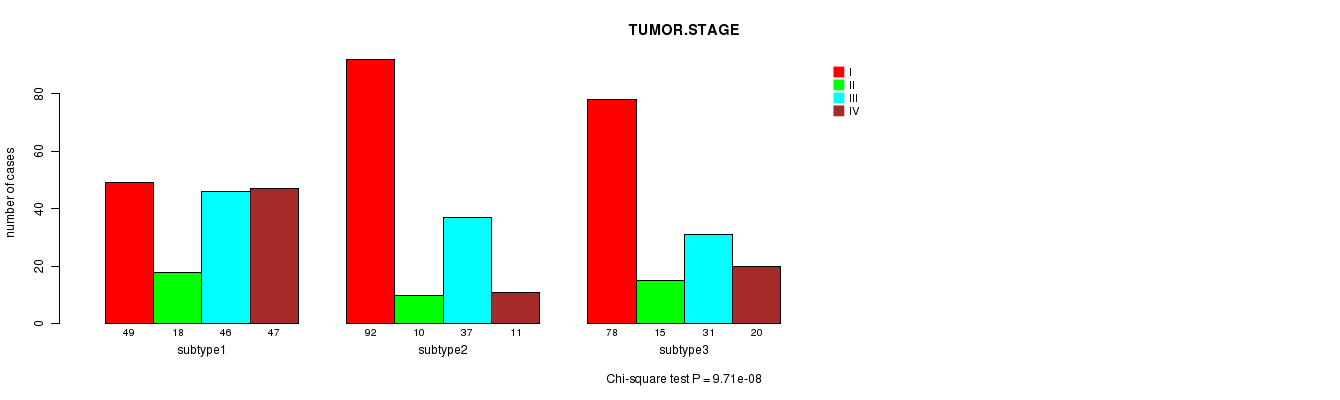
P value = 0.332 (Fisher's exact test)
Table S48. Clustering Approach #5: 'RPPA CNMF subtypes' versus Clinical Feature #9: 'NEOADJUVANT.THERAPY'
| nPatients | NO | YES |
|---|---|---|
| ALL | 4 | 450 |
| subtype1 | 3 | 157 |
| subtype2 | 1 | 149 |
| subtype3 | 0 | 144 |
Figure S43. Get High-res Image Clustering Approach #5: 'RPPA CNMF subtypes' versus Clinical Feature #9: 'NEOADJUVANT.THERAPY'
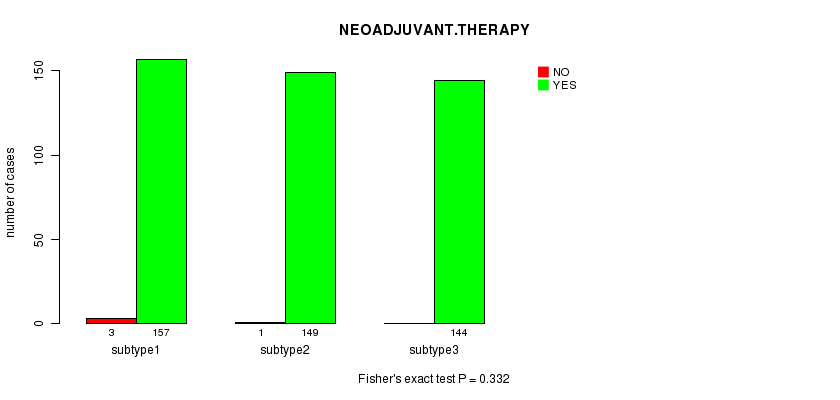
Table S49. Get Full Table Description of clustering approach #6: 'RPPA cHierClus subtypes'
| Cluster Labels | 1 | 2 | 3 |
|---|---|---|---|
| Number of samples | 132 | 215 | 107 |
P value = 1.06e-07 (logrank test)
Table S50. Clustering Approach #6: 'RPPA cHierClus subtypes' versus Clinical Feature #1: 'Time to Death'
| nPatients | nDeath | Duration Range (Median), Month | |
|---|---|---|---|
| ALL | 452 | 151 | 0.1 - 111.0 (34.3) |
| subtype1 | 132 | 43 | 0.2 - 111.0 (36.6) |
| subtype2 | 215 | 53 | 0.1 - 96.8 (37.0) |
| subtype3 | 105 | 55 | 0.1 - 91.4 (21.2) |
Figure S44. Get High-res Image Clustering Approach #6: 'RPPA cHierClus subtypes' versus Clinical Feature #1: 'Time to Death'
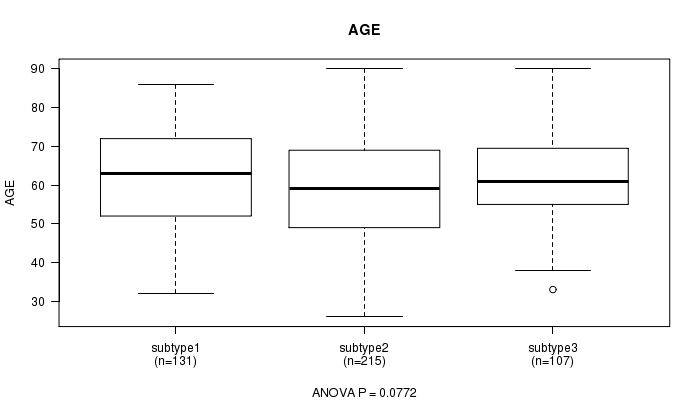
P value = 0.0772 (ANOVA)
Table S51. Clustering Approach #6: 'RPPA cHierClus subtypes' versus Clinical Feature #2: 'AGE'
| nPatients | Mean (Std.Dev) | |
|---|---|---|
| ALL | 453 | 60.4 (12.3) |
| subtype1 | 131 | 61.9 (12.0) |
| subtype2 | 215 | 59.1 (12.9) |
| subtype3 | 107 | 61.4 (11.3) |
Figure S45. Get High-res Image Clustering Approach #6: 'RPPA cHierClus subtypes' versus Clinical Feature #2: 'AGE'
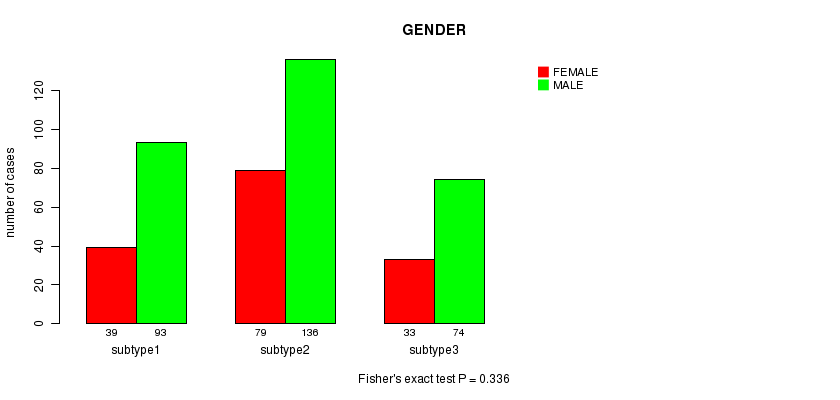
P value = 0.336 (Fisher's exact test)
Table S52. Clustering Approach #6: 'RPPA cHierClus subtypes' versus Clinical Feature #3: 'GENDER'
| nPatients | FEMALE | MALE |
|---|---|---|
| ALL | 151 | 303 |
| subtype1 | 39 | 93 |
| subtype2 | 79 | 136 |
| subtype3 | 33 | 74 |
Figure S46. Get High-res Image Clustering Approach #6: 'RPPA cHierClus subtypes' versus Clinical Feature #3: 'GENDER'
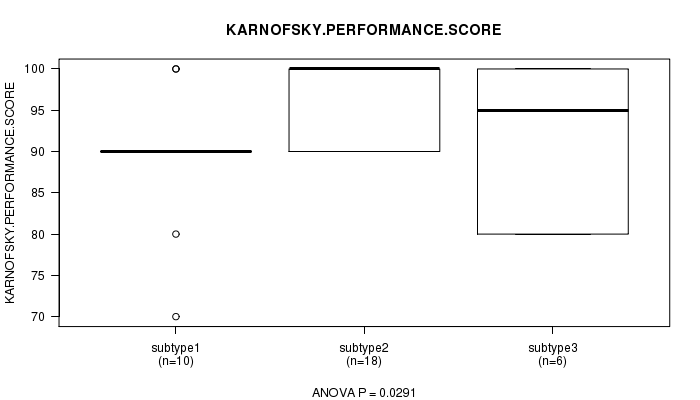
P value = 0.0291 (ANOVA)
Table S53. Clustering Approach #6: 'RPPA cHierClus subtypes' versus Clinical Feature #4: 'KARNOFSKY.PERFORMANCE.SCORE'
| nPatients | Mean (Std.Dev) | |
|---|---|---|
| ALL | 34 | 93.5 (7.7) |
| subtype1 | 10 | 89.0 (8.8) |
| subtype2 | 18 | 96.7 (4.9) |
| subtype3 | 6 | 91.7 (9.8) |
Figure S47. Get High-res Image Clustering Approach #6: 'RPPA cHierClus subtypes' versus Clinical Feature #4: 'KARNOFSKY.PERFORMANCE.SCORE'
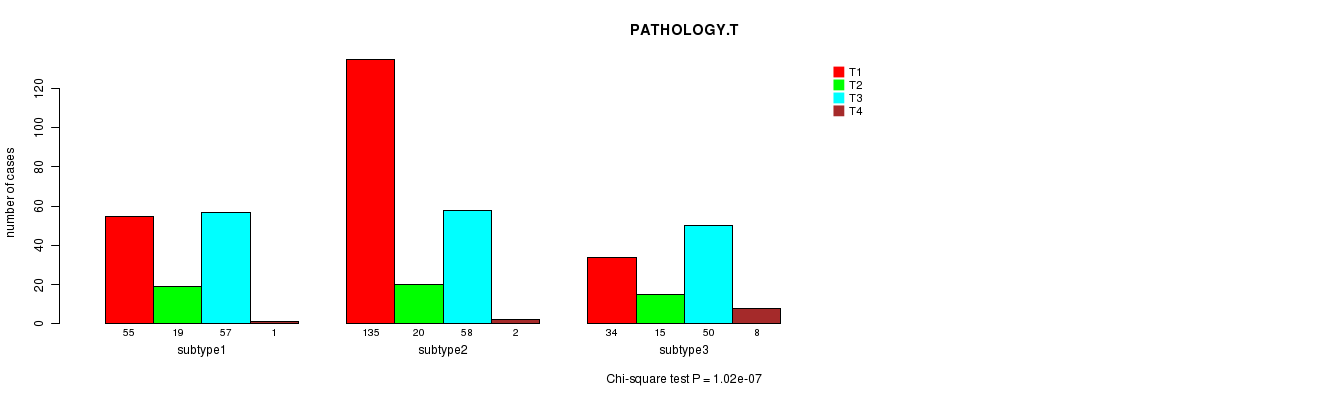
P value = 1.02e-07 (Chi-square test)
Table S54. Clustering Approach #6: 'RPPA cHierClus subtypes' versus Clinical Feature #5: 'PATHOLOGY.T'
| nPatients | T1 | T2 | T3 | T4 |
|---|---|---|---|---|
| ALL | 224 | 54 | 165 | 11 |
| subtype1 | 55 | 19 | 57 | 1 |
| subtype2 | 135 | 20 | 58 | 2 |
| subtype3 | 34 | 15 | 50 | 8 |
Figure S48. Get High-res Image Clustering Approach #6: 'RPPA cHierClus subtypes' versus Clinical Feature #5: 'PATHOLOGY.T'
P value = 0.252 (Fisher's exact test)
Table S55. Clustering Approach #6: 'RPPA cHierClus subtypes' versus Clinical Feature #6: 'PATHOLOGY.N'
| nPatients | 0 | 1 |
|---|---|---|
| ALL | 208 | 16 |
| subtype1 | 66 | 4 |
| subtype2 | 82 | 4 |
| subtype3 | 60 | 8 |
Figure S49. Get High-res Image Clustering Approach #6: 'RPPA cHierClus subtypes' versus Clinical Feature #6: 'PATHOLOGY.N'
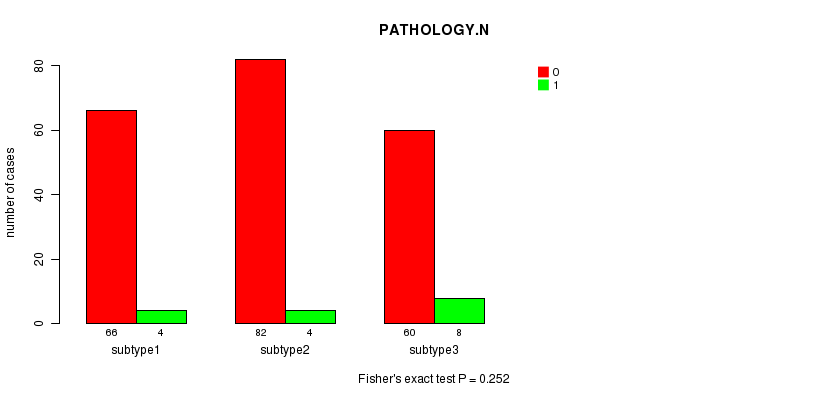
P value = 0.000361 (Fisher's exact test)
Table S56. Clustering Approach #6: 'RPPA cHierClus subtypes' versus Clinical Feature #7: 'PATHOLOGICSPREAD(M)'
| nPatients | M0 | M1 |
|---|---|---|
| ALL | 380 | 74 |
| subtype1 | 113 | 19 |
| subtype2 | 191 | 24 |
| subtype3 | 76 | 31 |
Figure S50. Get High-res Image Clustering Approach #6: 'RPPA cHierClus subtypes' versus Clinical Feature #7: 'PATHOLOGICSPREAD(M)'
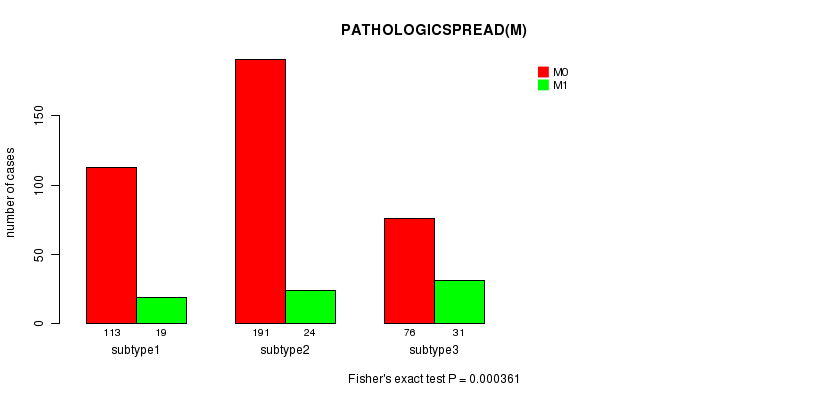
P value = 1.59e-07 (Chi-square test)
Table S57. Clustering Approach #6: 'RPPA cHierClus subtypes' versus Clinical Feature #8: 'TUMOR.STAGE'
| nPatients | I | II | III | IV |
|---|---|---|---|---|
| ALL | 219 | 43 | 114 | 78 |
| subtype1 | 53 | 15 | 43 | 21 |
| subtype2 | 133 | 17 | 42 | 23 |
| subtype3 | 33 | 11 | 29 | 34 |
Figure S51. Get High-res Image Clustering Approach #6: 'RPPA cHierClus subtypes' versus Clinical Feature #8: 'TUMOR.STAGE'
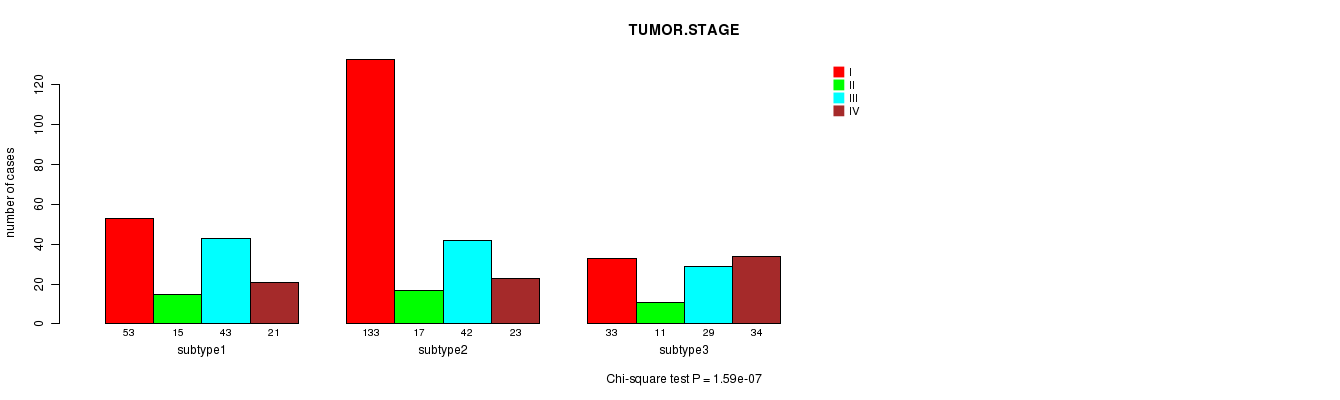
P value = 0.1 (Fisher's exact test)
Table S58. Clustering Approach #6: 'RPPA cHierClus subtypes' versus Clinical Feature #9: 'NEOADJUVANT.THERAPY'
| nPatients | NO | YES |
|---|---|---|
| ALL | 4 | 450 |
| subtype1 | 2 | 130 |
| subtype2 | 0 | 215 |
| subtype3 | 2 | 105 |
Figure S52. Get High-res Image Clustering Approach #6: 'RPPA cHierClus subtypes' versus Clinical Feature #9: 'NEOADJUVANT.THERAPY'
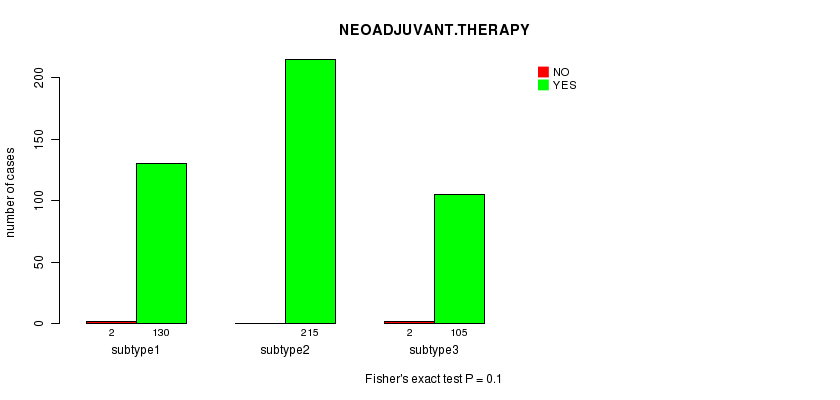
Table S59. Get Full Table Description of clustering approach #7: 'RNAseq CNMF subtypes'
| Cluster Labels | 1 | 2 | 3 |
|---|---|---|---|
| Number of samples | 198 | 100 | 171 |
P value = 2.59e-07 (logrank test)
Table S60. Clustering Approach #7: 'RNAseq CNMF subtypes' versus Clinical Feature #1: 'Time to Death'
| nPatients | nDeath | Duration Range (Median), Month | |
|---|---|---|---|
| ALL | 467 | 154 | 0.1 - 111.0 (34.3) |
| subtype1 | 198 | 45 | 0.1 - 111.0 (37.9) |
| subtype2 | 99 | 29 | 0.1 - 93.3 (31.3) |
| subtype3 | 170 | 80 | 0.1 - 90.3 (29.8) |
Figure S53. Get High-res Image Clustering Approach #7: 'RNAseq CNMF subtypes' versus Clinical Feature #1: 'Time to Death'
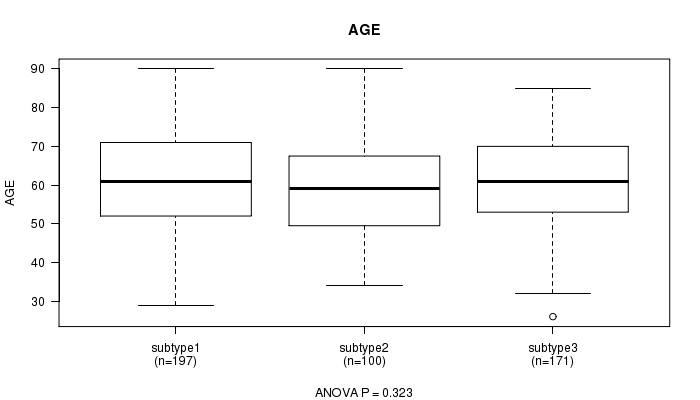
P value = 0.323 (ANOVA)
Table S61. Clustering Approach #7: 'RNAseq CNMF subtypes' versus Clinical Feature #2: 'AGE'
| nPatients | Mean (Std.Dev) | |
|---|---|---|
| ALL | 468 | 60.6 (12.2) |
| subtype1 | 197 | 61.3 (12.2) |
| subtype2 | 100 | 59.1 (12.5) |
| subtype3 | 171 | 60.7 (12.0) |
Figure S54. Get High-res Image Clustering Approach #7: 'RNAseq CNMF subtypes' versus Clinical Feature #2: 'AGE'
P value = 1.17e-05 (Fisher's exact test)
Table S62. Clustering Approach #7: 'RNAseq CNMF subtypes' versus Clinical Feature #3: 'GENDER'
| nPatients | FEMALE | MALE |
|---|---|---|
| ALL | 162 | 307 |
| subtype1 | 92 | 106 |
| subtype2 | 30 | 70 |
| subtype3 | 40 | 131 |
Figure S55. Get High-res Image Clustering Approach #7: 'RNAseq CNMF subtypes' versus Clinical Feature #3: 'GENDER'
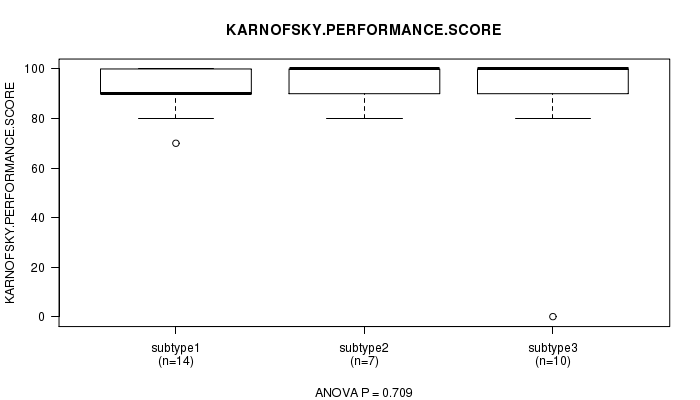
P value = 0.709 (ANOVA)
Table S63. Clustering Approach #7: 'RNAseq CNMF subtypes' versus Clinical Feature #4: 'KARNOFSKY.PERFORMANCE.SCORE'
| nPatients | Mean (Std.Dev) | |
|---|---|---|
| ALL | 31 | 91.0 (18.7) |
| subtype1 | 14 | 92.1 (8.9) |
| subtype2 | 7 | 94.3 (7.9) |
| subtype3 | 10 | 87.0 (31.3) |
Figure S56. Get High-res Image Clustering Approach #7: 'RNAseq CNMF subtypes' versus Clinical Feature #4: 'KARNOFSKY.PERFORMANCE.SCORE'
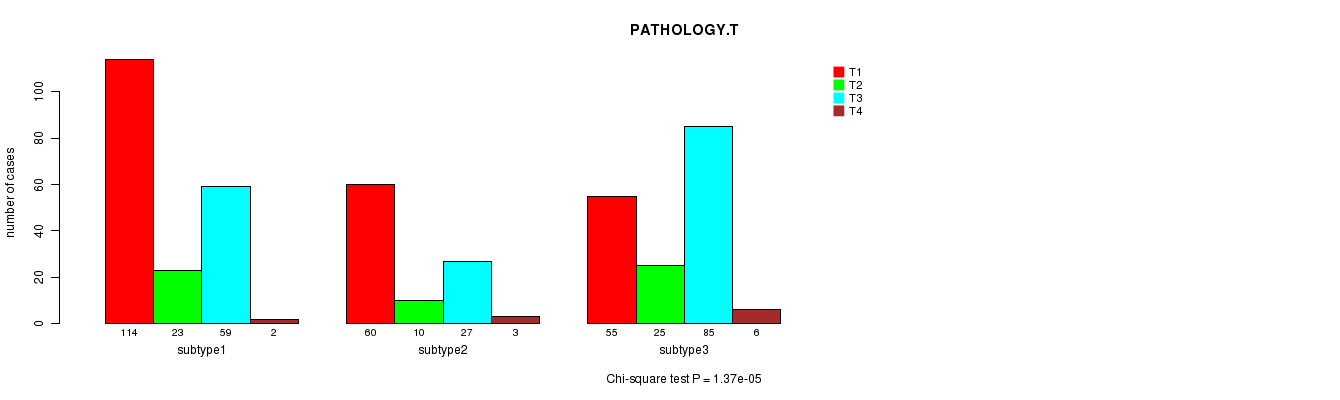
P value = 1.37e-05 (Chi-square test)
Table S64. Clustering Approach #7: 'RNAseq CNMF subtypes' versus Clinical Feature #5: 'PATHOLOGY.T'
| nPatients | T1 | T2 | T3 | T4 |
|---|---|---|---|---|
| ALL | 229 | 58 | 171 | 11 |
| subtype1 | 114 | 23 | 59 | 2 |
| subtype2 | 60 | 10 | 27 | 3 |
| subtype3 | 55 | 25 | 85 | 6 |
Figure S57. Get High-res Image Clustering Approach #7: 'RNAseq CNMF subtypes' versus Clinical Feature #5: 'PATHOLOGY.T'
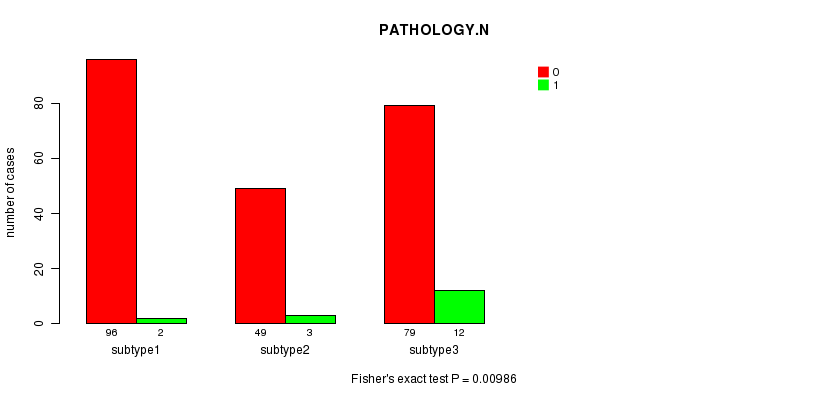
P value = 0.00986 (Fisher's exact test)
Table S65. Clustering Approach #7: 'RNAseq CNMF subtypes' versus Clinical Feature #6: 'PATHOLOGY.N'
| nPatients | 0 | 1 |
|---|---|---|
| ALL | 224 | 17 |
| subtype1 | 96 | 2 |
| subtype2 | 49 | 3 |
| subtype3 | 79 | 12 |
Figure S58. Get High-res Image Clustering Approach #7: 'RNAseq CNMF subtypes' versus Clinical Feature #6: 'PATHOLOGY.N'
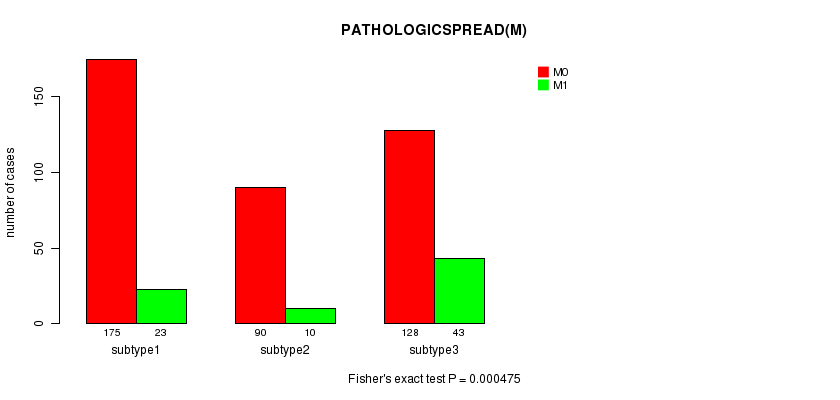
P value = 0.000475 (Fisher's exact test)
Table S66. Clustering Approach #7: 'RNAseq CNMF subtypes' versus Clinical Feature #7: 'PATHOLOGICSPREAD(M)'
| nPatients | M0 | M1 |
|---|---|---|
| ALL | 393 | 76 |
| subtype1 | 175 | 23 |
| subtype2 | 90 | 10 |
| subtype3 | 128 | 43 |
Figure S59. Get High-res Image Clustering Approach #7: 'RNAseq CNMF subtypes' versus Clinical Feature #7: 'PATHOLOGICSPREAD(M)'
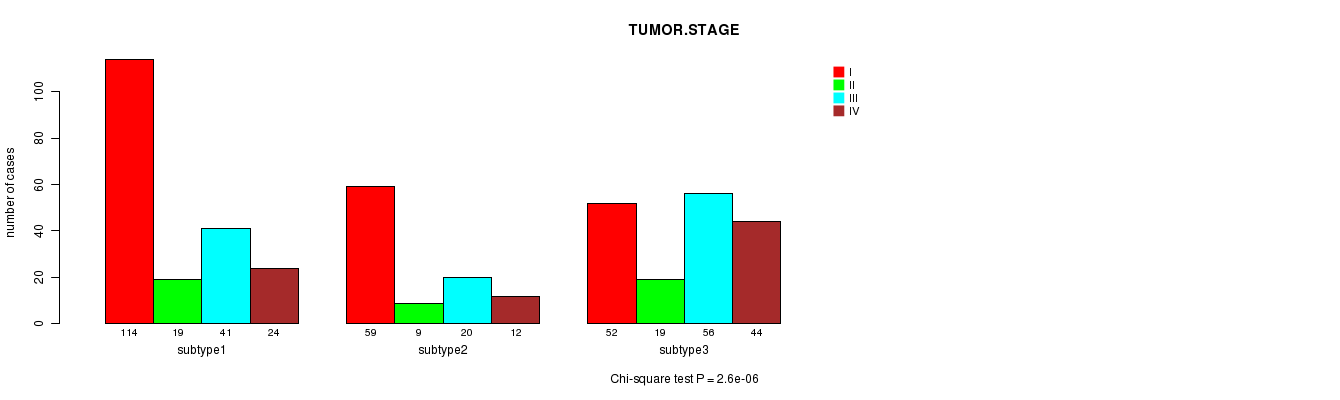
P value = 2.6e-06 (Chi-square test)
Table S67. Clustering Approach #7: 'RNAseq CNMF subtypes' versus Clinical Feature #8: 'TUMOR.STAGE'
| nPatients | I | II | III | IV |
|---|---|---|---|---|
| ALL | 225 | 47 | 117 | 80 |
| subtype1 | 114 | 19 | 41 | 24 |
| subtype2 | 59 | 9 | 20 | 12 |
| subtype3 | 52 | 19 | 56 | 44 |
Figure S60. Get High-res Image Clustering Approach #7: 'RNAseq CNMF subtypes' versus Clinical Feature #8: 'TUMOR.STAGE'
P value = 1 (Fisher's exact test)
Table S68. Clustering Approach #7: 'RNAseq CNMF subtypes' versus Clinical Feature #9: 'NEOADJUVANT.THERAPY'
| nPatients | NO | YES |
|---|---|---|
| ALL | 5 | 464 |
| subtype1 | 2 | 196 |
| subtype2 | 1 | 99 |
| subtype3 | 2 | 169 |
Figure S61. Get High-res Image Clustering Approach #7: 'RNAseq CNMF subtypes' versus Clinical Feature #9: 'NEOADJUVANT.THERAPY'
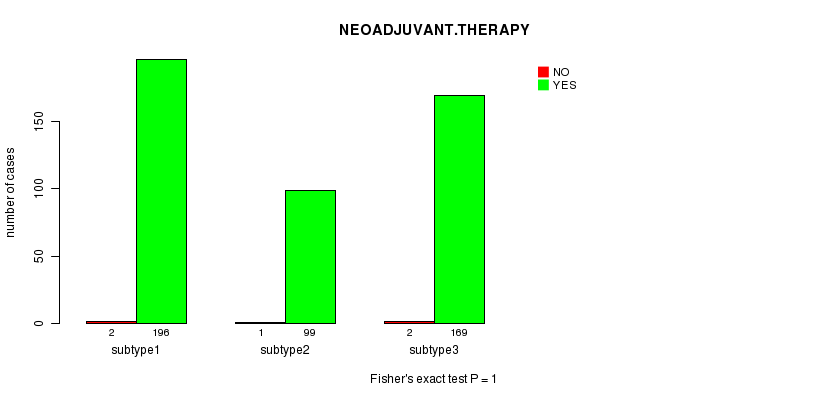
Table S69. Get Full Table Description of clustering approach #8: 'RNAseq cHierClus subtypes'
| Cluster Labels | 1 | 2 | 3 |
|---|---|---|---|
| Number of samples | 52 | 221 | 196 |
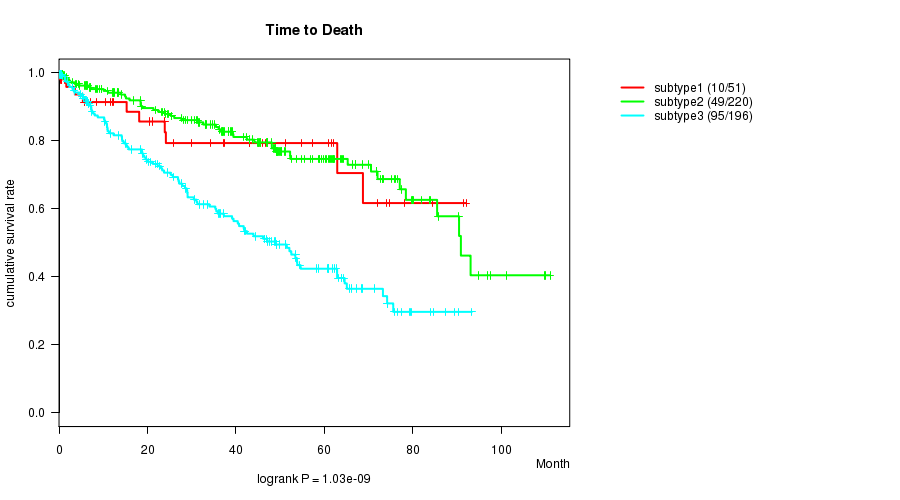
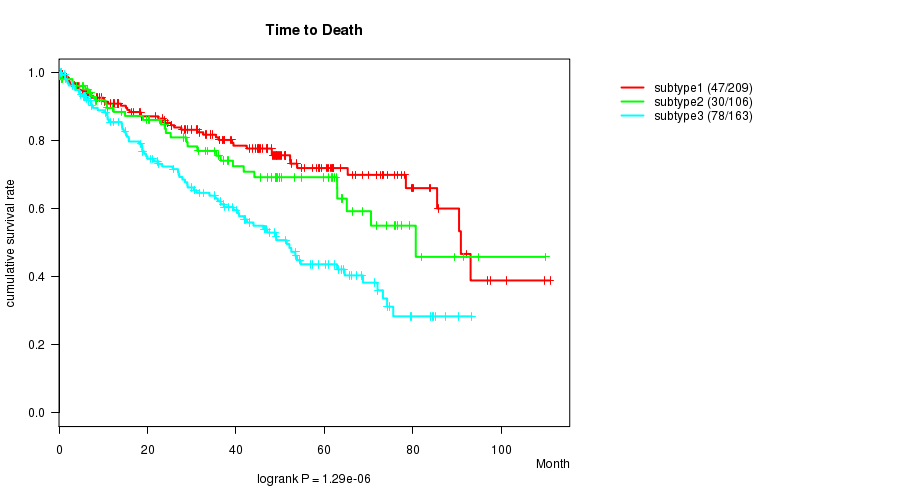
P value = 1.03e-09 (logrank test)
Table S70. Clustering Approach #8: 'RNAseq cHierClus subtypes' versus Clinical Feature #1: 'Time to Death'
| nPatients | nDeath | Duration Range (Median), Month | |
|---|---|---|---|
| ALL | 467 | 154 | 0.1 - 111.0 (34.3) |
| subtype1 | 51 | 10 | 0.2 - 92.0 (24.2) |
| subtype2 | 220 | 49 | 0.1 - 111.0 (38.5) |
| subtype3 | 196 | 95 | 0.1 - 93.3 (28.9) |
Figure S62. Get High-res Image Clustering Approach #8: 'RNAseq cHierClus subtypes' versus Clinical Feature #1: 'Time to Death'
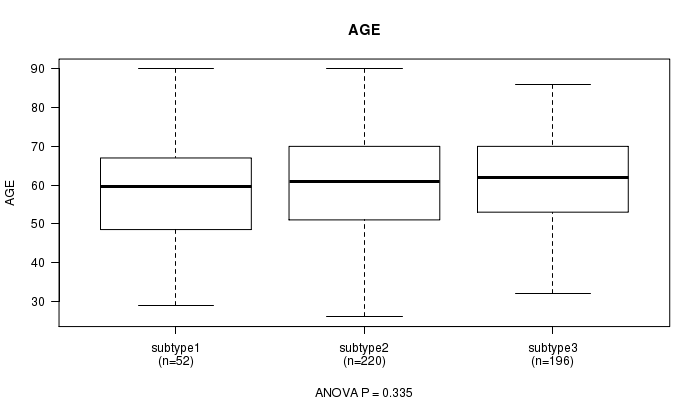
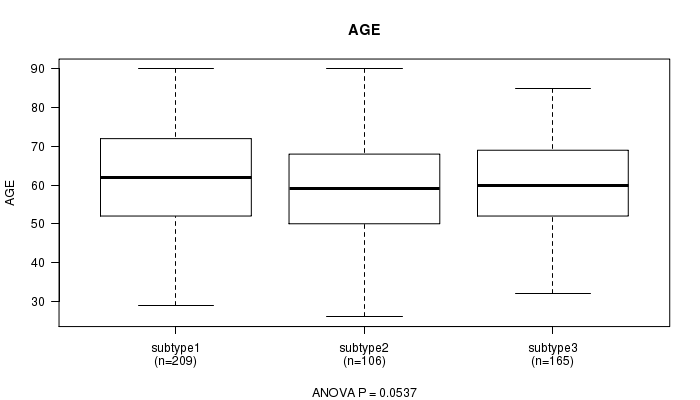
P value = 0.335 (ANOVA)
Table S71. Clustering Approach #8: 'RNAseq cHierClus subtypes' versus Clinical Feature #2: 'AGE'
| nPatients | Mean (Std.Dev) | |
|---|---|---|
| ALL | 468 | 60.6 (12.2) |
| subtype1 | 52 | 58.5 (12.9) |
| subtype2 | 220 | 60.5 (12.4) |
| subtype3 | 196 | 61.3 (11.7) |
Figure S63. Get High-res Image Clustering Approach #8: 'RNAseq cHierClus subtypes' versus Clinical Feature #2: 'AGE'
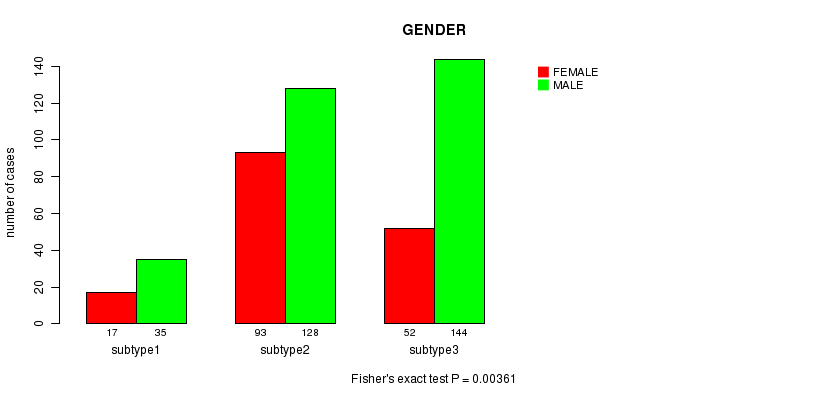
P value = 0.00361 (Fisher's exact test)
Table S72. Clustering Approach #8: 'RNAseq cHierClus subtypes' versus Clinical Feature #3: 'GENDER'
| nPatients | FEMALE | MALE |
|---|---|---|
| ALL | 162 | 307 |
| subtype1 | 17 | 35 |
| subtype2 | 93 | 128 |
| subtype3 | 52 | 144 |
Figure S64. Get High-res Image Clustering Approach #8: 'RNAseq cHierClus subtypes' versus Clinical Feature #3: 'GENDER'
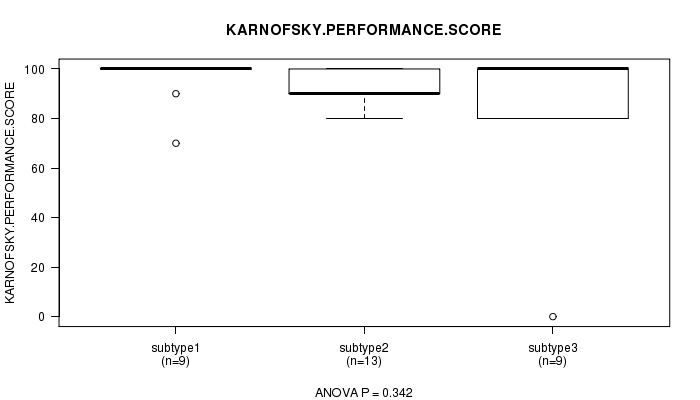
P value = 0.342 (ANOVA)
Table S73. Clustering Approach #8: 'RNAseq cHierClus subtypes' versus Clinical Feature #4: 'KARNOFSKY.PERFORMANCE.SCORE'
| nPatients | Mean (Std.Dev) | |
|---|---|---|
| ALL | 31 | 91.0 (18.7) |
| subtype1 | 9 | 95.6 (10.1) |
| subtype2 | 13 | 93.1 (6.3) |
| subtype3 | 9 | 83.3 (32.4) |
Figure S65. Get High-res Image Clustering Approach #8: 'RNAseq cHierClus subtypes' versus Clinical Feature #4: 'KARNOFSKY.PERFORMANCE.SCORE'
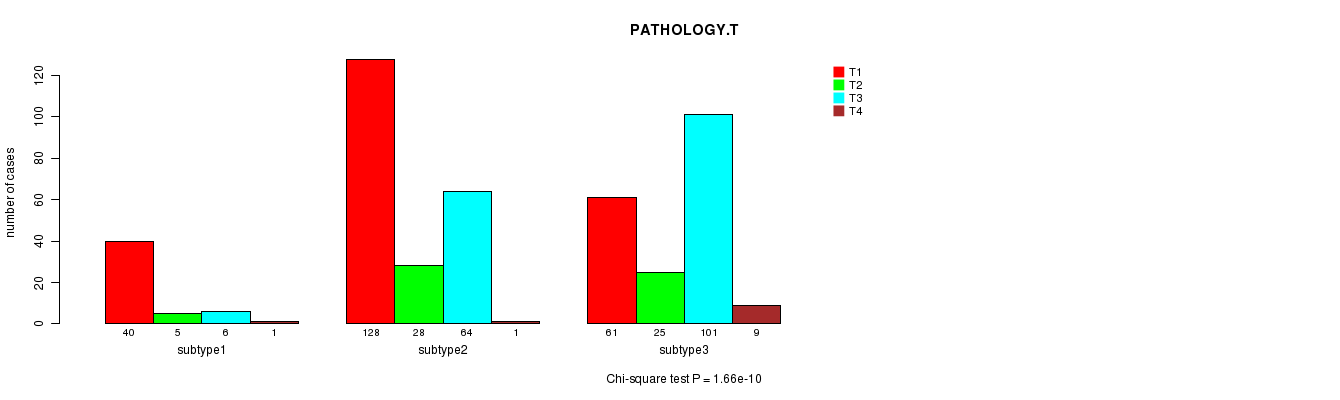
P value = 1.66e-10 (Chi-square test)
Table S74. Clustering Approach #8: 'RNAseq cHierClus subtypes' versus Clinical Feature #5: 'PATHOLOGY.T'
| nPatients | T1 | T2 | T3 | T4 |
|---|---|---|---|---|
| ALL | 229 | 58 | 171 | 11 |
| subtype1 | 40 | 5 | 6 | 1 |
| subtype2 | 128 | 28 | 64 | 1 |
| subtype3 | 61 | 25 | 101 | 9 |
Figure S66. Get High-res Image Clustering Approach #8: 'RNAseq cHierClus subtypes' versus Clinical Feature #5: 'PATHOLOGY.T'
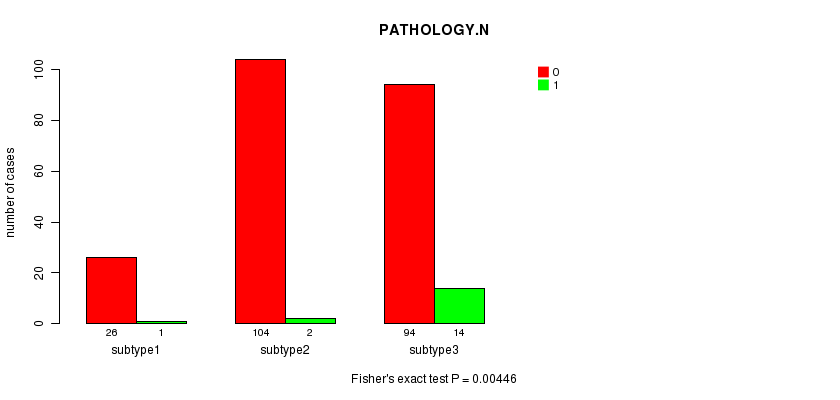
P value = 0.00446 (Fisher's exact test)
Table S75. Clustering Approach #8: 'RNAseq cHierClus subtypes' versus Clinical Feature #6: 'PATHOLOGY.N'
| nPatients | 0 | 1 |
|---|---|---|
| ALL | 224 | 17 |
| subtype1 | 26 | 1 |
| subtype2 | 104 | 2 |
| subtype3 | 94 | 14 |
Figure S67. Get High-res Image Clustering Approach #8: 'RNAseq cHierClus subtypes' versus Clinical Feature #6: 'PATHOLOGY.N'
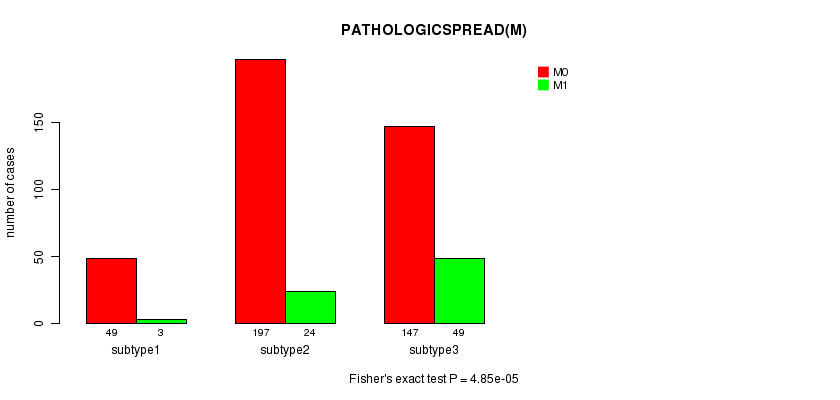
P value = 4.85e-05 (Fisher's exact test)
Table S76. Clustering Approach #8: 'RNAseq cHierClus subtypes' versus Clinical Feature #7: 'PATHOLOGICSPREAD(M)'
| nPatients | M0 | M1 |
|---|---|---|
| ALL | 393 | 76 |
| subtype1 | 49 | 3 |
| subtype2 | 197 | 24 |
| subtype3 | 147 | 49 |
Figure S68. Get High-res Image Clustering Approach #8: 'RNAseq cHierClus subtypes' versus Clinical Feature #7: 'PATHOLOGICSPREAD(M)'
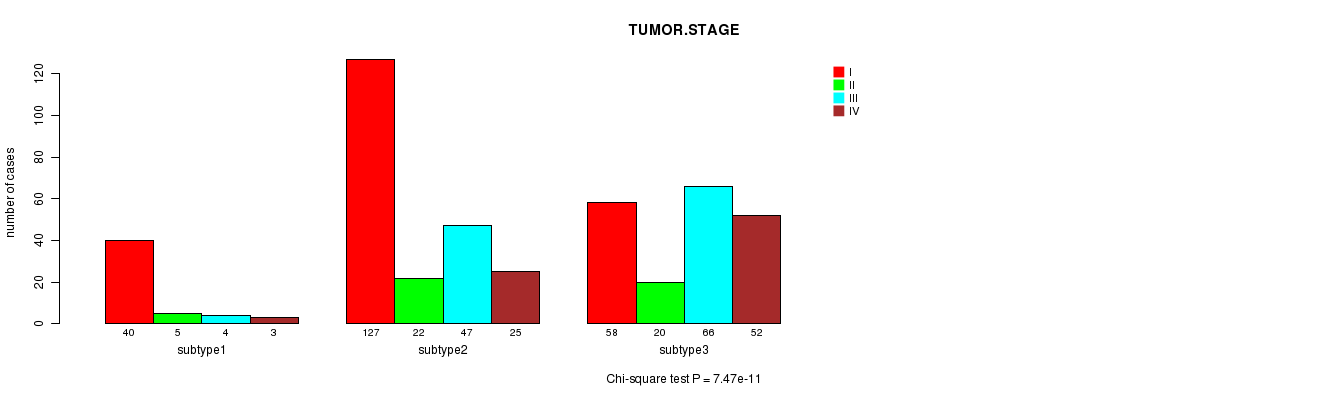
P value = 7.47e-11 (Chi-square test)
Table S77. Clustering Approach #8: 'RNAseq cHierClus subtypes' versus Clinical Feature #8: 'TUMOR.STAGE'
| nPatients | I | II | III | IV |
|---|---|---|---|---|
| ALL | 225 | 47 | 117 | 80 |
| subtype1 | 40 | 5 | 4 | 3 |
| subtype2 | 127 | 22 | 47 | 25 |
| subtype3 | 58 | 20 | 66 | 52 |
Figure S69. Get High-res Image Clustering Approach #8: 'RNAseq cHierClus subtypes' versus Clinical Feature #8: 'TUMOR.STAGE'
P value = 0.654 (Fisher's exact test)
Table S78. Clustering Approach #8: 'RNAseq cHierClus subtypes' versus Clinical Feature #9: 'NEOADJUVANT.THERAPY'
| nPatients | NO | YES |
|---|---|---|
| ALL | 5 | 464 |
| subtype1 | 1 | 51 |
| subtype2 | 2 | 219 |
| subtype3 | 2 | 194 |
Figure S70. Get High-res Image Clustering Approach #8: 'RNAseq cHierClus subtypes' versus Clinical Feature #9: 'NEOADJUVANT.THERAPY'
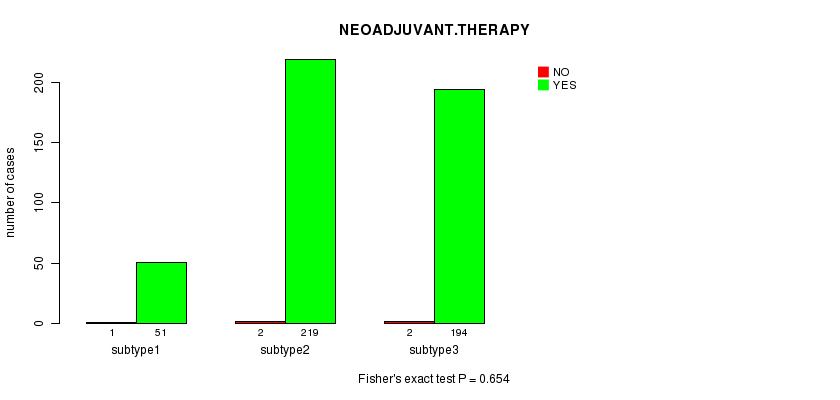
Table S79. Get Full Table Description of clustering approach #9: 'MIRseq CNMF subtypes'
| Cluster Labels | 1 | 2 | 3 |
|---|---|---|---|
| Number of samples | 209 | 106 | 165 |
P value = 1.29e-06 (logrank test)
Table S80. Clustering Approach #9: 'MIRseq CNMF subtypes' versus Clinical Feature #1: 'Time to Death'
| nPatients | nDeath | Duration Range (Median), Month | |
|---|---|---|---|
| ALL | 478 | 155 | 0.1 - 111.0 (35.2) |
| subtype1 | 209 | 47 | 0.1 - 111.0 (36.2) |
| subtype2 | 106 | 30 | 0.1 - 109.9 (35.8) |
| subtype3 | 163 | 78 | 0.2 - 93.3 (31.1) |
Figure S71. Get High-res Image Clustering Approach #9: 'MIRseq CNMF subtypes' versus Clinical Feature #1: 'Time to Death'
P value = 0.0537 (ANOVA)
Table S81. Clustering Approach #9: 'MIRseq CNMF subtypes' versus Clinical Feature #2: 'AGE'
| nPatients | Mean (Std.Dev) | |
|---|---|---|
| ALL | 480 | 60.6 (12.2) |
| subtype1 | 209 | 62.0 (12.2) |
| subtype2 | 106 | 58.7 (12.7) |
| subtype3 | 165 | 59.9 (11.7) |
Figure S72. Get High-res Image Clustering Approach #9: 'MIRseq CNMF subtypes' versus Clinical Feature #2: 'AGE'
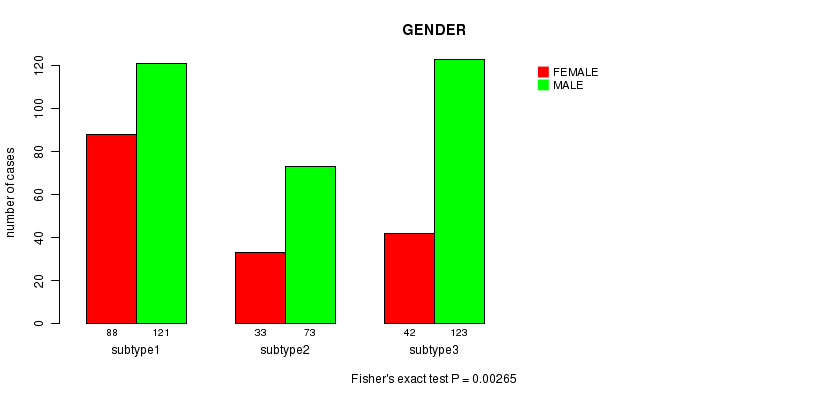
P value = 0.00265 (Fisher's exact test)
Table S82. Clustering Approach #9: 'MIRseq CNMF subtypes' versus Clinical Feature #3: 'GENDER'
| nPatients | FEMALE | MALE |
|---|---|---|
| ALL | 163 | 317 |
| subtype1 | 88 | 121 |
| subtype2 | 33 | 73 |
| subtype3 | 42 | 123 |
Figure S73. Get High-res Image Clustering Approach #9: 'MIRseq CNMF subtypes' versus Clinical Feature #3: 'GENDER'
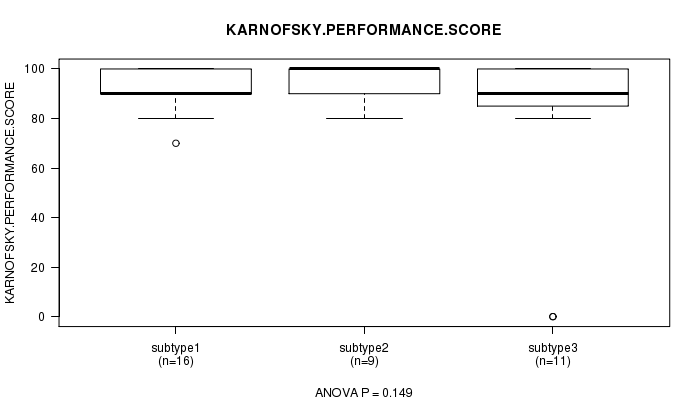
P value = 0.149 (ANOVA)
Table S83. Clustering Approach #9: 'MIRseq CNMF subtypes' versus Clinical Feature #4: 'KARNOFSKY.PERFORMANCE.SCORE'
| nPatients | Mean (Std.Dev) | |
|---|---|---|
| ALL | 36 | 88.3 (23.0) |
| subtype1 | 16 | 91.9 (8.3) |
| subtype2 | 9 | 95.6 (7.3) |
| subtype3 | 11 | 77.3 (38.8) |
Figure S74. Get High-res Image Clustering Approach #9: 'MIRseq CNMF subtypes' versus Clinical Feature #4: 'KARNOFSKY.PERFORMANCE.SCORE'
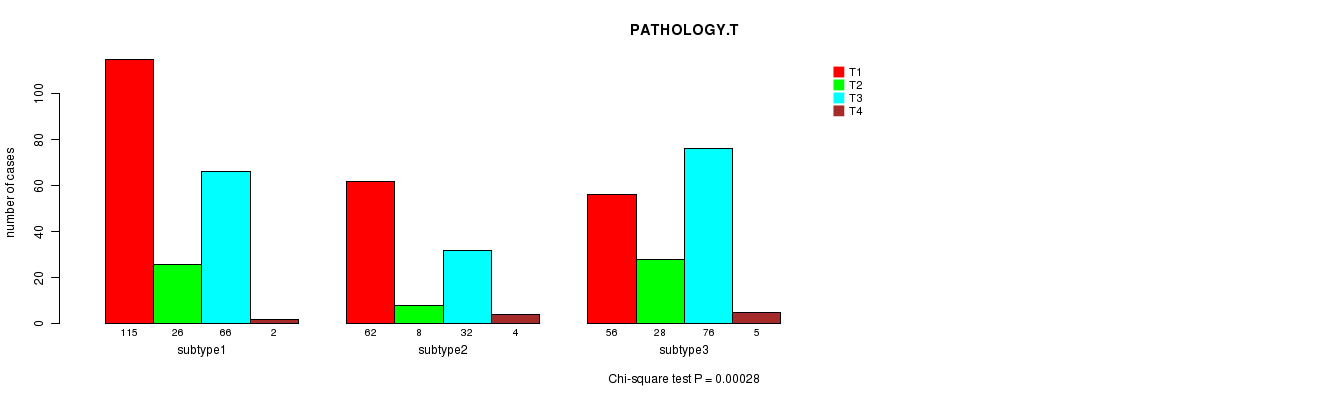
P value = 0.00028 (Chi-square test)
Table S84. Clustering Approach #9: 'MIRseq CNMF subtypes' versus Clinical Feature #5: 'PATHOLOGY.T'
| nPatients | T1 | T2 | T3 | T4 |
|---|---|---|---|---|
| ALL | 233 | 62 | 174 | 11 |
| subtype1 | 115 | 26 | 66 | 2 |
| subtype2 | 62 | 8 | 32 | 4 |
| subtype3 | 56 | 28 | 76 | 5 |
Figure S75. Get High-res Image Clustering Approach #9: 'MIRseq CNMF subtypes' versus Clinical Feature #5: 'PATHOLOGY.T'
P value = 0.00693 (Fisher's exact test)
Table S85. Clustering Approach #9: 'MIRseq CNMF subtypes' versus Clinical Feature #6: 'PATHOLOGY.N'
| nPatients | 0 | 1 |
|---|---|---|
| ALL | 222 | 17 |
| subtype1 | 95 | 2 |
| subtype2 | 51 | 3 |
| subtype3 | 76 | 12 |
Figure S76. Get High-res Image Clustering Approach #9: 'MIRseq CNMF subtypes' versus Clinical Feature #6: 'PATHOLOGY.N'

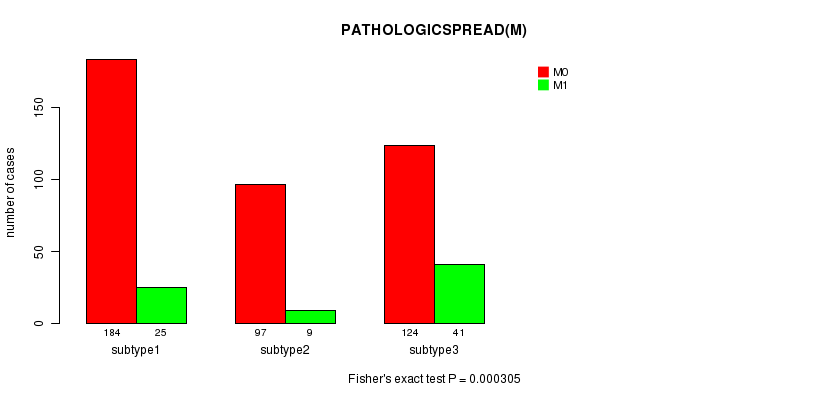
P value = 0.000305 (Fisher's exact test)
Table S86. Clustering Approach #9: 'MIRseq CNMF subtypes' versus Clinical Feature #7: 'PATHOLOGICSPREAD(M)'
| nPatients | M0 | M1 |
|---|---|---|
| ALL | 405 | 75 |
| subtype1 | 184 | 25 |
| subtype2 | 97 | 9 |
| subtype3 | 124 | 41 |
Figure S77. Get High-res Image Clustering Approach #9: 'MIRseq CNMF subtypes' versus Clinical Feature #7: 'PATHOLOGICSPREAD(M)'
P value = 8.11e-05 (Chi-square test)
Table S87. Clustering Approach #9: 'MIRseq CNMF subtypes' versus Clinical Feature #8: 'TUMOR.STAGE'
| nPatients | I | II | III | IV |
|---|---|---|---|---|
| ALL | 229 | 50 | 122 | 79 |
| subtype1 | 114 | 20 | 49 | 26 |
| subtype2 | 60 | 8 | 28 | 10 |
| subtype3 | 55 | 22 | 45 | 43 |
Figure S78. Get High-res Image Clustering Approach #9: 'MIRseq CNMF subtypes' versus Clinical Feature #8: 'TUMOR.STAGE'
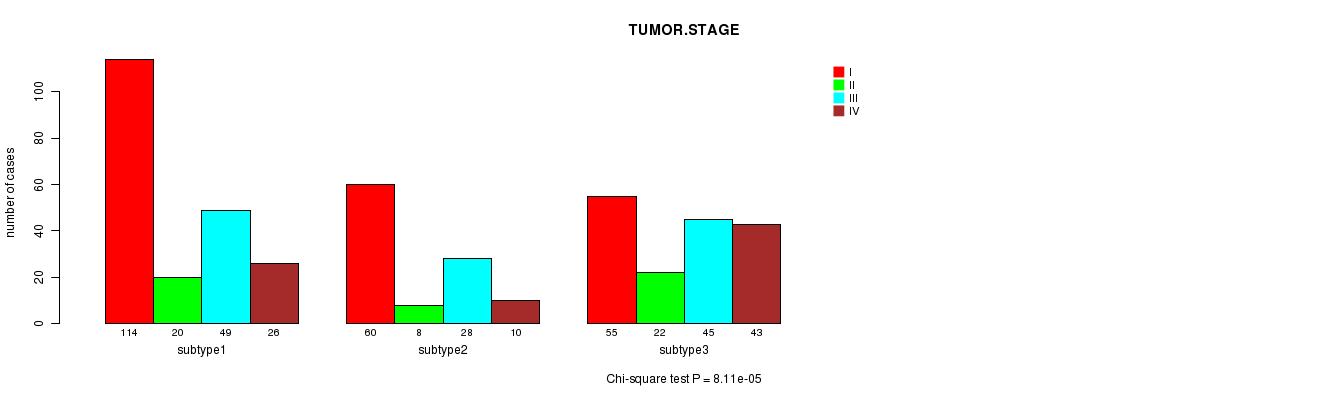
P value = 0.53 (Fisher's exact test)
Table S88. Clustering Approach #9: 'MIRseq CNMF subtypes' versus Clinical Feature #9: 'NEOADJUVANT.THERAPY'
| nPatients | NO | YES |
|---|---|---|
| ALL | 5 | 475 |
| subtype1 | 1 | 208 |
| subtype2 | 1 | 105 |
| subtype3 | 3 | 162 |
Figure S79. Get High-res Image Clustering Approach #9: 'MIRseq CNMF subtypes' versus Clinical Feature #9: 'NEOADJUVANT.THERAPY'
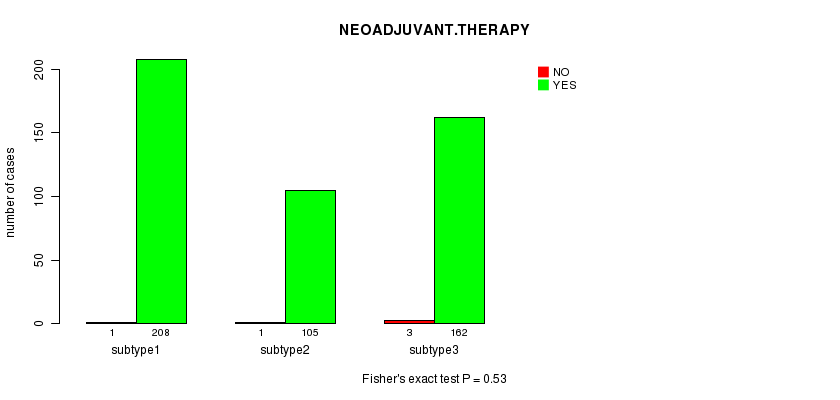
Table S89. Get Full Table Description of clustering approach #10: 'MIRseq cHierClus subtypes'
| Cluster Labels | 1 | 2 | 3 |
|---|---|---|---|
| Number of samples | 51 | 281 | 148 |
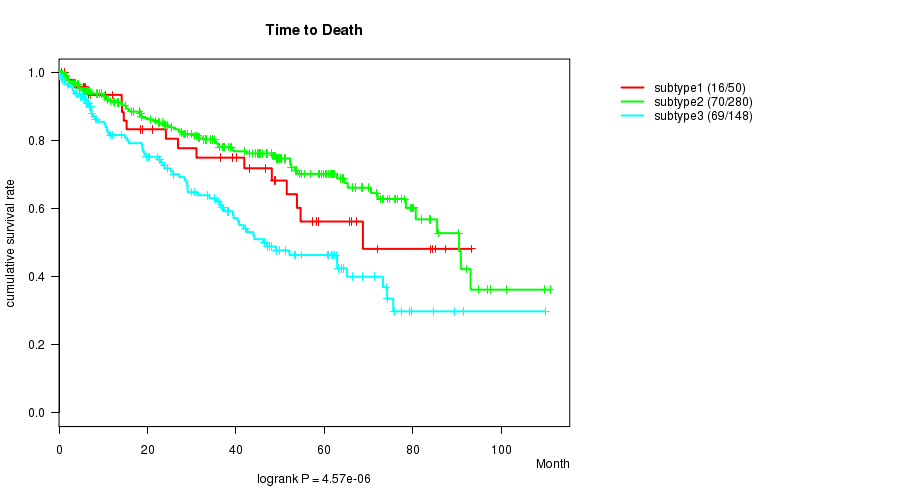
P value = 4.57e-06 (logrank test)
Table S90. Clustering Approach #10: 'MIRseq cHierClus subtypes' versus Clinical Feature #1: 'Time to Death'
| nPatients | nDeath | Duration Range (Median), Month | |
|---|---|---|---|
| ALL | 478 | 155 | 0.1 - 111.0 (35.2) |
| subtype1 | 50 | 16 | 0.5 - 93.3 (39.6) |
| subtype2 | 280 | 70 | 0.1 - 111.0 (36.0) |
| subtype3 | 148 | 69 | 0.1 - 109.9 (29.5) |
Figure S80. Get High-res Image Clustering Approach #10: 'MIRseq cHierClus subtypes' versus Clinical Feature #1: 'Time to Death'
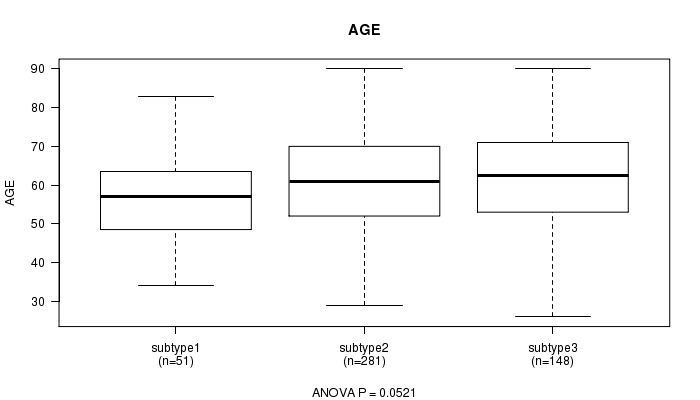
P value = 0.0521 (ANOVA)
Table S91. Clustering Approach #10: 'MIRseq cHierClus subtypes' versus Clinical Feature #2: 'AGE'
| nPatients | Mean (Std.Dev) | |
|---|---|---|
| ALL | 480 | 60.6 (12.2) |
| subtype1 | 51 | 56.7 (12.1) |
| subtype2 | 281 | 61.1 (11.9) |
| subtype3 | 148 | 61.0 (12.6) |
Figure S81. Get High-res Image Clustering Approach #10: 'MIRseq cHierClus subtypes' versus Clinical Feature #2: 'AGE'
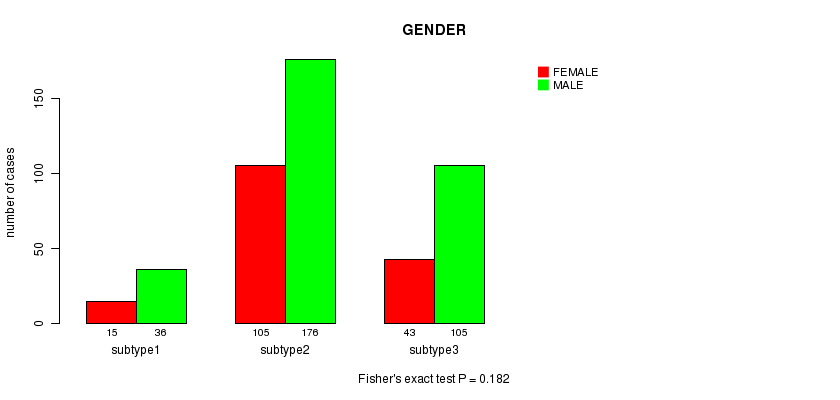
P value = 0.182 (Fisher's exact test)
Table S92. Clustering Approach #10: 'MIRseq cHierClus subtypes' versus Clinical Feature #3: 'GENDER'
| nPatients | FEMALE | MALE |
|---|---|---|
| ALL | 163 | 317 |
| subtype1 | 15 | 36 |
| subtype2 | 105 | 176 |
| subtype3 | 43 | 105 |
Figure S82. Get High-res Image Clustering Approach #10: 'MIRseq cHierClus subtypes' versus Clinical Feature #3: 'GENDER'
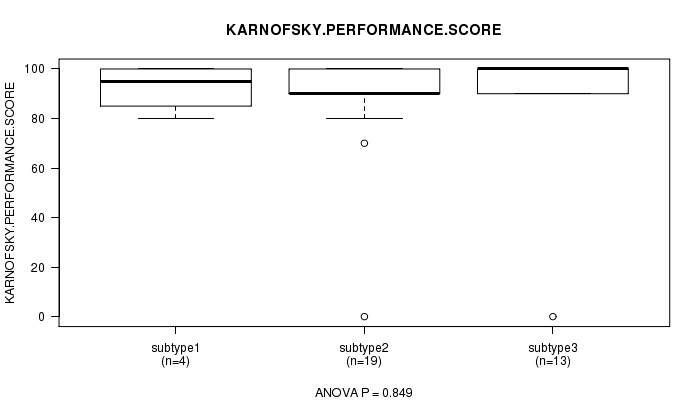
P value = 0.849 (ANOVA)
Table S93. Clustering Approach #10: 'MIRseq cHierClus subtypes' versus Clinical Feature #4: 'KARNOFSKY.PERFORMANCE.SCORE'
| nPatients | Mean (Std.Dev) | |
|---|---|---|
| ALL | 36 | 88.3 (23.0) |
| subtype1 | 4 | 92.5 (9.6) |
| subtype2 | 19 | 86.3 (22.4) |
| subtype3 | 13 | 90.0 (27.4) |
Figure S83. Get High-res Image Clustering Approach #10: 'MIRseq cHierClus subtypes' versus Clinical Feature #4: 'KARNOFSKY.PERFORMANCE.SCORE'
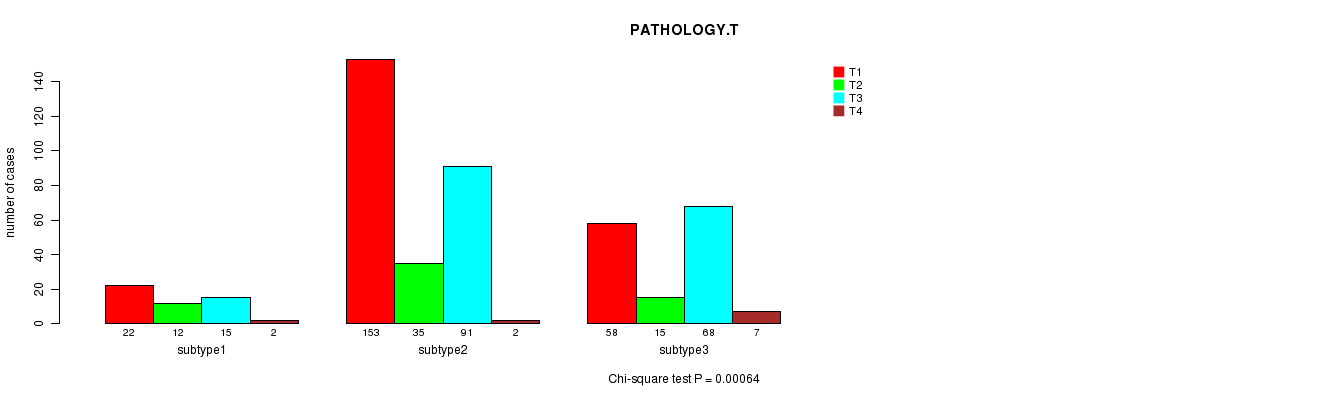
P value = 0.00064 (Chi-square test)
Table S94. Clustering Approach #10: 'MIRseq cHierClus subtypes' versus Clinical Feature #5: 'PATHOLOGY.T'
| nPatients | T1 | T2 | T3 | T4 |
|---|---|---|---|---|
| ALL | 233 | 62 | 174 | 11 |
| subtype1 | 22 | 12 | 15 | 2 |
| subtype2 | 153 | 35 | 91 | 2 |
| subtype3 | 58 | 15 | 68 | 7 |
Figure S84. Get High-res Image Clustering Approach #10: 'MIRseq cHierClus subtypes' versus Clinical Feature #5: 'PATHOLOGY.T'
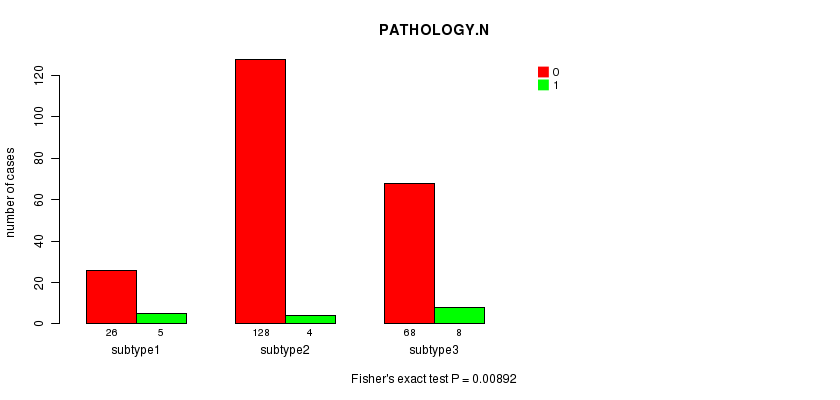
P value = 0.00892 (Fisher's exact test)
Table S95. Clustering Approach #10: 'MIRseq cHierClus subtypes' versus Clinical Feature #6: 'PATHOLOGY.N'
| nPatients | 0 | 1 |
|---|---|---|
| ALL | 222 | 17 |
| subtype1 | 26 | 5 |
| subtype2 | 128 | 4 |
| subtype3 | 68 | 8 |
Figure S85. Get High-res Image Clustering Approach #10: 'MIRseq cHierClus subtypes' versus Clinical Feature #6: 'PATHOLOGY.N'
P value = 0.282 (Fisher's exact test)
Table S96. Clustering Approach #10: 'MIRseq cHierClus subtypes' versus Clinical Feature #7: 'PATHOLOGICSPREAD(M)'
| nPatients | M0 | M1 |
|---|---|---|
| ALL | 405 | 75 |
| subtype1 | 45 | 6 |
| subtype2 | 241 | 40 |
| subtype3 | 119 | 29 |
Figure S86. Get High-res Image Clustering Approach #10: 'MIRseq cHierClus subtypes' versus Clinical Feature #7: 'PATHOLOGICSPREAD(M)'
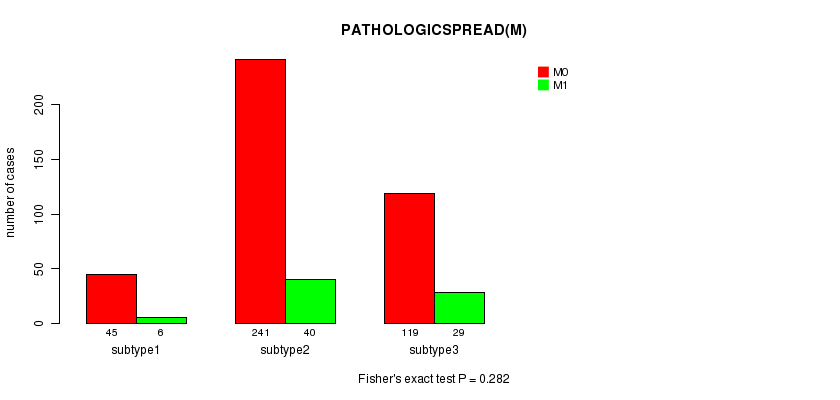
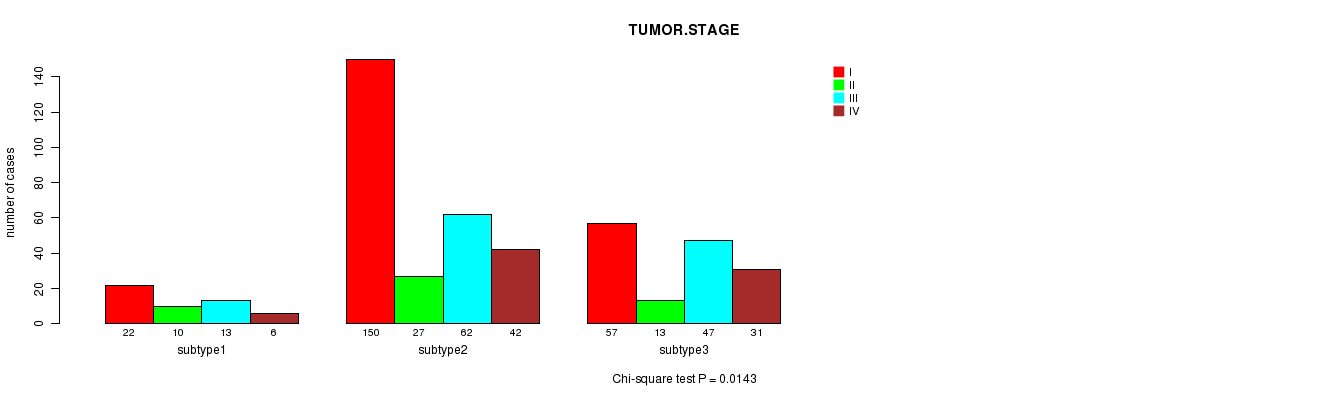
P value = 0.0143 (Chi-square test)
Table S97. Clustering Approach #10: 'MIRseq cHierClus subtypes' versus Clinical Feature #8: 'TUMOR.STAGE'
| nPatients | I | II | III | IV |
|---|---|---|---|---|
| ALL | 229 | 50 | 122 | 79 |
| subtype1 | 22 | 10 | 13 | 6 |
| subtype2 | 150 | 27 | 62 | 42 |
| subtype3 | 57 | 13 | 47 | 31 |
Figure S87. Get High-res Image Clustering Approach #10: 'MIRseq cHierClus subtypes' versus Clinical Feature #8: 'TUMOR.STAGE'
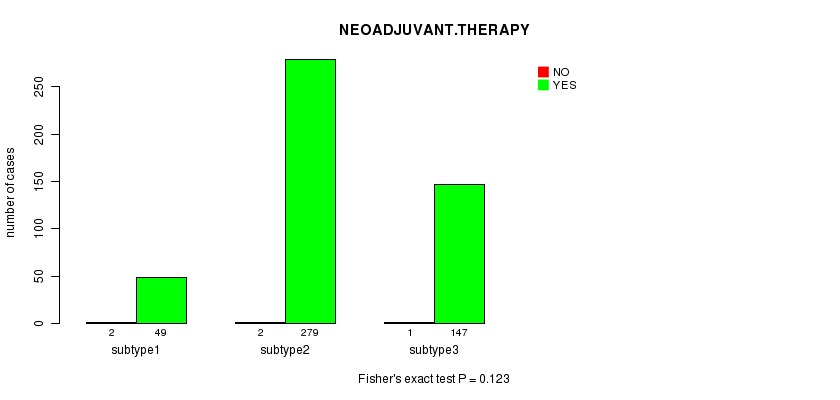
P value = 0.123 (Fisher's exact test)
Table S98. Clustering Approach #10: 'MIRseq cHierClus subtypes' versus Clinical Feature #9: 'NEOADJUVANT.THERAPY'
| nPatients | NO | YES |
|---|---|---|
| ALL | 5 | 475 |
| subtype1 | 2 | 49 |
| subtype2 | 2 | 279 |
| subtype3 | 1 | 147 |
Figure S88. Get High-res Image Clustering Approach #10: 'MIRseq cHierClus subtypes' versus Clinical Feature #9: 'NEOADJUVANT.THERAPY'
-
Cluster data file = KIRC.mergedcluster.txt
-
Clinical data file = KIRC.clin.merged.picked.txt
-
Number of patients = 502
-
Number of clustering approaches = 10
-
Number of selected clinical features = 9
-
Exclude small clusters that include fewer than K patients, K = 3
consensus non-negative matrix factorization clustering approach (Brunet et al. 2004)
Resampling-based clustering method (Monti et al. 2003)
For survival clinical features, the Kaplan-Meier survival curves of tumors with and without gene mutations were plotted and the statistical significance P values were estimated by logrank test (Bland and Altman 2004) using the 'survdiff' function in R
For continuous numerical clinical features, one-way analysis of variance (Howell 2002) was applied to compare the clinical values between tumor subtypes using 'anova' function in R
For binary clinical features, two-tailed Fisher's exact tests (Fisher 1922) were used to estimate the P values using the 'fisher.test' function in R
For multi-class clinical features (nominal or ordinal), Chi-square tests (Greenwood and Nikulin 1996) were used to estimate the P values using the 'chisq.test' function in R
This is an experimental feature. The full results of the analysis summarized in this report can be downloaded from the TCGA Data Coordination Center.