This pipeline uses various statistical tests to identify genes whose promoter methylation levels correlated to selected clinical features.
Testing the association between 17311 genes and 8 clinical features across 47 samples, statistically thresholded by Q value < 0.05, 4 clinical features related to at least one genes.
-
1 gene correlated to 'GENDER'.
-
NARFL
-
33 genes correlated to 'PATHOLOGY.T'.
-
INSM1 , DLEU2 , GNG11 , GNASAS , CDC42BPG , ...
-
25 genes correlated to 'PATHOLOGICSPREAD(M)'.
-
RFX7 , DGKI , LOC100132247 , ELMOD2 , MYADML , ...
-
29 genes correlated to 'TUMOR.STAGE'.
-
INSM1 , WDR16 , GNG11 , LYPD3 , DLEU2 , ...
-
No genes correlated to 'Time to Death', 'AGE', 'KARNOFSKY.PERFORMANCE.SCORE', and 'PATHOLOGY.N'.
Complete statistical result table is provided in Supplement Table 1
Table 1. Get Full Table This table shows the clinical features, statistical methods used, and the number of genes that are significantly associated with each clinical feature at Q value < 0.05.
| Clinical feature | Statistical test | Significant genes | Associated with | Associated with | ||
|---|---|---|---|---|---|---|
| Time to Death | Cox regression test | N=0 | ||||
| AGE | Spearman correlation test | N=0 | ||||
| GENDER | t test | N=1 | male | N=0 | female | N=1 |
| KARNOFSKY PERFORMANCE SCORE | t test | N=0 | ||||
| PATHOLOGY T | Spearman correlation test | N=33 | higher pT | N=22 | lower pT | N=11 |
| PATHOLOGY N | Spearman correlation test | N=0 | ||||
| PATHOLOGICSPREAD(M) | ANOVA test | N=25 | ||||
| TUMOR STAGE | Spearman correlation test | N=29 | higher stage | N=23 | lower stage | N=6 |
Table S1. Basic characteristics of clinical feature: 'Time to Death'
| Time to Death | Duration (Months) | 1-123.6 (median=21.6) |
| censored | N = 36 | |
| death | N = 11 | |
| Significant markers | N = 0 |
Table S2. Basic characteristics of clinical feature: 'AGE'
| AGE | Mean (SD) | 61.15 (13) |
| Significant markers | N = 0 |
Table S3. Basic characteristics of clinical feature: 'GENDER'
| GENDER | Labels | N |
| FEMALE | 16 | |
| MALE | 31 | |
| Significant markers | N = 1 | |
| Higher in MALE | 0 | |
| Higher in FEMALE | 1 |
Table S4. Get Full Table List of one gene differentially expressed by 'GENDER'
| T(pos if higher in 'MALE') | ttestP | Q | AUC | |
|---|---|---|---|---|
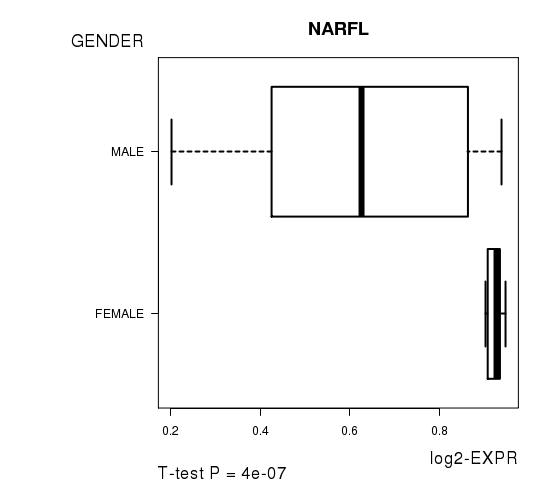
| NARFL | -6.08 | 3.996e-07 | 0.00692 | 0.8891 |
Figure S1. Get High-res Image As an example, this figure shows the association of NARFL to 'GENDER'. P value = 4e-07 with T-test analysis.
No gene related to 'KARNOFSKY.PERFORMANCE.SCORE'.
Table S5. Basic characteristics of clinical feature: 'KARNOFSKY.PERFORMANCE.SCORE'
| KARNOFSKY.PERFORMANCE.SCORE | Labels | N |
| class100 | 4 | |
| class90 | 3 | |
| Significant markers | N = 0 |
Table S6. Basic characteristics of clinical feature: 'PATHOLOGY.T'
| PATHOLOGY.T | Mean (SD) | 1.91 (1) |
| N | ||
| T1 | 25 | |
| T2 | 1 | |
| T3 | 21 | |
| Significant markers | N = 33 | |
| pos. correlated | 22 | |
| neg. correlated | 11 |
Table S7. Get Full Table List of top 10 genes significantly correlated to 'PATHOLOGY.T' by Spearman correlation test
| SpearmanCorr | corrP | Q | |
|---|---|---|---|
| INSM1 | 0.7366 | 3.58e-09 | 6.2e-05 |
| DLEU2 | -0.7329 | 4.697e-09 | 8.13e-05 |
| GNG11 | -0.7008 | 4.128e-08 | 0.000715 |
| GNASAS | -0.6876 | 9.348e-08 | 0.00162 |
| CDC42BPG | 0.6794 | 1.519e-07 | 0.00263 |
| LYPD3 | 0.6761 | 1.84e-07 | 0.00318 |
| KIR2DS4 | -0.6725 | 2.256e-07 | 0.0039 |
| VPS33B | 0.6705 | 2.524e-07 | 0.00437 |
| CCDC64B | 0.6635 | 3.726e-07 | 0.00645 |
| NSD1 | 0.6621 | 4.005e-07 | 0.00693 |
Figure S2. Get High-res Image As an example, this figure shows the association of INSM1 to 'PATHOLOGY.T'. P value = 3.58e-09 with Spearman correlation analysis.
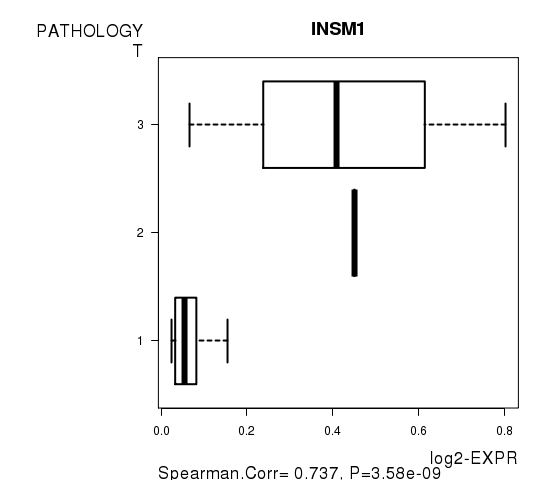
Table S8. Basic characteristics of clinical feature: 'PATHOLOGY.N'
| PATHOLOGY.N | Mean (SD) | 0.54 (0.72) |
| N | ||
| N0 | 14 | |
| N1 | 7 | |
| N2 | 3 | |
| Significant markers | N = 0 |
Table S9. Basic characteristics of clinical feature: 'PATHOLOGICSPREAD(M)'
| PATHOLOGICSPREAD(M) | Labels | N |
| M0 | 33 | |
| M1 | 4 | |
| MX | 9 | |
| Significant markers | N = 25 |
Table S10. Get Full Table List of top 10 genes differentially expressed by 'PATHOLOGICSPREAD(M)'
| ANOVA_P | Q | |
|---|---|---|
| RFX7 | 2.652e-09 | 4.59e-05 |
| DGKI | 1.111e-08 | 0.000192 |
| LOC100132247 | 2.308e-08 | 4e-04 |
| ELMOD2 | 1.321e-07 | 0.00229 |
| MYADML | 1.342e-07 | 0.00232 |
| CMTM5 | 1.661e-07 | 0.00288 |
| FAM183B | 2.98e-07 | 0.00516 |
| FBXL19 | 3.827e-07 | 0.00662 |
| GDPD4 | 4.301e-07 | 0.00744 |
| ZNF329 | 4.403e-07 | 0.00762 |
Figure S3. Get High-res Image As an example, this figure shows the association of RFX7 to 'PATHOLOGICSPREAD(M)'. P value = 2.65e-09 with ANOVA analysis.
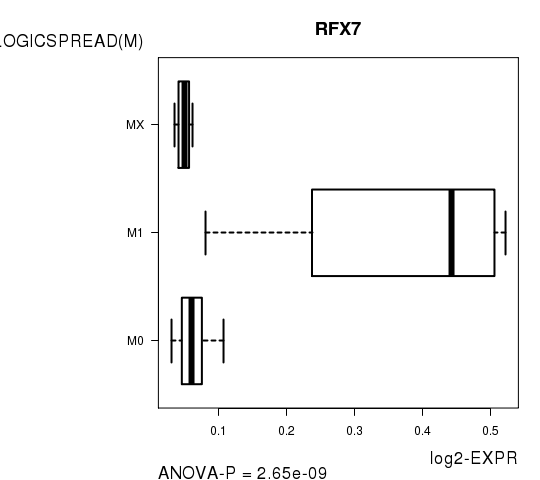
Table S11. Basic characteristics of clinical feature: 'TUMOR.STAGE'
| TUMOR.STAGE | Mean (SD) | 2.07 (1.2) |
| N | ||
| Stage 1 | 24 | |
| Stage 2 | 1 | |
| Stage 3 | 15 | |
| Stage 4 | 6 | |
| Significant markers | N = 29 | |
| pos. correlated | 23 | |
| neg. correlated | 6 |
Table S12. Get Full Table List of top 10 genes significantly correlated to 'TUMOR.STAGE' by Spearman correlation test
| SpearmanCorr | corrP | Q | |
|---|---|---|---|
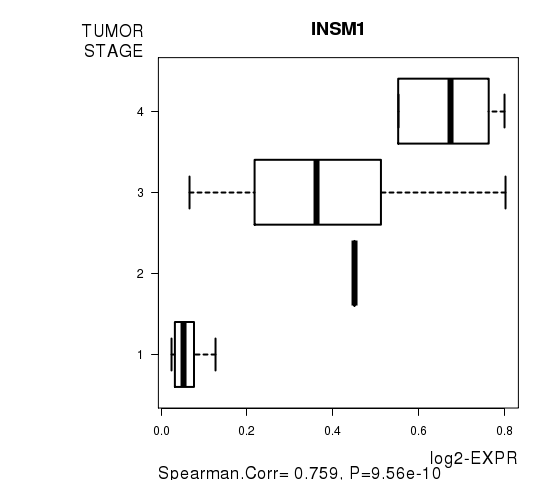
| INSM1 | 0.7593 | 9.561e-10 | 1.66e-05 |
| WDR16 | 0.6959 | 7.929e-08 | 0.00137 |
| GNG11 | -0.694 | 8.897e-08 | 0.00154 |
| LYPD3 | 0.6937 | 9.044e-08 | 0.00157 |
| DLEU2 | -0.6711 | 3.32e-07 | 0.00575 |
| ZNF177 | 0.6707 | 3.395e-07 | 0.00588 |
| NSD1 | 0.6691 | 3.7e-07 | 0.0064 |
| MYT1L | -0.6663 | 4.322e-07 | 0.00748 |
| CDC42BPG | 0.6649 | 4.668e-07 | 0.00808 |
| GNASAS | -0.6631 | 5.133e-07 | 0.00888 |
Figure S4. Get High-res Image As an example, this figure shows the association of INSM1 to 'TUMOR.STAGE'. P value = 9.56e-10 with Spearman correlation analysis.
-
Expresson data file = KIRP.meth.for_correlation.filtered_data.txt
-
Clinical data file = KIRP.clin.merged.picked.txt
-
Number of patients = 47
-
Number of genes = 17311
-
Number of clinical features = 8
For survival clinical features, Wald's test in univariate Cox regression analysis with proportional hazards model (Andersen and Gill 1982) was used to estimate the P values using the 'coxph' function in R. Kaplan-Meier survival curves were plot using the four quartile subgroups of patients based on expression levels
For continuous numerical clinical features, Spearman's rank correlation coefficients (Spearman 1904) and two-tailed P values were estimated using 'cor.test' function in R
For two-class clinical features, two-tailed Student's t test with unequal variance (Lehmann and Romano 2005) was applied to compare the log2-expression levels between the two clinical classes using 't.test' function in R
For multi-class clinical features (ordinal or nominal), one-way analysis of variance (Howell 2002) was applied to compare the log2-expression levels between different clinical classes using 'anova' function in R
For multiple hypothesis correction, Q value is the False Discovery Rate (FDR) analogue of the P value (Benjamini and Hochberg 1995), defined as the minimum FDR at which the test may be called significant. We used the 'Benjamini and Hochberg' method of 'p.adjust' function in R to convert P values into Q values.
This is an experimental feature. The full results of the analysis summarized in this report can be downloaded from the TCGA Data Coordination Center.