This pipeline uses various statistical tests to identify genes whose promoter methylation levels correlated to selected clinical features.
Testing the association between 16616 genes and 3 clinical features across 173 samples, statistically thresholded by Q value < 0.05, 3 clinical features related to at least one genes.
-
2 genes correlated to 'Time to Death'.
-
AGRN , C10ORF128
-
36 genes correlated to 'AGE'.
-
KIAA1377 , JAKMIP1 , TRIM58 , AASS , TMEM20 , ...
-
11 genes correlated to 'GENDER'.
-
FAM35A , DKFZP434L187 , KIF4B , CROCC , WBP11P1 , ...
Complete statistical result table is provided in Supplement Table 1
Table 1. Get Full Table This table shows the clinical features, statistical methods used, and the number of genes that are significantly associated with each clinical feature at Q value < 0.05.
| Clinical feature | Statistical test | Significant genes | Associated with | Associated with | ||
|---|---|---|---|---|---|---|
| Time to Death | Cox regression test | N=2 | shorter survival | N=1 | longer survival | N=1 |
| AGE | Spearman correlation test | N=36 | older | N=7 | younger | N=29 |
| GENDER | t test | N=11 | male | N=7 | female | N=4 |
Table S1. Basic characteristics of clinical feature: 'Time to Death'
| Time to Death | Duration (Months) | 0.9-94.1 (median=12.5) |
| censored | N = 59 | |
| death | N = 91 | |
| Significant markers | N = 2 | |
| associated with shorter survival | 1 | |
| associated with longer survival | 1 |
Table S2. Get Full Table List of 2 genes significantly associated with 'Time to Death' by Cox regression test
| HazardRatio | Wald_P | Q | C_index | |
|---|---|---|---|---|
| AGRN | 290000001 | 1.03e-09 | 1.7e-05 | 0.541 |
| C10ORF128 | 0.12 | 5.767e-07 | 0.0096 | 0.369 |
Figure S1. Get High-res Image As an example, this figure shows the association of AGRN to 'Time to Death'. four curves present the cumulative survival rates of 4 quartile subsets of patients. P value = 1.03e-09 with univariate Cox regression analysis using continuous log-2 expression values.

Table S3. Basic characteristics of clinical feature: 'AGE'
| AGE | Mean (SD) | 55.17 (16) |
| Significant markers | N = 36 | |
| pos. correlated | 7 | |
| neg. correlated | 29 |
Table S4. Get Full Table List of top 10 genes significantly correlated to 'AGE' by Spearman correlation test
| SpearmanCorr | corrP | Q | |
|---|---|---|---|
| KIAA1377 | -0.4586 | 2.217e-10 | 3.68e-06 |
| JAKMIP1 | -0.4558 | 2.933e-10 | 4.87e-06 |
| TRIM58 | 0.413 | 1.629e-08 | 0.000271 |
| AASS | -0.4022 | 4.115e-08 | 0.000684 |
| TMEM20 | -0.4015 | 4.388e-08 | 0.000729 |
| HIST3H2A | -0.389 | 1.226e-07 | 0.00204 |
| C21ORF70 | -0.3863 | 1.521e-07 | 0.00253 |
| TBC1D12 | -0.385 | 1.69e-07 | 0.00281 |
| CD96 | 0.3831 | 1.975e-07 | 0.00328 |
| APBB1 | -0.38 | 2.506e-07 | 0.00416 |
Figure S2. Get High-res Image As an example, this figure shows the association of KIAA1377 to 'AGE'. P value = 2.22e-10 with Spearman correlation analysis. The straight line presents the best linear regression.

Table S5. Basic characteristics of clinical feature: 'GENDER'
| GENDER | Labels | N |
| FEMALE | 83 | |
| MALE | 90 | |
| Significant markers | N = 11 | |
| Higher in MALE | 7 | |
| Higher in FEMALE | 4 |
Table S6. Get Full Table List of top 10 genes differentially expressed by 'GENDER'
| T(pos if higher in 'MALE') | ttestP | Q | AUC | |
|---|---|---|---|---|
| FAM35A | -13.06 | 3.153e-27 | 5.24e-23 | 0.9024 |
| DKFZP434L187 | 11.48 | 1.62e-22 | 2.69e-18 | 0.9376 |
| KIF4B | -11.58 | 1.665e-22 | 2.77e-18 | 0.8656 |
| CROCC | -10 | 9.068e-19 | 1.51e-14 | 0.8842 |
| WBP11P1 | 8.51 | 8.854e-15 | 1.47e-10 | 0.8361 |
| NARS | -5.73 | 4.522e-08 | 0.000751 | 0.7803 |
| FAM186A | 5.37 | 2.982e-07 | 0.00495 | 0.7146 |
| POLL | 5.27 | 4.254e-07 | 0.00707 | 0.7129 |
| LOC389791 | 5.26 | 4.373e-07 | 0.00726 | 0.7087 |
| PLLP | 5.15 | 8.639e-07 | 0.0143 | 0.7331 |
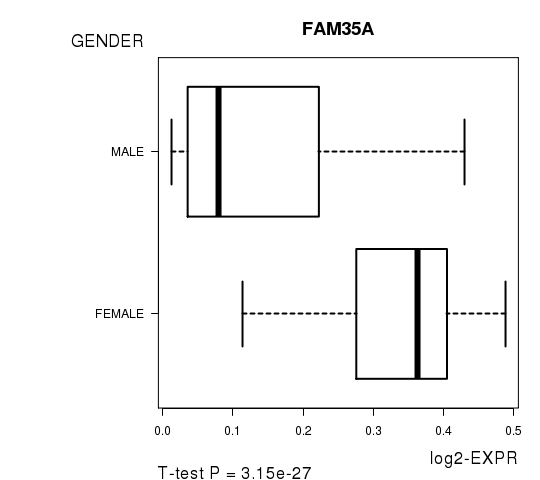
Figure S3. Get High-res Image As an example, this figure shows the association of FAM35A to 'GENDER'. P value = 3.15e-27 with T-test analysis.
-
Expresson data file = LAML.meth.for_correlation.filtered_data.txt
-
Clinical data file = LAML.clin.merged.picked.txt
-
Number of patients = 173
-
Number of genes = 16616
-
Number of clinical features = 3
For survival clinical features, Wald's test in univariate Cox regression analysis with proportional hazards model (Andersen and Gill 1982) was used to estimate the P values using the 'coxph' function in R. Kaplan-Meier survival curves were plot using the four quartile subgroups of patients based on expression levels
For continuous numerical clinical features, Spearman's rank correlation coefficients (Spearman 1904) and two-tailed P values were estimated using 'cor.test' function in R
For two-class clinical features, two-tailed Student's t test with unequal variance (Lehmann and Romano 2005) was applied to compare the log2-expression levels between the two clinical classes using 't.test' function in R
For multiple hypothesis correction, Q value is the False Discovery Rate (FDR) analogue of the P value (Benjamini and Hochberg 1995), defined as the minimum FDR at which the test may be called significant. We used the 'Benjamini and Hochberg' method of 'p.adjust' function in R to convert P values into Q values.
This is an experimental feature. The full results of the analysis summarized in this report can be downloaded from the TCGA Data Coordination Center.