This report serves to describe the mutational landscape and properties of a given individual set, as well as rank genes and genesets according to mutational significance. MutSig v2.0 was used to generate the results found in this report.
-
Working with individual set: LAML
-
Number of patients in set: 199
The input for this pipeline is a set of individuals with the following files associated for each:
-
An annotated .maf file describing the mutations called for the respective individual, and their properties.
-
A .wig file that contains information about the coverage of the sample.
-
MAF used for this analysis:LAML.final_analysis_set.maf
-
Significantly mutated genes (q ≤ 0.1): 53
-
Mutations seen in COSMIC: 234
-
Significantly mutated genes in COSMIC territory: 18
-
Genes with clustered mutations (≤ 3 aa apart): 0
-
Significantly mutated genesets: 58
-
Significantly mutated genesets: (excluding sig. mutated genes):0
-
Read 199 MAFs of type "WashU"
-
Total number of mutations in input MAFs: 5617
-
After removing 98 mutations outside chr1-24: 5519
-
After removing 387 noncoding mutations: 5132
-
After collapsing adjacent/redundant mutations: 5126
-
Number of mutations before filtering: 5126
-
After removing 640 mutations outside gene set: 4486
-
After removing 10 mutations outside category set: 4476
Table 1. Get Full Table Table representing breakdown of mutations by type.
| type | count |
|---|---|
| Frame_Shift_Del | 102 |
| Frame_Shift_Ins | 118 |
| In_Frame_Del | 100 |
| In_Frame_Ins | 58 |
| Missense_Mutation | 2728 |
| Nonsense_Mutation | 191 |
| Nonstop_Mutation | 2 |
| Silent | 1073 |
| Splice_Site | 104 |
| Total | 4476 |
Table 2. Get Full Table A breakdown of mutation rates per category discovered for this individual set.
| category | n | N | rate | rate_per_mb | relative_rate |
|---|---|---|---|---|---|
| *CpG->T | 802 | 275075312 | 2.9e-06 | 2.9 | 4.7 |
| *Cp(A/C/T)->T | 690 | 2493147819 | 2.8e-07 | 0.28 | 0.45 |
| A->G | 365 | 2773129874 | 1.3e-07 | 0.13 | 0.21 |
| transver | 869 | 5541353005 | 1.6e-07 | 0.16 | 0.26 |
| indel+null | 668 | 5541353204 | 1.2e-07 | 0.12 | 0.2 |
| double_null | 9 | 5541353204 | 1.6e-09 | 0.0016 | 0.0026 |
| Total | 3403 | 5541353204 | 6.1e-07 | 0.61 | 1 |
The x axis represents the samples. The y axis represents the exons, one row per exon, and they are sorted by average coverage across samples. For exons with exactly the same average coverage, they are sorted next by the %GC of the exon. (The secondary sort is especially useful for the zero-coverage exons at the bottom).
Figure 1.
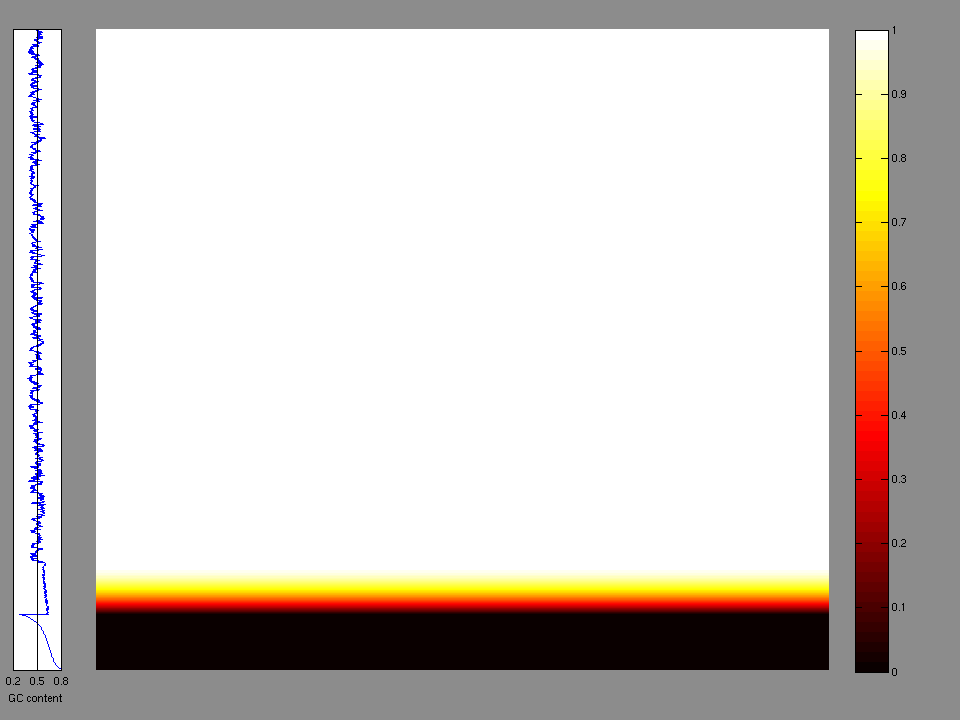
Figure 2. Patients counts and rates file used to generate this plot: LAML.patients.counts_and_rates.txt
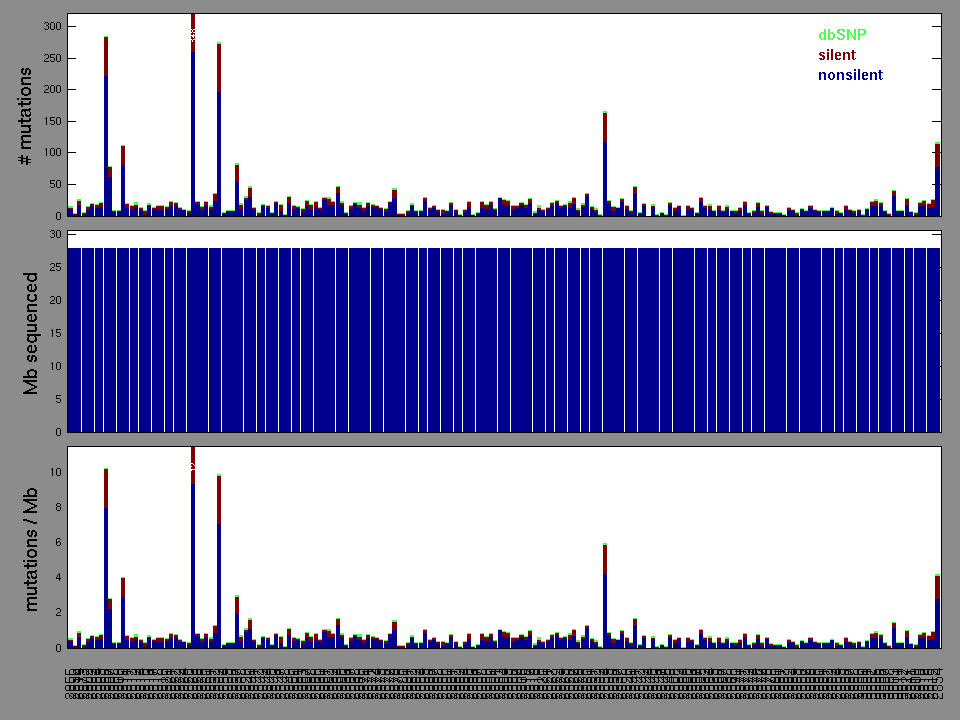
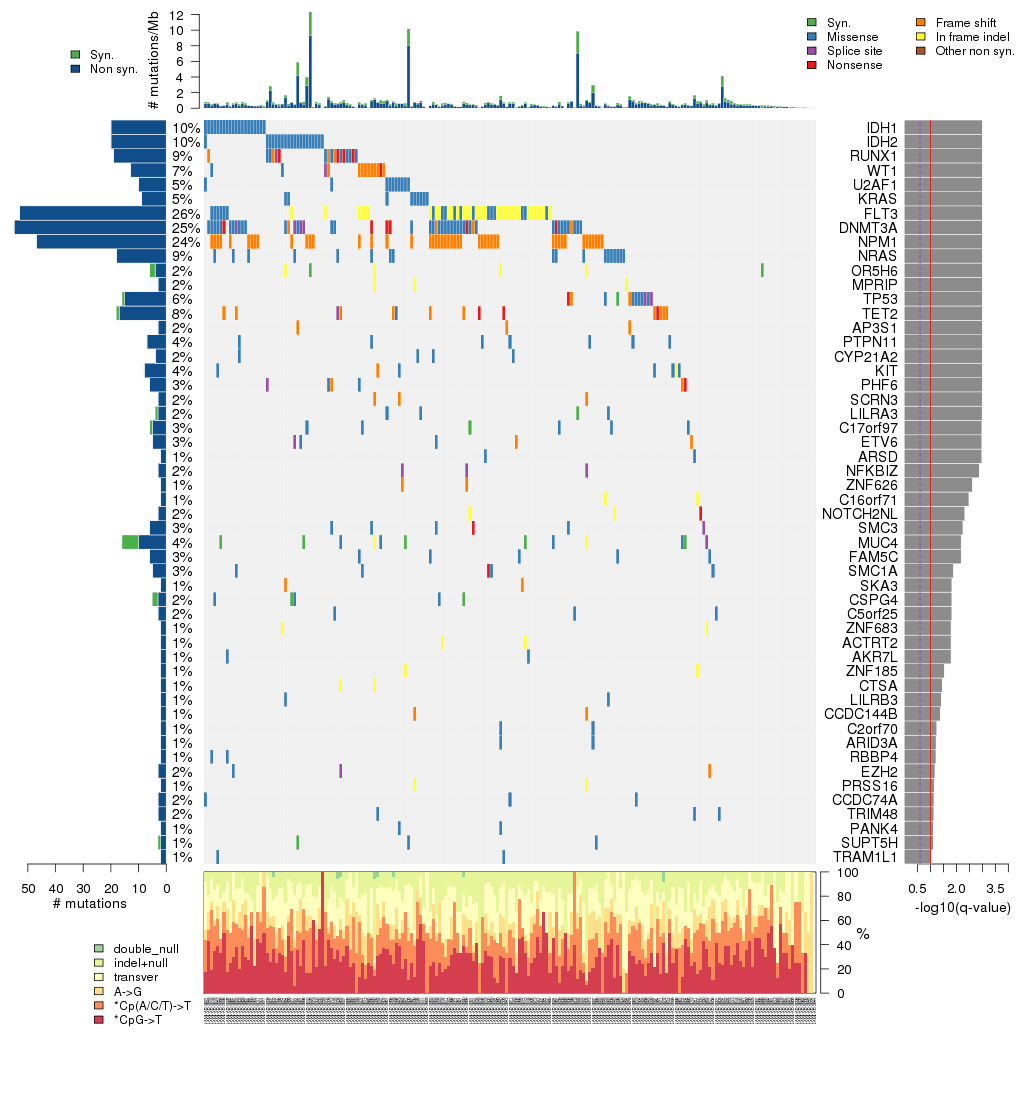
Figure 3. Get High-res Image The matrix in the center of the figure represents individual mutations in patient samples, color-coded by type of mutation, for the significantly mutated genes. The rate of synonymous and non-synonymous mutations is displayed at the top of the matrix. The barplot on the left of the matrix shows the number of mutations in each gene. The percentages represent the fraction of tumors with at least one mutation in the specified gene. The barplot to the right of the matrix displays the q-values for the most significantly mutated genes. The purple boxplots below the matrix (only displayed if required columns are present in the provided MAF) represent the distributions of allelic fractions observed in each sample. The plot at the bottom represents the base substitution distribution of individual samples, using the same categories that were used to calculate significance.
Column Descriptions:
-
N = number of sequenced bases in this gene across the individual set
-
n = number of (nonsilent) mutations in this gene across the individual set
-
npat = number of patients (individuals) with at least one nonsilent mutation
-
nsite = number of unique sites having a non-silent mutation
-
nsil = number of silent mutations in this gene across the individual set
-
n1 = number of nonsilent mutations of type: *CpG->T
-
n2 = number of nonsilent mutations of type: *Cp(A/C/T)->T
-
n3 = number of nonsilent mutations of type: A->G
-
n4 = number of nonsilent mutations of type: transver
-
n5 = number of nonsilent mutations of type: indel+null
-
p_classic = p-value for the observed amount of nonsilent mutations being elevated in this gene
-
p_ks = p-value for clustering of mutations (Kolmogorov-Smirnoff test)
-
p_cons = p-value for enrichment of mutations at evolutionarily most-conserved sites in gene
-
p_joint = p-value for clustering + conservation
-
p = p-value (overall)
-
q = q-value, False Discovery Rate (Benjamini-Hochberg procedure)
Table 3. Get Full Table A Ranked List of Significantly Mutated Genes. Number of significant genes found: 53. Number of genes displayed: 35. Click on a gene name to display its stick figure depicting the distribution of mutations and mutation types across the chosen gene (this feature may not be available for all significant genes).
| rank | gene | description | N | n | npat | nsite | nsil | n1 | n2 | n3 | n4 | n5 | n6 | p_classic | p_ks | p_cons | p_joint | p | q |
|---|---|---|---|---|---|---|---|---|---|---|---|---|---|---|---|---|---|---|---|
| 1 | IDH1 | isocitrate dehydrogenase 1 (NADP+), soluble | 254123 | 20 | 20 | 2 | 0 | 18 | 0 | 0 | 2 | 0 | 0 | <1.00e-15 | 2e-07 | 0.97 | 0.000011 | <0.00 | <0.00 |
| 2 | IDH2 | isocitrate dehydrogenase 2 (NADP+), mitochondrial | 232631 | 20 | 20 | 2 | 0 | 16 | 3 | 0 | 1 | 0 | 0 | 1.67e-15 | 2e-07 | 0.16 | 0.000032 | 0.00 | 0.00 |
| 3 | RUNX1 | runt-related transcription factor 1 (acute myeloid leukemia 1; aml1 oncogene) | 146663 | 19 | 17 | 16 | 0 | 1 | 3 | 2 | 3 | 9 | 1 | <1.00e-15 | 3.8e-06 | 0.08 | 0.000015 | <0.00 | <0.00 |
| 4 | WT1 | Wilms tumor 1 | 166364 | 13 | 13 | 9 | 0 | 1 | 1 | 0 | 0 | 10 | 1 | <1.00e-15 | 9.4e-06 | 0.95 | 0.000064 | <0.00 | <0.00 |
| 5 | U2AF1 | U2 small nuclear RNA auxiliary factor 1 | 154822 | 10 | 10 | 3 | 0 | 0 | 6 | 0 | 4 | 0 | 0 | <1.00e-15 | 0.000013 | 0.0069 | 0.000022 | <0.00 | <0.00 |
| 6 | KRAS | v-Ki-ras2 Kirsten rat sarcoma viral oncogene homolog | 140693 | 9 | 9 | 5 | 0 | 0 | 4 | 1 | 4 | 0 | 0 | <1.00e-15 | 0.0048 | 0.2 | 0.0052 | <2.22e-16 | <6.39e-13 |
| 7 | FLT3 | fms-related tyrosine kinase 3 | 603169 | 53 | 52 | 29 | 0 | 0 | 1 | 1 | 16 | 35 | 0 | 2.00e-15 | 2e-07 | 2e-07 | 0 | <1.00e-15 | <1.44e-12 |
| 8 | DNMT3A | DNA (cytosine-5-)-methyltransferase 3 alpha | 517997 | 55 | 50 | 28 | 0 | 33 | 2 | 2 | 4 | 14 | 0 | <1.00e-15 | 2e-07 | 2e-07 | 0 | <1.00e-15 | <1.44e-12 |
| 9 | NPM1 | nucleophosmin (nucleolar phosphoprotein B23, numatrin) | 185269 | 47 | 47 | 1 | 0 | 0 | 0 | 0 | 0 | 47 | 0 | <1.00e-15 | 2e-07 | 2e-07 | 0 | <1.00e-15 | <1.44e-12 |
| 10 | NRAS | neuroblastoma RAS viral (v-ras) oncogene homolog | 116614 | 18 | 18 | 6 | 0 | 0 | 9 | 1 | 8 | 0 | 0 | 1.89e-15 | 2e-07 | 0.13 | 0 | <1.00e-15 | <1.44e-12 |
| 11 | OR5H6 | olfactory receptor, family 5, subfamily H, member 6 | 195418 | 4 | 4 | 1 | 2 | 0 | 0 | 0 | 0 | 4 | 0 | 3.47e-06 | 4e-07 | 0.034 | 0 | <1.00e-15 | <1.44e-12 |
| 12 | MPRIP | 375911 | 3 | 3 | 1 | 0 | 0 | 0 | 0 | 0 | 3 | 0 | 0.0013 | 2e-07 | 0.99 | 0 | <1.00e-15 | <1.44e-12 | |
| 13 | TP53 | tumor protein p53 | 260889 | 15 | 11 | 15 | 1 | 3 | 2 | 4 | 1 | 5 | 0 | 1.44e-15 | 0.0074 | 0.18 | 0.02 | 1.11e-15 | 1.48e-12 |
| 14 | TET2 | tet oncogene family member 2 | 696898 | 17 | 15 | 17 | 1 | 0 | 1 | 0 | 2 | 9 | 5 | 1.22e-15 | 0.06 | 0.096 | 0.049 | 2.33e-15 | 2.88e-12 |
| 15 | AP3S1 | adaptor-related protein complex 3, sigma 1 subunit | 106067 | 3 | 3 | 1 | 0 | 0 | 0 | 0 | 0 | 3 | 0 | 0.000011 | 2e-06 | 0.078 | 1.2e-06 | 3.49e-10 | 4.02e-07 |
| 16 | PTPN11 | protein tyrosine phosphatase, non-receptor type 11 (Noonan syndrome 1) | 362976 | 7 | 7 | 6 | 0 | 0 | 3 | 1 | 3 | 0 | 0 | 6.06e-10 | 0.077 | 0.13 | 0.034 | 5.29e-10 | 5.71e-07 |
| 17 | CYP21A2 | cytochrome P450, family 21, subfamily A, polypeptide 2 | 205567 | 4 | 4 | 1 | 0 | 0 | 4 | 0 | 0 | 0 | 0 | 2.92e-06 | 2e-07 | 1 | 1e-05 | 7.50e-10 | 7.46e-07 |
| 18 | KIT | v-kit Hardy-Zuckerman 4 feline sarcoma viral oncogene homolog | 591229 | 8 | 7 | 5 | 0 | 1 | 0 | 0 | 5 | 2 | 0 | 5.12e-09 | 0.0096 | 0.023 | 0.006 | 7.78e-10 | 7.46e-07 |
| 19 | PHF6 | PHD finger protein 6 | 246561 | 6 | 6 | 6 | 0 | 0 | 1 | 0 | 1 | 4 | 0 | 5.09e-10 | 0.47 | 0.067 | 0.17 | 2.10e-09 | 1.91e-06 |
| 20 | SCRN3 | secernin 3 | 259297 | 3 | 3 | 1 | 0 | 0 | 0 | 0 | 0 | 3 | 0 | 0.00026 | 8e-07 | 0.93 | 1.4e-06 | 8.35e-09 | 7.21e-06 |
| 21 | LILRA3 | leukocyte immunoglobulin-like receptor, subfamily A (without TM domain), member 3 | 268252 | 3 | 3 | 1 | 1 | 0 | 0 | 0 | 3 | 0 | 0 | 0.00018 | 1.2e-06 | 0.71 | 4.6e-06 | 1.77e-08 | 0.000015 |
| 22 | C17orf97 | 168553 | 5 | 5 | 4 | 1 | 0 | 0 | 1 | 4 | 0 | 0 | 1.61e-08 | 0.13 | 0.99 | 0.19 | 6.45e-08 | 0.000051 | |
| 23 | ETV6 | ets variant gene 6 (TEL oncogene) | 276809 | 5 | 5 | 5 | 0 | 0 | 0 | 1 | 1 | 3 | 0 | 7.53e-08 | 0.083 | 0.067 | 0.049 | 7.53e-08 | 0.000057 |
| 24 | ARSD | arylsulfatase D | 356608 | 2 | 2 | 1 | 0 | 0 | 0 | 0 | 2 | 0 | 0 | 0.0067 | 0.00065 | 0.000059 | 8e-07 | 1.07e-07 | 0.000077 |
| 25 | NFKBIZ | nuclear factor of kappa light polypeptide gene enhancer in B-cells inhibitor, zeta | 380488 | 3 | 3 | 1 | 0 | 0 | 0 | 0 | 0 | 3 | 0 | 0.00091 | 0.000026 | 0.66 | 0.000026 | 4.43e-07 | 0.00031 |
| 26 | ZNF626 | zinc finger protein 626 | 326559 | 2 | 2 | 1 | 0 | 0 | 0 | 0 | 0 | 2 | 0 | 0.0053 | 0.0006 | 0.00048 | 0.000023 | 2.05e-06 | 0.0014 |
| 27 | C16orf71 | chromosome 16 open reading frame 71 | 278600 | 2 | 2 | 1 | 0 | 0 | 0 | 0 | 0 | 2 | 0 | 0.0019 | 0.00064 | 0.00089 | 0.00011 | 3.53e-06 | 0.0023 |
| 28 | NOTCH2NL | Notch homolog 2 (Drosophila) N-terminal like | 144673 | 3 | 3 | 2 | 0 | 0 | 0 | 0 | 0 | 3 | 0 | 6.23e-06 | NaN | NaN | NaN | 6.23e-06 | 0.0038 |
| 29 | SMC3 | structural maintenance of chromosomes 3 | 746449 | 6 | 6 | 6 | 0 | 1 | 1 | 1 | 1 | 2 | 0 | 4.98e-07 | 0.78 | 0.31 | 1 | 7.73e-06 | 0.0046 |
| 30 | MUC4 | mucin 4, cell surface associated | 1002562 | 10 | 7 | 8 | 6 | 1 | 0 | 1 | 5 | 3 | 0 | 1.52e-06 | 0.24 | 0.86 | 0.41 | 9.54e-06 | 0.0055 |
| 31 | FAM5C | family with sequence similarity 5, member C | 463471 | 6 | 5 | 6 | 0 | 4 | 1 | 0 | 1 | 0 | 0 | 7.56e-07 | 0.74 | 0.52 | 0.85 | 9.81e-06 | 0.0055 |
| 32 | SMC1A | structural maintenance of chromosomes 1A | 752419 | 5 | 5 | 5 | 0 | 1 | 0 | 1 | 2 | 1 | 0 | 0.000014 | 0.83 | 0.02 | 0.11 | 0.000022 | 0.012 |
| 33 | SKA3 | 241785 | 2 | 2 | 1 | 0 | 0 | 0 | 0 | 0 | 2 | 0 | 0.0032 | 0.00076 | 0.39 | 0.00058 | 0.000026 | 0.014 | |
| 34 | CSPG4 | chondroitin sulfate proteoglycan 4 | 659486 | 3 | 3 | 3 | 2 | 1 | 1 | 0 | 1 | 0 | 0 | 0.0028 | 0.000082 | 0.38 | 0.00072 | 0.000028 | 0.014 |
| 35 | C5orf25 | chromosome 5 open reading frame 25 | 254123 | 3 | 3 | 2 | 0 | 1 | 2 | 0 | 0 | 0 | 0 | 0.000029 | NaN | NaN | NaN | 0.000029 | 0.014 |
In this analysis, COSMIC is used as a filter to increase power by restricting the territory of each gene. Cosmic version: v48.
Table 4. Get Full Table Significantly mutated genes (COSMIC territory only). To access the database please go to: COSMIC. Number of significant genes found: 18. Number of genes displayed: 10
| rank | gene | description | n | cos | n_cos | N_cos | cos_ev | p | q |
|---|---|---|---|---|---|---|---|---|---|
| 1 | TP53 | tumor protein p53 | 15 | 823 | 15 | 163777 | 3379 | 0 | 0 |
| 2 | IDH1 | isocitrate dehydrogenase 1 (NADP+), soluble | 20 | 3 | 20 | 597 | 29840 | 2.4e-15 | 5.3e-12 |
| 3 | IDH2 | isocitrate dehydrogenase 2 (NADP+), mitochondrial | 20 | 6 | 20 | 1194 | 2000 | 4.6e-15 | 6.6e-12 |
| 4 | NRAS | neuroblastoma RAS viral (v-ras) oncogene homolog | 18 | 28 | 18 | 5572 | 13364 | 2.2e-14 | 1.7e-11 |
| 5 | NPM1 | nucleophosmin (nucleolar phosphoprotein B23, numatrin) | 47 | 29 | 47 | 5771 | 172819 | 2.2e-14 | 1.7e-11 |
| 6 | PTPN11 | protein tyrosine phosphatase, non-receptor type 11 (Noonan syndrome 1) | 7 | 31 | 6 | 6169 | 260 | 2.4e-14 | 1.7e-11 |
| 7 | KRAS | v-Ki-ras2 Kirsten rat sarcoma viral oncogene homolog | 9 | 51 | 8 | 10149 | 62973 | 3.9e-14 | 2.5e-11 |
| 8 | FLT3 | fms-related tyrosine kinase 3 | 53 | 114 | 49 | 22686 | 6227 | 8.7e-14 | 4.8e-11 |
| 9 | RUNX1 | runt-related transcription factor 1 (acute myeloid leukemia 1; aml1 oncogene) | 19 | 175 | 17 | 34825 | 88 | 1.3e-13 | 5.6e-11 |
| 10 | KIT | v-kit Hardy-Zuckerman 4 feline sarcoma viral oncogene homolog | 8 | 183 | 7 | 36417 | 3934 | 1.4e-13 | 5.6e-11 |
Note:
n - number of (nonsilent) mutations in this gene across the individual set.
cos = number of unique mutated sites in this gene in COSMIC
n_cos = overlap between n and cos.
N_cos = number of individuals times cos.
cos_ev = total evidence: number of reports in COSMIC for mutations seen in this gene.
p = p-value for seeing the observed amount of overlap in this gene)
q = q-value, False Discovery Rate (Benjamini-Hochberg procedure)
There were no clustered mutations discovered.
Table 5. Get Full Table A Ranked List of Significantly Mutated Genesets. (Source: MSigDB GSEA Cannonical Pathway Set).Number of significant genesets found: 58. Number of genesets displayed: 10
| rank | geneset | description | genes | N_genes | mut_tally | N | n | npat | nsite | nsil | n1 | n2 | n3 | n4 | n5 | n6 | p | q |
|---|---|---|---|---|---|---|---|---|---|---|---|---|---|---|---|---|---|---|
| 1 | HSA04060_CYTOKINE_CYTOKINE_RECEPTOR_INTERACTION | Genes involved in cytokine-cytokine receptor interaction | ACVR1, ACVR1B, ACVR2A, ACVR2B, AMH, AMHR2, BMP2, BMP7, BMPR1A, BMPR1B, BMPR2, CCL1, CCL11, CCL13, CCL14, CCL15, CCL16, CCL17, CCL18, CCL19, CCL2, CCL20, CCL21, CCL22, CCL23, CCL24, CCL25, CCL26, CCL27, CCL28, CCL3, CCL4, CCL5, CCL7, CCL8, CCR1, CCR2, CCR3, CCR4, CCR5, CCR6, CCR7, CCR8, CCR9, CD27, CD40, CD40LG, CD70, CLCF1, CNTF, CNTFR, CRLF2, CSF1, CSF1R, CSF2, CSF2RA, CSF2RB, CSF3, CSF3R, CTF1, CX3CL1, CX3CR1, CXCL1, CXCL10, CXCL11, CXCL12, CXCL13, CXCL14, CXCL16, CXCL2, CXCL3, CXCL5, CXCL6, CXCL9, CXCR3, CXCR4, CXCR6, EDA, EDA2R, EDAR, EGF, EGFR, EPO, EPOR, FAS, FASLG, FLJ78302, FLT1, FLT3, FLT3LG, FLT4, GDF5, GH1, GH2, GHR, HGF, IFNA1, IFNA10, IFNA13, IFNA14, IFNA16, IFNA17, IFNA2, IFNA21, IFNA4, IFNA5, IFNA6, IFNA7, IFNA8, IFNAR1, IFNAR2, IFNB1, IFNE1, IFNG, IFNGR1, IFNGR2, IFNK, IFNW1, IL10, IL10RA, IL10RB, IL11, IL11RA, IL12A, IL12B, IL12RB1, IL12RB2, IL13, IL13RA1, IL15, IL15RA, IL17A, IL17B, IL17RA, IL17RB, IL18, IL18R1, IL18RAP, IL19, IL1A, IL1B, IL1R1, IL1R2, IL1RAP, IL2, IL20, IL20RA, IL21, IL21R, IL22, IL22RA1, IL22RA2, IL23A, IL23R, IL24, IL25, IL26, IL28A, IL28B, IL28RA, IL29, IL2RA, IL2RB, IL2RG, IL3, IL3RA, IL4, IL4R, IL5, IL5RA, IL6, IL6R, IL6ST, IL7, IL7R, IL8, IL8RA, IL8RB, IL9, IL9R, INHBA, INHBB, INHBC, INHBE, KDR, KIT, KITLG, LEP, LEPR, LIF, LIFR, LOC728045, LTA, LTB, LTBR, MET, MPL, NGFR, OSM, OSMR, PDGFB, PDGFC, PDGFRA, PDGFRB, PF4, PF4V1, PLEKHO2, PPBP, PRL, PRLR, RELT, TGFB1, TGFB2, TGFB3, TGFBR1, TGFBR2, TNF, TNFRSF10A, TNFRSF10B, TNFRSF10C, TNFRSF10D, TNFRSF11A, TNFRSF11B, TNFRSF12A, TNFRSF13B, TNFRSF13C, TNFRSF14, TNFRSF17, TNFRSF18, TNFRSF19, TNFRSF1A, TNFRSF1B, TNFRSF21, TNFRSF25, TNFRSF4, TNFRSF6B, TNFRSF8, TNFRSF9, TNFSF10, TNFSF11, TNFSF12, TNFSF13, TNFSF13B, TNFSF14, TNFSF15, TNFSF18, TNFSF4, TNFSF8, TNFSF9, TPO, TSLP, VEGFA, VEGFB, VEGFC, XCL1, XCL2, XCR1 | 242 | ACVR2B(1), CCL11(1), CCL16(1), CCL17(1), CCL20(1), CCL21(1), CD70(1), CLCF1(1), CSF3R(2), CXCL16(1), EGF(1), EGFR(2), FLT1(1), FLT3(53), GHR(1), IFNA16(1), IL1R1(1), IL23R(1), IL25(1), KDR(2), KIT(8), KITLG(1), MPL(1), PDGFRA(1), PDGFRB(1), PLEKHO2(1), TPO(1) | 50091285 | 89 | 80 | 62 | 10 | 7 | 10 | 3 | 31 | 38 | 0 | <1.00e-15 | <5.13e-14 |
| 2 | HSA00271_METHIONINE_METABOLISM | Genes involved in methionine metabolism | AHCY, AMD1, BHMT, CBS, CTH, DNMT1, DNMT3A, DNMT3B, KIAA0828, MARS, MARS2, MAT1A, MAT2B, MTAP, MTFMT, MTR, SRM, TAT | 17 | CBS(1), DNMT1(2), DNMT3A(55), DNMT3B(2), MAT1A(1) | 5761050 | 61 | 54 | 34 | 0 | 35 | 2 | 4 | 6 | 14 | 0 | <1.00e-15 | <5.13e-14 |
| 3 | METHIONINE_METABOLISM | AHCY, BHMT, CBS, CTH, DNMT1, DNMT2, DNMT3A, DNMT3B, MARS, MARS2, MAT1A, MAT2B, MTR | 12 | CBS(1), DNMT1(2), DNMT3A(55), DNMT3B(2), MAT1A(1) | 4890226 | 61 | 54 | 34 | 0 | 35 | 2 | 4 | 6 | 14 | 0 | <1.00e-15 | <5.13e-14 | |
| 4 | ERYTHPATHWAY | Erythropoietin selectively stimulates erythrocyte differentiation from CFU-GEMM cells in bone marrow. | CCL3, CSF2, CSF3, EPO, FLT3, IGF1, IL11, IL1A, IL3, IL6, IL9, KITLG, TGFB1, TGFB2, TGFB3 | 14 | FLT3(53), KITLG(1) | 2401930 | 54 | 53 | 30 | 0 | 0 | 1 | 1 | 17 | 35 | 0 | <1.00e-15 | <5.13e-14 |
| 5 | NUCLEAR_RECEPTORS | ALK, AR, ESR1, ESR2, ESRRA, HNF4A, NPM1, NR0B1, NR1D2, NR1H2, NR1H3, NR1I2, NR1I3, NR2C2, NR2E1, NR2F1, NR2F2, NR2F6, NR3C1, NR4A1, NR4A2, NR5A1, NR5A2, PGR, PPARA, PPARD, PPARG, RARA, RARB, RARG, ROR1, RORA, RORC, RXRA, RXRB, RXRG, THRA, THRA, NR1D1, THRB, VDR | 38 | NPM1(47), NR1D1(1), NR1D2(1), NR2E1(2), THRA(1), THRB(1) | 11707369 | 53 | 51 | 7 | 1 | 1 | 2 | 0 | 2 | 48 | 0 | <1.00e-15 | <5.13e-14 | |
| 6 | HSA00480_GLUTATHIONE_METABOLISM | Genes involved in glutathione metabolism | ANPEP, G6PD, GCLC, GCLM, GGT1, GGTL3, GGTL4, GPX1, GPX2, GPX3, GPX4, GPX5, GPX6, GPX7, GSR, GSS, GSTA1, GSTA2, GSTA3, GSTA4, GSTA5, GSTK1, GSTM1, GSTM2, GSTM3, GSTM4, GSTM5, GSTO2, GSTP1, GSTT1, GSTT2, GSTZ1, IDH1, IDH2, MGST1, MGST2, MGST3, OPLAH, TXNDC12 | 34 | G6PD(1), GCLM(1), GPX2(1), GSTK1(2), GSTM3(2), GSTT2(1), IDH1(20), IDH2(20) | 5829506 | 48 | 46 | 12 | 1 | 35 | 6 | 1 | 6 | 0 | 0 | <1.00e-15 | <5.13e-14 |
| 7 | GLUTATHIONE_METABOLISM | ANPEP, G6PD, GCLC, GCLM, GGT1, GPX1, GPX2, GPX3, GPX4, GPX5, GSS, GSTA1, GSTA2, GSTA3, GSTA4, GSTM1, GSTM2, GSTM3, GSTM4, GSTM5, GSTO2, GSTP1, GSTT1, GSTT2, GSTZ1, IDH1, IDH2, MGST1, MGST2, MGST3, PGD | 29 | G6PD(1), GCLM(1), GPX2(1), GSTM3(2), GSTT2(1), IDH1(20), IDH2(20), PGD(1) | 5222954 | 47 | 45 | 11 | 1 | 34 | 7 | 1 | 5 | 0 | 0 | <1.00e-15 | <5.13e-14 | |
| 8 | CITRATE_CYCLE_TCA_CYCLE | ACO1, ACO2, CS, DLD, DLST, DLSTP, FH, IDH1, IDH2, IDH3A, IDH3B, IDH3G, MDH1, MDH2, PC, PCK1, SDHA, SDHA, SDHAL2, SDHB, SUCLA2, SUCLG1, SUCLG2 | 20 | ACO1(1), ACO2(1), DLD(1), IDH1(20), IDH2(20) | 5989303 | 43 | 40 | 7 | 1 | 34 | 4 | 0 | 5 | 0 | 0 | <1.00e-15 | <5.13e-14 | |
| 9 | HSA00020_CITRATE_CYCLE | Genes involved in citrate cycle (TCA cycle) | ACLY, ACO1, ACO2, CLYBL, CS, DLD, DLST, FH, IDH1, IDH2, IDH3A, IDH3B, IDH3G, LOC283398, LOC441996, MDH1, MDH2, OGDH, OGDHL, PC, PCK1, PCK2, SDHA, SDHB, SDHC, SDHD, SUCLA2, SUCLG1, SUCLG2 | 27 | ACO1(1), ACO2(1), DLD(1), IDH1(20), IDH2(20) | 8713812 | 43 | 40 | 7 | 3 | 34 | 4 | 0 | 5 | 0 | 0 | <1.00e-15 | <5.13e-14 |
| 10 | HSA00720_REDUCTIVE_CARBOXYLATE_CYCLE | Genes involved in reductive carboxylate cycle (CO2 fixation) | ACLY, ACO1, ACO2, ACSS1, ACSS2, FH, IDH1, IDH2, LOC441996, MDH1, MDH2, SUCLA2 | 11 | ACO1(1), ACO2(1), IDH1(20), IDH2(20) | 3905972 | 42 | 39 | 6 | 0 | 34 | 3 | 0 | 5 | 0 | 0 | <1.00e-15 | <5.13e-14 |
Table 6. Get Full Table A Ranked List of Significantly Mutated Genesets (Excluding Significantly Mutated Genes). Number of significant genesets found: 0. Number of genesets displayed: 10
| rank | geneset | description | genes | N_genes | mut_tally | N | n | npat | nsite | nsil | n1 | n2 | n3 | n4 | n5 | n6 | p | q |
|---|---|---|---|---|---|---|---|---|---|---|---|---|---|---|---|---|---|---|
| 1 | HSA00480_GLUTATHIONE_METABOLISM | Genes involved in glutathione metabolism | ANPEP, G6PD, GCLC, GCLM, GGT1, GGTL3, GGTL4, GPX1, GPX2, GPX3, GPX4, GPX5, GPX6, GPX7, GSR, GSS, GSTA1, GSTA2, GSTA3, GSTA4, GSTA5, GSTK1, GSTM1, GSTM2, GSTM3, GSTM4, GSTM5, GSTO2, GSTP1, GSTT1, GSTT2, GSTZ1, IDH1, IDH2, MGST1, MGST2, MGST3, OPLAH, TXNDC12 | 32 | G6PD(1), GCLM(1), GPX2(1), GSTK1(2), GSTM3(2), GSTT2(1) | 5342752 | 8 | 8 | 8 | 1 | 1 | 3 | 1 | 3 | 0 | 0 | 0.0068 | 1 |
| 2 | ERBB3PATHWAY | Neuregulins bind to the receptor tyrosine kinases ErbB3 and ErbB4, surface-localized receptors whose overexpression induces tumor formation. | EGF, EGFR, ERBB3, NRG1, UBE2D1 | 5 | EGF(1), EGFR(2), ERBB3(2), UBE2D1(1) | 2995149 | 6 | 6 | 6 | 1 | 1 | 1 | 0 | 3 | 1 | 0 | 0.01 | 1 |
| 3 | ST_P38_MAPK_PATHWAY | p38 is a MAP kinase regulated by cytokines and cellular stress. | AKT1, ATF1, CDC42, CREB1, CREB3, CREB5, DUSP1, DUSP10, EEF2K, EIF4E, ELK1, GADD45A, HSPB1, IL1R1, MAP2K3, MAP2K4, MAP2K6, MAP3K10, MAP3K4, MAP3K5, MAP3K7, MAP3K7IP1, MAP3K7IP2, MAPK1, MAPK11, MAPK12, MAPK13, MAPK14, MAPKAPK2, MAPKAPK5, MKNK1, MKNK2, MYEF2, NFKB1, NR2C2, SRF, TRAF6 | 32 | CDC42(1), DUSP1(1), IL1R1(1), MAP2K3(1), MAP3K4(4), MAPK1(1), MAPKAPK5(1), MKNK1(1), MKNK2(1) | 9238177 | 12 | 11 | 10 | 3 | 4 | 1 | 2 | 1 | 4 | 0 | 0.012 | 1 |
| 4 | HSA05130_PATHOGENIC_ESCHERICHIA_COLI_INFECTION_EHEC | Genes involved in pathogenic Escherichia coli infection - EHEC | ABL1, ACTB, ACTG1, ARHGEF2, ARPC5, ARPC5L, CD14, CDC42, CDH1, CLDN1, CTNNB1, CTTN, EZR, FYN, HCLS1, ITGB1, KRT18, LOC643224, LOC654264, LY96, NCK1, NCK2, NCL, OCLN, PRKCA, RHOA, ROCK1, ROCK2, TLR4, TLR5, TUBA1A, TUBA1B, TUBA1C, TUBA3C, TUBA3D, TUBA3E, TUBA4A, TUBA8, TUBAL3, TUBB, TUBB1, TUBB2A, TUBB2B, TUBB2C, TUBB3, TUBB4, TUBB4Q, TUBB6, TUBB8, WAS, WASL, YWHAQ, YWHAZ | 51 | ABL1(2), CDC42(1), EZR(1), HCLS1(1), LY96(1), TLR4(1), TUBA1A(1), TUBA1B(1), TUBA3C(2), TUBB3(1), TUBB4(1), TUBB6(1), TUBB8(1), YWHAZ(1) | 15524189 | 16 | 16 | 16 | 6 | 4 | 3 | 2 | 6 | 1 | 0 | 0.012 | 1 |
| 5 | HSA05131_PATHOGENIC_ESCHERICHIA_COLI_INFECTION_EPEC | Genes involved in pathogenic Escherichia coli infection - EPEC | ABL1, ACTB, ACTG1, ARHGEF2, ARPC5, ARPC5L, CD14, CDC42, CDH1, CLDN1, CTNNB1, CTTN, EZR, FYN, HCLS1, ITGB1, KRT18, LOC643224, LOC654264, LY96, NCK1, NCK2, NCL, OCLN, PRKCA, RHOA, ROCK1, ROCK2, TLR4, TLR5, TUBA1A, TUBA1B, TUBA1C, TUBA3C, TUBA3D, TUBA3E, TUBA4A, TUBA8, TUBAL3, TUBB, TUBB1, TUBB2A, TUBB2B, TUBB2C, TUBB3, TUBB4, TUBB4Q, TUBB6, TUBB8, WAS, WASL, YWHAQ, YWHAZ | 51 | ABL1(2), CDC42(1), EZR(1), HCLS1(1), LY96(1), TLR4(1), TUBA1A(1), TUBA1B(1), TUBA3C(2), TUBB3(1), TUBB4(1), TUBB6(1), TUBB8(1), YWHAZ(1) | 15524189 | 16 | 16 | 16 | 6 | 4 | 3 | 2 | 6 | 1 | 0 | 0.012 | 1 |
| 6 | GLUTATHIONE_METABOLISM | ANPEP, G6PD, GCLC, GCLM, GGT1, GPX1, GPX2, GPX3, GPX4, GPX5, GSS, GSTA1, GSTA2, GSTA3, GSTA4, GSTM1, GSTM2, GSTM3, GSTM4, GSTM5, GSTO2, GSTP1, GSTT1, GSTT2, GSTZ1, IDH1, IDH2, MGST1, MGST2, MGST3, PGD | 27 | G6PD(1), GCLM(1), GPX2(1), GSTM3(2), GSTT2(1), PGD(1) | 4736200 | 7 | 7 | 7 | 1 | 0 | 4 | 1 | 2 | 0 | 0 | 0.02 | 1 | |
| 7 | HSA04080_NEUROACTIVE_LIGAND_RECEPTOR_INTERACTION | Genes involved in neuroactive ligand-receptor interaction | ADCYAP1R1, ADORA1, ADORA2A, ADORA2B, ADORA3, ADRA1A, ADRA1B, ADRA2A, ADRA2B, ADRA2C, ADRB1, ADRB2, ADRB3, AGTR1, AGTR2, AGTRL1, AVPR1A, AVPR1B, AVPR2, BDKRB1, BDKRB2, BRS3, C3AR1, C5AR1, CALCR, CALCRL, CCKAR, CCKBR, CGA, CHRM1, CHRM2, CHRM3, CHRM4, CHRM5, CNR1, CNR2, CRHR1, CRHR2, CTSG, CYSLTR1, CYSLTR2, DRD1, DRD2, DRD3, DRD4, DRD5, EDG1, EDG2, EDG3, EDG4, EDG5, EDG6, EDG7, EDG8, EDNRA, EDNRB, F2, F2R, F2RL1, F2RL2, F2RL3, FPR1, FPRL1, FPRL2, FSHB, FSHR, GABBR1, GABBR2, GABRA1, GABRA2, GABRA3, GABRA4, GABRA5, GABRA6, GABRB1, GABRB2, GABRB3, GABRD, GABRE, GABRG1, GABRG2, GABRG3, GABRP, GABRQ, GABRR1, GABRR2, GALR1, GALR2, GALR3, GCGR, GH1, GH2, GHR, GHRHR, GHSR, GIPR, GLP1R, GLP2R, GLRA1, GLRA2, GLRA3, GLRB, GNRHR, GPR156, GPR23, GPR35, GPR50, GPR63, GPR83, GRIA1, GRIA2, GRIA3, GRIA4, GRID1, GRID2, GRIK1, GRIK2, GRIK3, GRIK4, GRIK5, GRIN1, GRIN2A, GRIN2B, GRIN2C, GRIN2D, GRIN3A, GRIN3B, GRM1, GRM2, GRM3, GRM4, GRM5, GRM6, GRM7, GRM8, GRPR, GZMA, HCRTR1, HCRTR2, HRH1, HRH2, HRH3, HRH4, HTR1A, HTR1B, HTR1D, HTR1E, HTR1F, HTR2A, HTR2B, HTR2C, HTR4, HTR5A, HTR6, HTR7, KISS1R, LEP, LEPR, LHB, LHCGR, LTB4R, LTB4R2, MAS1, MC1R, MC2R, MC3R, MC4R, MC5R, MCHR1, MCHR2, MLNR, MTNR1A, MTNR1B, NMBR, NMUR1, NMUR2, NPBWR1, NPBWR2, NPFFR1, NPFFR2, NPY1R, NPY2R, NPY5R, NR3C1, NTSR1, NTSR2, OPRD1, OPRK1, OPRL1, OPRM1, OXTR, P2RX1, P2RX2, P2RX3, P2RX4, P2RX5, P2RX7, P2RXL1, P2RY1, P2RY10, P2RY11, P2RY13, P2RY14, P2RY2, P2RY4, P2RY5, P2RY6, P2RY8, PARD3, PPYR1, PRL, PRLHR, PRLR, PRSS1, PRSS2, PRSS3, PTAFR, PTGDR, PTGER1, PTGER2, PTGER3, PTGER4, PTGFR, PTGIR, PTH2R, PTHR1, RXFP1, RXFP2, SCTR, SSTR1, SSTR2, SSTR3, SSTR4, SSTR5, TAAR1, TAAR2, TAAR5, TAAR6, TAAR8, TAAR9, TACR1, TACR2, TACR3, TBXA2R, THRA, THRB, TRHR, TRPV1, TSHB, TSHR, TSPO, UTS2R, VIPR1, VIPR2 | 220 | ADRA1A(1), BRS3(1), C5AR1(1), CRHR2(1), CTSG(1), DRD2(1), F2RL1(1), GABBR1(1), GABRA4(1), GABRB1(1), GABRG2(1), GABRR1(1), GHR(1), GLRA1(1), GNRHR(1), GPR156(1), GPR50(1), GRID1(2), GRIK2(3), GRIK3(2), GRIK4(3), GRIK5(1), GRIN3A(1), GRM3(2), GRM5(1), GRM6(2), GRM8(2), HTR5A(1), MCHR2(1), NMUR2(3), NTSR2(1), OPRM1(1), P2RX7(1), P2RY1(1), P2RY2(2), PARD3(1), PRSS3(1), SCTR(1), SSTR4(1), THRA(1), THRB(1), VIPR1(2) | 60973003 | 55 | 41 | 55 | 16 | 18 | 18 | 3 | 13 | 3 | 0 | 0.021 | 1 |
| 8 | ERKPATHWAY | Cell growth is promoted by Ras activation of the anti-apoptotic p44/42 MAP kinase pathway. | DPM2, EGFR, ELK1, GNAS, GNB1, GNGT1, GRB2, HRAS, IGF1R, ITGB1, KLK2, MAP2K1, MAP2K2, MAPK1, MAPK3, MKNK1, MKNK2, MYC, NGFB, NGFR, PDGFRA, PPP2CA, PTPRR, RAF1, RPS6KA1, RPS6KA5, SHC1, SOS1, SRC, STAT3 | 28 | EGFR(2), GNB1(1), MAPK1(1), MKNK1(1), MKNK2(1), MYC(1), PDGFRA(1), RPS6KA1(1), SHC1(1), SOS1(1) | 9152408 | 11 | 10 | 11 | 3 | 3 | 3 | 0 | 4 | 1 | 0 | 0.035 | 1 |
| 9 | ARFPATHWAY | Cyclin-dependent kinase inhibitor 2A is a tumor suppressor that induces G1 arrest and can activate the p53 pathway, leading to G2/M arrest. | ABL1, CDKN2A, E2F1, MDM2, MYC, PIK3CA, PIK3R1, POLR1A, POLR1B, POLR1C, POLR1D, RAC1, RB1, TBX2, TP53, TWIST1 | 14 | ABL1(2), MDM2(1), MYC(1), POLR1A(2), POLR1B(1) | 5574587 | 7 | 7 | 7 | 1 | 2 | 1 | 1 | 2 | 1 | 0 | 0.044 | 1 |
| 10 | HSA00980_METABOLISM_OF_XENOBIOTICS_BY_CYTOCHROME_P450 | Genes involved in metabolism of xenobiotics by cytochrome P450 | ADH1A, ADH1B, ADH1C, ADH4, ADH5, ADH6, ADH7, ADHFE1, AKR1C1, AKR1C2, AKR1C3, AKR1C4, ALDH1A3, ALDH3A1, ALDH3B1, ALDH3B2, CYP1A1, CYP1A2, CYP1B1, CYP2B6, CYP2C18, CYP2C19, CYP2C8, CYP2C9, CYP2E1, CYP2F1, CYP2S1, CYP3A4, CYP3A43, CYP3A5, CYP3A7, DHDH, EPHX1, GSTA1, GSTA2, GSTA3, GSTA4, GSTA5, GSTK1, GSTM1, GSTM2, GSTM3, GSTM4, GSTM5, GSTO2, GSTP1, GSTT1, GSTT2, GSTZ1, MGST1, MGST2, MGST3, UGT1A1, UGT1A10, UGT1A3, UGT1A4, UGT1A5, UGT1A6, UGT1A7, UGT1A8, UGT1A9, UGT2A1, UGT2A3, UGT2B10, UGT2B11, UGT2B15, UGT2B17, UGT2B28, UGT2B4, UGT2B7 | 69 | ADH1C(1), ADHFE1(1), ALDH1A3(1), CYP1A2(1), GSTK1(2), GSTM3(2), GSTT2(1), UGT1A10(1), UGT2A3(1), UGT2B28(1), UGT2B4(1) | 16213525 | 13 | 13 | 13 | 6 | 5 | 4 | 1 | 2 | 1 | 0 | 0.045 | 1 |
In brief, we tabulate the number of mutations and the number of covered bases for each gene. The counts are broken down by mutation context category: four context categories that are discovered by MutSig, and one for indel and 'null' mutations, which include indels, nonsense mutations, splice-site mutations, and non-stop (read-through) mutations. For each gene, we calculate the probability of seeing the observed constellation of mutations, i.e. the product P1 x P2 x ... x Pm, or a more extreme one, given the background mutation rates calculated across the dataset. [1]
This is an experimental feature. The full results of the analysis summarized in this report can be downloaded from the TCGA Data Coordination Center.