This pipeline uses various statistical tests to identify genes whose promoter methylation levels correlated to selected clinical features.
Testing the association between 17428 genes and 7 clinical features across 42 samples, statistically thresholded by Q value < 0.05, 3 clinical features related to at least one genes.
-
3 genes correlated to 'AGE'.
-
HOXD8 , KCNK17 , BARHL2
-
2 genes correlated to 'GENDER'.
-
UTP14C , ACSM1
-
26 genes correlated to 'HISTOLOGICAL.TYPE'.
-
ZNF362 , SLMO1 , SLC16A1 , C1ORF50 , BVES , ...
-
No genes correlated to 'Time to Death', 'KARNOFSKY.PERFORMANCE.SCORE', 'RADIATIONS.RADIATION.REGIMENINDICATION', and 'NEOADJUVANT.THERAPY'.
Complete statistical result table is provided in Supplement Table 1
Table 1. Get Full Table This table shows the clinical features, statistical methods used, and the number of genes that are significantly associated with each clinical feature at Q value < 0.05.
| Clinical feature | Statistical test | Significant genes | Associated with | Associated with | ||
|---|---|---|---|---|---|---|
| Time to Death | Cox regression test | N=0 | ||||
| AGE | Spearman correlation test | N=3 | older | N=3 | younger | N=0 |
| GENDER | t test | N=2 | male | N=1 | female | N=1 |
| KARNOFSKY PERFORMANCE SCORE | Spearman correlation test | N=0 | ||||
| HISTOLOGICAL TYPE | ANOVA test | N=26 | ||||
| RADIATIONS RADIATION REGIMENINDICATION | t test | N=0 | ||||
| NEOADJUVANT THERAPY | t test | N=0 |
Table S1. Basic characteristics of clinical feature: 'Time to Death'
| Time to Death | Duration (Months) | 1.2-211.2 (median=36) |
| censored | N = 23 | |
| death | N = 19 | |
| Significant markers | N = 0 |
Table S2. Basic characteristics of clinical feature: 'AGE'
| AGE | Mean (SD) | 43 (12) |
| Significant markers | N = 3 | |
| pos. correlated | 3 | |
| neg. correlated | 0 |
Table S3. Get Full Table List of 3 genes significantly correlated to 'AGE' by Spearman correlation test
| SpearmanCorr | corrP | Q | |
|---|---|---|---|
| HOXD8 | 0.7005 | 2.413e-07 | 0.00421 |
| KCNK17 | 0.6679 | 1.347e-06 | 0.0235 |
| BARHL2 | 0.6546 | 2.565e-06 | 0.0447 |
Figure S1. Get High-res Image As an example, this figure shows the association of HOXD8 to 'AGE'. P value = 2.41e-07 with Spearman correlation analysis. The straight line presents the best linear regression.
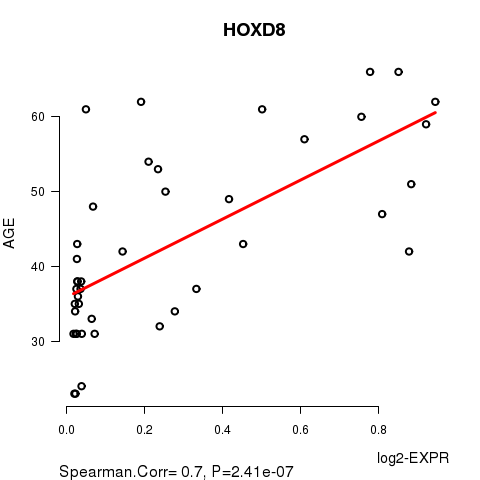
Table S4. Basic characteristics of clinical feature: 'GENDER'
| GENDER | Labels | N |
| FEMALE | 24 | |
| MALE | 18 | |
| Significant markers | N = 2 | |
| Higher in MALE | 1 | |
| Higher in FEMALE | 1 |
Table S5. Get Full Table List of 2 genes differentially expressed by 'GENDER'
| T(pos if higher in 'MALE') | ttestP | Q | AUC | |
|---|---|---|---|---|
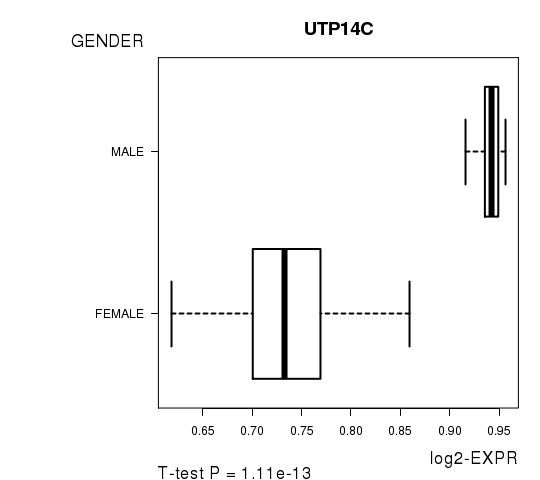
| UTP14C | 11.26 | 1.11e-13 | 1.93e-09 | 0.9884 |
| ACSM1 | -7.23 | 1.34e-08 | 0.000233 | 0.9236 |
Figure S2. Get High-res Image As an example, this figure shows the association of UTP14C to 'GENDER'. P value = 1.11e-13 with T-test analysis.
No gene related to 'KARNOFSKY.PERFORMANCE.SCORE'.
Table S6. Basic characteristics of clinical feature: 'KARNOFSKY.PERFORMANCE.SCORE'
| KARNOFSKY.PERFORMANCE.SCORE | Mean (SD) | 89.6 (11) |
| Score | N | |
| 50 | 1 | |
| 70 | 1 | |
| 80 | 3 | |
| 90 | 12 | |
| 100 | 8 | |
| Significant markers | N = 0 |
Table S7. Basic characteristics of clinical feature: 'HISTOLOGICAL.TYPE'
| HISTOLOGICAL.TYPE | Labels | N |
| ASTROCYTOMA | 12 | |
| OLIGOASTROCYTOMA | 14 | |
| OLIGODENDROGLIOMA | 16 | |
| Significant markers | N = 26 |
Table S8. Get Full Table List of top 10 genes differentially expressed by 'HISTOLOGICAL.TYPE'
| ANOVA_P | Q | |
|---|---|---|
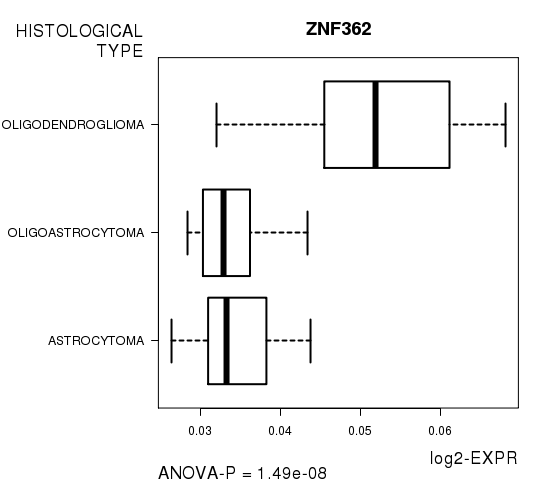
| ZNF362 | 1.488e-08 | 0.000259 |
| SLMO1 | 2.821e-08 | 0.000492 |
| SLC16A1 | 6.191e-08 | 0.00108 |
| C1ORF50 | 6.422e-08 | 0.00112 |
| BVES | 7.141e-08 | 0.00124 |
| NRD1 | 1.397e-07 | 0.00243 |
| XRCC1 | 2.205e-07 | 0.00384 |
| PAFAH1B3 | 2.363e-07 | 0.00412 |
| ZNF227 | 3.138e-07 | 0.00547 |
| ZNF790 | 4.008e-07 | 0.00698 |
Figure S3. Get High-res Image As an example, this figure shows the association of ZNF362 to 'HISTOLOGICAL.TYPE'. P value = 1.49e-08 with ANOVA analysis.
No gene related to 'RADIATIONS.RADIATION.REGIMENINDICATION'.
Table S9. Basic characteristics of clinical feature: 'RADIATIONS.RADIATION.REGIMENINDICATION'
| RADIATIONS.RADIATION.REGIMENINDICATION | Labels | N |
| NO | 30 | |
| YES | 12 | |
| Significant markers | N = 0 |
-
Expresson data file = LGG.meth.for_correlation.filtered_data.txt
-
Clinical data file = LGG.clin.merged.picked.txt
-
Number of patients = 42
-
Number of genes = 17428
-
Number of clinical features = 7
For survival clinical features, Wald's test in univariate Cox regression analysis with proportional hazards model (Andersen and Gill 1982) was used to estimate the P values using the 'coxph' function in R. Kaplan-Meier survival curves were plot using the four quartile subgroups of patients based on expression levels
For continuous numerical clinical features, Spearman's rank correlation coefficients (Spearman 1904) and two-tailed P values were estimated using 'cor.test' function in R
For two-class clinical features, two-tailed Student's t test with unequal variance (Lehmann and Romano 2005) was applied to compare the log2-expression levels between the two clinical classes using 't.test' function in R
For multi-class clinical features (ordinal or nominal), one-way analysis of variance (Howell 2002) was applied to compare the log2-expression levels between different clinical classes using 'anova' function in R
For multiple hypothesis correction, Q value is the False Discovery Rate (FDR) analogue of the P value (Benjamini and Hochberg 1995), defined as the minimum FDR at which the test may be called significant. We used the 'Benjamini and Hochberg' method of 'p.adjust' function in R to convert P values into Q values.
This is an experimental feature. The full results of the analysis summarized in this report can be downloaded from the TCGA Data Coordination Center.