This pipeline uses various statistical tests to identify miRs whose expression levels correlated to selected clinical features.
Testing the association between 555 genes and 7 clinical features across 67 samples, statistically thresholded by Q value < 0.05, 3 clinical features related to at least one genes.
-
2 genes correlated to 'Time to Death'.
-
HSA-MIR-346 , HSA-MIR-10A
-
4 genes correlated to 'HISTOLOGICAL.TYPE'.
-
HSA-MIR-2114 , HSA-MIR-708 , HSA-MIR-23B , HSA-MIR-1226
-
1 gene correlated to 'RADIATIONS.RADIATION.REGIMENINDICATION'.
-
HSA-MIR-1250
-
No genes correlated to 'AGE', 'GENDER', 'KARNOFSKY.PERFORMANCE.SCORE', and 'NEOADJUVANT.THERAPY'.
Complete statistical result table is provided in Supplement Table 1
Table 1. Get Full Table This table shows the clinical features, statistical methods used, and the number of genes that are significantly associated with each clinical feature at Q value < 0.05.
| Clinical feature | Statistical test | Significant genes | Associated with | Associated with | ||
|---|---|---|---|---|---|---|
| Time to Death | Cox regression test | N=2 | shorter survival | N=1 | longer survival | N=1 |
| AGE | Spearman correlation test | N=0 | ||||
| GENDER | t test | N=0 | ||||
| KARNOFSKY PERFORMANCE SCORE | Spearman correlation test | N=0 | ||||
| HISTOLOGICAL TYPE | ANOVA test | N=4 | ||||
| RADIATIONS RADIATION REGIMENINDICATION | t test | N=1 | yes | N=0 | no | N=1 |
| NEOADJUVANT THERAPY | t test | N=0 |
Table S1. Basic characteristics of clinical feature: 'Time to Death'
| Time to Death | Duration (Months) | 0.1-211.2 (median=23.8) |
| censored | N = 40 | |
| death | N = 27 | |
| Significant markers | N = 2 | |
| associated with shorter survival | 1 | |
| associated with longer survival | 1 |
Table S2. Get Full Table List of 2 genes significantly associated with 'Time to Death' by Cox regression test
| HazardRatio | Wald_P | Q | C_index | |
|---|---|---|---|---|
| HSA-MIR-346 | 0.45 | 4.004e-06 | 0.0022 | 0.213 |
| HSA-MIR-10A | 1.51 | 4.631e-05 | 0.026 | 0.738 |
Figure S1. Get High-res Image As an example, this figure shows the association of HSA-MIR-346 to 'Time to Death'. four curves present the cumulative survival rates of 4 quartile subsets of patients. P value = 4e-06 with univariate Cox regression analysis using continuous log-2 expression values.
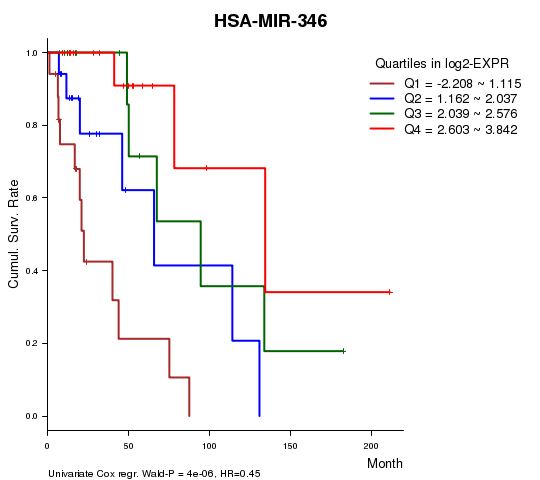
Table S3. Basic characteristics of clinical feature: 'AGE'
| AGE | Mean (SD) | 43.12 (12) |
| Significant markers | N = 0 |
Table S4. Basic characteristics of clinical feature: 'GENDER'
| GENDER | Labels | N |
| FEMALE | 33 | |
| MALE | 34 | |
| Significant markers | N = 0 |
No gene related to 'KARNOFSKY.PERFORMANCE.SCORE'.
Table S5. Basic characteristics of clinical feature: 'KARNOFSKY.PERFORMANCE.SCORE'
| KARNOFSKY.PERFORMANCE.SCORE | Mean (SD) | 89.76 (9.6) |
| Score | N | |
| 50 | 1 | |
| 70 | 1 | |
| 80 | 6 | |
| 90 | 22 | |
| 100 | 11 | |
| Significant markers | N = 0 |
Table S6. Basic characteristics of clinical feature: 'HISTOLOGICAL.TYPE'
| HISTOLOGICAL.TYPE | Labels | N |
| ASTROCYTOMA | 24 | |
| OLIGOASTROCYTOMA | 20 | |
| OLIGODENDROGLIOMA | 23 | |
| Significant markers | N = 4 |
Table S7. Get Full Table List of 4 genes differentially expressed by 'HISTOLOGICAL.TYPE'
| ANOVA_P | Q | |
|---|---|---|
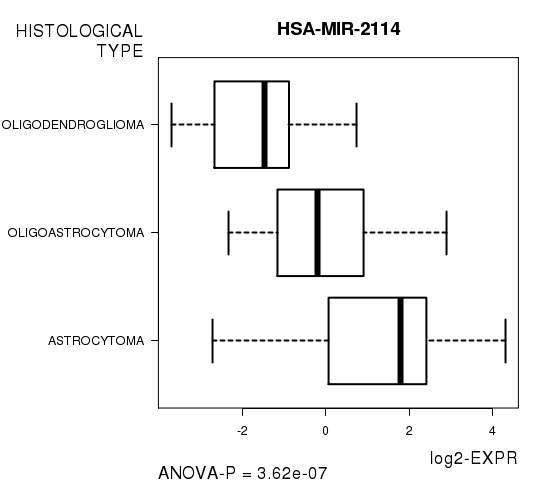
| HSA-MIR-2114 | 3.621e-07 | 0.000201 |
| HSA-MIR-708 | 3.464e-06 | 0.00192 |
| HSA-MIR-23B | 3.715e-05 | 0.0205 |
| HSA-MIR-1226 | 4.824e-05 | 0.0266 |
Figure S2. Get High-res Image As an example, this figure shows the association of HSA-MIR-2114 to 'HISTOLOGICAL.TYPE'. P value = 3.62e-07 with ANOVA analysis.
One gene related to 'RADIATIONS.RADIATION.REGIMENINDICATION'.
Table S8. Basic characteristics of clinical feature: 'RADIATIONS.RADIATION.REGIMENINDICATION'
| RADIATIONS.RADIATION.REGIMENINDICATION | Labels | N |
| NO | 48 | |
| YES | 19 | |
| Significant markers | N = 1 | |
| Higher in YES | 0 | |
| Higher in NO | 1 |
Table S9. Get Full Table List of one gene differentially expressed by 'RADIATIONS.RADIATION.REGIMENINDICATION'
| T(pos if higher in 'YES') | ttestP | Q | AUC | |
|---|---|---|---|---|
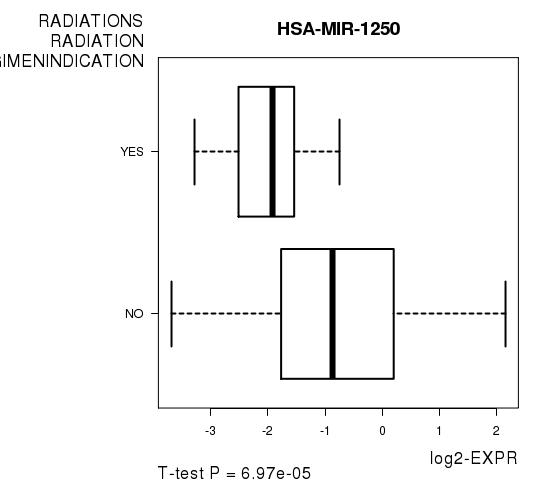
| HSA-MIR-1250 | -4.32 | 6.972e-05 | 0.0387 | 0.7792 |
Figure S3. Get High-res Image As an example, this figure shows the association of HSA-MIR-1250 to 'RADIATIONS.RADIATION.REGIMENINDICATION'. P value = 6.97e-05 with T-test analysis.
-
Expresson data file = LGG.miRseq_RPKM_log2.txt
-
Clinical data file = LGG.clin.merged.picked.txt
-
Number of patients = 67
-
Number of genes = 555
-
Number of clinical features = 7
For survival clinical features, Wald's test in univariate Cox regression analysis with proportional hazards model (Andersen and Gill 1982) was used to estimate the P values using the 'coxph' function in R. Kaplan-Meier survival curves were plot using the four quartile subgroups of patients based on expression levels
For continuous numerical clinical features, Spearman's rank correlation coefficients (Spearman 1904) and two-tailed P values were estimated using 'cor.test' function in R
For two-class clinical features, two-tailed Student's t test with unequal variance (Lehmann and Romano 2005) was applied to compare the log2-expression levels between the two clinical classes using 't.test' function in R
For multi-class clinical features (ordinal or nominal), one-way analysis of variance (Howell 2002) was applied to compare the log2-expression levels between different clinical classes using 'anova' function in R
For multiple hypothesis correction, Q value is the False Discovery Rate (FDR) analogue of the P value (Benjamini and Hochberg 1995), defined as the minimum FDR at which the test may be called significant. We used the 'Benjamini and Hochberg' method of 'p.adjust' function in R to convert P values into Q values.
This is an experimental feature. The full results of the analysis summarized in this report can be downloaded from the TCGA Data Coordination Center.