The role of general epigenetic mechanisms in carcinogenesis and tumor aggressiveness is well documented: CpG island hyper-methylation silences tumor suppressor genes, whereas hypo-methylation promotes the transcriptional activation of oncogenes and induces chromosomal instability. This pipeline calculates and identifies correlations between DNA methylation and gene expression profiles using the available array technologies.
The top 25 correlated methylation probes per gene are displayed. Total number of matched samples = 44. Number of gene expression samples = 47. Number of methylation samples = 44.
Figure 1. Histogram of methylation correlation values. n is the number of matched samples between Level 3 CpG site methylation and Level 3 gene expression arrays. Number of Matched Samples = 44
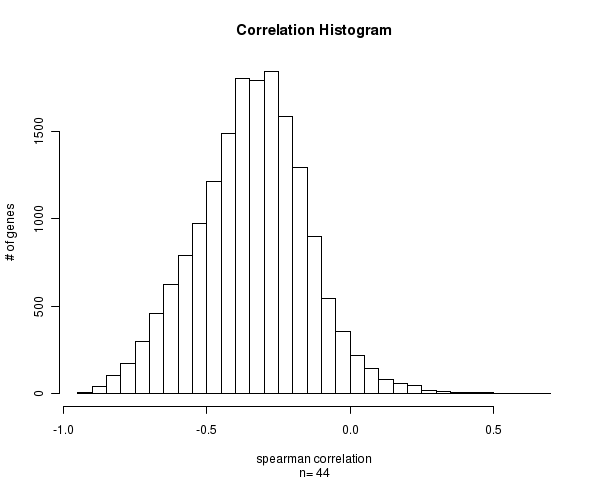
Figure 2. Plot 1. The estimated pi_0 versus the tuning parameter lambda. Plot 2. The q-values versus the p-values. Plot 3. The number of significant tests versus each q-value cutoff. Plot 4. The number of expected false positives versus the number of significant tests.The first is a plot of the estimate of pi_0 versus its tuning parameter lambda. In most cases, as lambda gets larger, the bias of the estimate decreases, yet the variance increases. Comparing your estimate of pi_0 to this plot allows one to guage its quality. The remaining three plots show how many tests are significant, as well as how many false positives to expect for each q-value cut-off.
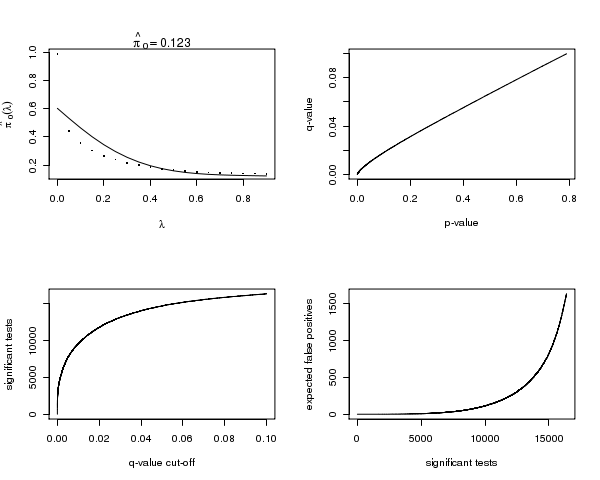
Table 1. Get Full Table Top 25 most negatively correlated methylation probes. Correlation Coefficient: See Methods & Data below. Pval and Qval: P- and Q-values of the correlation coefficient. Expression Mean: mean detection level of gene expression probes. Methylation Mean: mean detection level of CpG methylation probes.
| Meth_Probe | Gene | Chrom | Position | Corr_Coeff | Pval | Qval | Expr_Mean | Meth_Mean |
|---|---|---|---|---|---|---|---|---|
| cg11763394 | LOC654433 | 2 | 113709392 | -0.94 | 0 | 0 | NA | 0.863358 |
| cg21550016 | PAX8 | 2 | 113709401 | -0.93 | 0 | 0 | NA | 0.854498 |
| cg07326438 | SLC43A3 | 11 | 56951138 | -0.92 | 0 | 0 | 8.1731 | 0.502720 |
| cg05804949 | C7orf46 | 7 | 23686145 | -0.92 | 0 | 0 | 6.1555 | 0.521194 |
| cg00056767 | CCDC122 | 13 | 43351183 | -0.91 | 0 | 0 | 3.3319 | 0.531428 |
| cg02304092 | FLJ44606 | 5 | 126437126 | -0.91 | 0 | 0 | 3.7713 | 0.451545 |
| cg05491852 | KIAA0495 | 1 | 3653692 | -0.9 | 0 | 0 | 7.5776 | 0.479399 |
| cg09684846 | FAM18A | 16 | 10820219 | -0.9 | 0 | 0 | 6.9494 | 0.475293 |
| cg19775206 | C14orf86 | 14 | 93463471 | -0.9 | 0 | 0 | NA | 0.723781 |
| cg09721739 | NMNAT3 | 3 | 140879614 | -0.89 | 0 | 0 | 6.0440 | 0.506889 |
| cg12835949 | SSH3 | 11 | 66827322 | -0.89 | 0 | 0 | 6.9177 | 0.544501 |
| cg10859966 | KHNYN | 14 | 23968832 | -0.89 | 0 | 0 | 8.4136 | 0.643058 |
| cg11501236 | LOC134466 | 5 | 150306271 | -0.89 | 0 | 0 | 5.9570 | 0.161711 |
| cg11166108 | LDHA | 11 | 18373343 | -0.89 | 0 | 0 | 11.2885 | 0.367834 |
| cg02407048 | PION | 7 | 76884070 | -0.89 | 0 | 0 | 6.4045 | 0.690239 |
| cg05968601 | PGCP | 8 | 97726435 | -0.89 | 0 | 0 | 7.8279 | 0.603080 |
| cg27240008 | MBP | 18 | 72857822 | -0.89 | 0 | 0 | 14.0269 | 0.859782 |
| cg00948524 | RNF135 | 17 | 26321883 | -0.89 | 0 | 0 | 7.2913 | 0.512254 |
| cg00420361 | ZDHHC1 | 16 | 66007438 | -0.89 | 0 | 0 | 6.6357 | 0.372478 |
| cg20414098 | SLC25A45 | 11 | 64906735 | -0.89 | 0 | 0 | 5.2437 | 0.582316 |
| cg03208951 | EMP3 | 19 | 53520647 | -0.88 | 0 | 0 | 6.9199 | 0.597103 |
| cg03452174 | RAB34 | 17 | 24069240 | -0.88 | 0 | 0 | 7.5914 | 0.644889 |
| cg05941778 | DUSP10 | 1 | 219980199 | -0.88 | 0 | 0 | 6.8869 | 0.750071 |
| cg27394566 | PLD4 | 14 | 104462680 | -0.88 | 0 | 0 | 8.7889 | 0.787839 |
| cg16662267 | CBR1 | 21 | 36364629 | -0.88 | 0 | 0 | 9.8580 | 0.506861 |
| cg23257225 | ADORA1 | 1 | 201389767 | -0.87 | 0 | 0 | 9.8912 | 0.747887 |
Methylation Array Platforms: Illumina Infinium HumanMethylation27, Illumina DNA Methylation OMA002, Illumina DNA Methylation OMA003
-
methylation file = /xchip/cga/gdac-prod/tcga-gdac/jobResults/GDAC_MethylationPreprocess/LGG/1841501/0.GDAC_MethylationPreprocess.Finished/LGG.meth.for_correlation.filtered_data.txt
Gene Expression Platforms: Agilent 244K Gene Expression G4502A-07-1, Agilent 244K Gene Expression G4502A-07-2, Agilent 244K Gene Expression G4502A-07-3, Affymetrix Human Exon 1.0 ST Array, Affymetrix HT Human Genome U133 Array
-
gene expression file = /xchip/cga/gdac-prod/tcga-gdac/jobResults/mRNAseq_preprocessor/LGG/1768792/0.mRNAseq_preprocessor.Finished/LGG.uncv2.mRNAseq_RSEM_normalized_log2.txt
Level 3 methylation and gene expression arrays were paired on the basis of Entrez Gene ID concordance. The association between CpG site methylation and the level of expression of the corresponding genes was determined by calculating a correlation measure between the two platforms.
-
correlation measure = Spearman
This is an experimental feature. The full results of the analysis summarized in this report can be downloaded from the TCGA Data Coordination Center.