This pipeline uses various statistical tests to identify genes whose promoter methylation levels correlated to selected clinical features.
Testing the association between 12215 genes and 5 clinical features across 296 samples, statistically thresholded by Q value < 0.05, 2 clinical features related to at least one genes.
-
1 gene correlated to 'Time to Death'.
-
NOL3
-
12 genes correlated to 'AGE'.
-
SDR16C5 , KCNIP1 , PDZK1 , ATP2B2 , ITGBL1 , ...
-
No genes correlated to 'KARNOFSKY.PERFORMANCE.SCORE', 'TUMOR.STAGE', and 'NEOADJUVANT.THERAPY'.
Complete statistical result table is provided in Supplement Table 1
Table 1. Get Full Table This table shows the clinical features, statistical methods used, and the number of genes that are significantly associated with each clinical feature at Q value < 0.05.
| Clinical feature | Statistical test | Significant genes | Associated with | Associated with | ||
|---|---|---|---|---|---|---|
| Time to Death | Cox regression test | N=1 | shorter survival | N=0 | longer survival | N=1 |
| AGE | Spearman correlation test | N=12 | older | N=1 | younger | N=11 |
| KARNOFSKY PERFORMANCE SCORE | Spearman correlation test | N=0 | ||||
| TUMOR STAGE | Spearman correlation test | N=0 | ||||
| NEOADJUVANT THERAPY | t test | N=0 |
Table S1. Basic characteristics of clinical feature: 'Time to Death'
| Time to Death | Duration (Months) | 0.3-180.2 (median=28.3) |
| censored | N = 125 | |
| death | N = 169 | |
| Significant markers | N = 1 | |
| associated with shorter survival | 0 | |
| associated with longer survival | 1 |
Table S2. Get Full Table List of one gene significantly associated with 'Time to Death' by Cox regression test
| HazardRatio | Wald_P | Q | C_index | |
|---|---|---|---|---|
| NOL3 | 0.02 | 3.794e-06 | 0.046 | 0.412 |
Figure S1. Get High-res Image As an example, this figure shows the association of NOL3 to 'Time to Death'. four curves present the cumulative survival rates of 4 quartile subsets of patients. P value = 3.79e-06 with univariate Cox regression analysis using continuous log-2 expression values.

Table S3. Basic characteristics of clinical feature: 'AGE'
| AGE | Mean (SD) | 59.17 (11) |
| Significant markers | N = 12 | |
| pos. correlated | 1 | |
| neg. correlated | 11 |
Table S4. Get Full Table List of top 10 genes significantly correlated to 'AGE' by Spearman correlation test
| SpearmanCorr | corrP | Q | |
|---|---|---|---|
| SDR16C5 | -0.323 | 2.035e-08 | 0.000249 |
| KCNIP1 | -0.3053 | 1.259e-07 | 0.00154 |
| PDZK1 | -0.2867 | 7.455e-07 | 0.00911 |
| ATP2B2 | -0.2838 | 9.742e-07 | 0.0119 |
| ITGBL1 | -0.2833 | 1.021e-06 | 0.0125 |
| NRM | -0.2821 | 1.137e-06 | 0.0139 |
| GRM2 | -0.2816 | 1.194e-06 | 0.0146 |
| IL12RB2 | -0.2783 | 1.603e-06 | 0.0196 |
| PCDHGB7 | 0.2773 | 1.753e-06 | 0.0214 |
| PDE4A | -0.2726 | 2.655e-06 | 0.0324 |
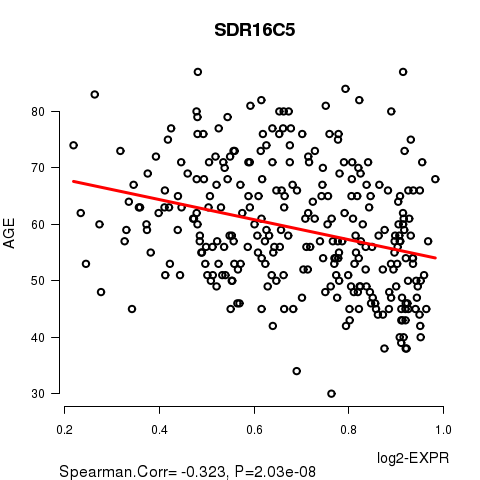
Figure S2. Get High-res Image As an example, this figure shows the association of SDR16C5 to 'AGE'. P value = 2.03e-08 with Spearman correlation analysis. The straight line presents the best linear regression.
No gene related to 'KARNOFSKY.PERFORMANCE.SCORE'.
Table S5. Basic characteristics of clinical feature: 'KARNOFSKY.PERFORMANCE.SCORE'
| KARNOFSKY.PERFORMANCE.SCORE | Mean (SD) | 76 (14) |
| Score | N | |
| 60 | 5 | |
| 80 | 8 | |
| 100 | 2 | |
| Significant markers | N = 0 |
Table S6. Basic characteristics of clinical feature: 'TUMOR.STAGE'
| TUMOR.STAGE | Mean (SD) | 3.06 (0.42) |
| N | ||
| Stage 2 | 18 | |
| Stage 3 | 240 | |
| Stage 4 | 36 | |
| Significant markers | N = 0 |
-
Expresson data file = OV.meth.for_correlation.filtered_data.txt
-
Clinical data file = OV.clin.merged.picked.txt
-
Number of patients = 296
-
Number of genes = 12215
-
Number of clinical features = 5
For survival clinical features, Wald's test in univariate Cox regression analysis with proportional hazards model (Andersen and Gill 1982) was used to estimate the P values using the 'coxph' function in R. Kaplan-Meier survival curves were plot using the four quartile subgroups of patients based on expression levels
For continuous numerical clinical features, Spearman's rank correlation coefficients (Spearman 1904) and two-tailed P values were estimated using 'cor.test' function in R
For two-class clinical features, two-tailed Student's t test with unequal variance (Lehmann and Romano 2005) was applied to compare the log2-expression levels between the two clinical classes using 't.test' function in R
For multiple hypothesis correction, Q value is the False Discovery Rate (FDR) analogue of the P value (Benjamini and Hochberg 1995), defined as the minimum FDR at which the test may be called significant. We used the 'Benjamini and Hochberg' method of 'p.adjust' function in R to convert P values into Q values.
This is an experimental feature. The full results of the analysis summarized in this report can be downloaded from the TCGA Data Coordination Center.