This pipeline computes the correlation between significant arm-level copy number variations (cnvs) and selected clinical features.
Testing the association between copy number variation 20 arm-level results and 4 clinical features across 123 patients, 2 significant findings detected with Q value < 0.25.
-
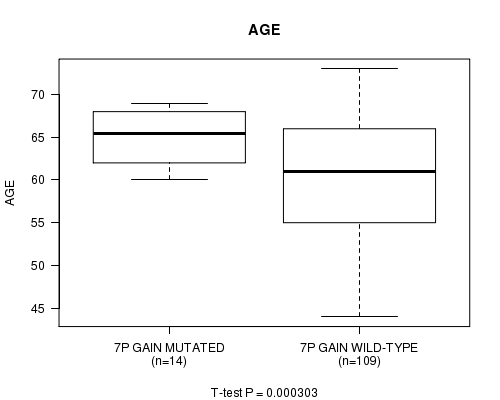
7p gain cnv correlated to 'AGE'.
-
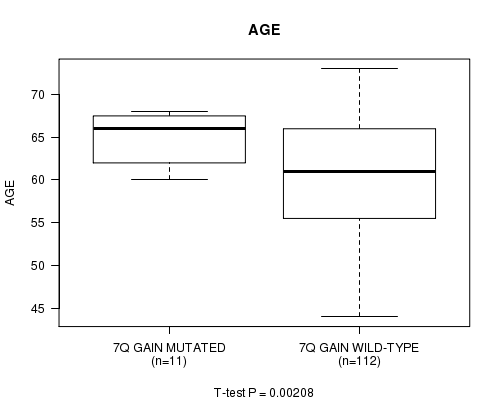
7q gain cnv correlated to 'AGE'.
Table 1. Get Full Table Overview of the association between significant copy number variation of 20 arm-level results and 4 clinical features. Shown in the table are P values (Q values). Thresholded by Q value < 0.25, 2 significant findings detected.
|
Clinical Features |
Time to Death |
AGE |
RADIATIONS RADIATION REGIMENINDICATION |
NEOADJUVANT THERAPY |
||
| nCNV (%) | nWild-Type | logrank test | t-test | Fisher's exact test | Fisher's exact test | |
| 7p gain | 14 (11%) | 109 |
1 (1.00) |
0.000303 (0.0242) |
1 (1.00) |
0.0635 (1.00) |
| 7q gain | 11 (9%) | 112 |
1 (1.00) |
0.00208 (0.164) |
1 (1.00) |
0.316 (1.00) |
| 1q gain | 4 (3%) | 119 |
1 (1.00) |
0.439 (1.00) |
1 (1.00) |
1 (1.00) |
| 3p gain | 5 (4%) | 118 |
1 (1.00) |
0.681 (1.00) |
1 (1.00) |
1 (1.00) |
| 3q gain | 7 (6%) | 116 |
1 (1.00) |
0.965 (1.00) |
1 (1.00) |
0.211 (1.00) |
| 8p gain | 4 (3%) | 119 |
1 (1.00) |
0.501 (1.00) |
1 (1.00) |
1 (1.00) |
| 8q gain | 11 (9%) | 112 |
1 (1.00) |
0.345 (1.00) |
1 (1.00) |
0.316 (1.00) |
| 9q gain | 3 (2%) | 120 |
1 (1.00) |
0.352 (1.00) |
1 (1.00) |
1 (1.00) |
| 6q loss | 5 (4%) | 118 |
1 (1.00) |
0.265 (1.00) |
1 (1.00) |
1 (1.00) |
| 8p loss | 36 (29%) | 87 |
1 (1.00) |
0.215 (1.00) |
0.32 (1.00) |
0.58 (1.00) |
| 8q loss | 4 (3%) | 119 |
1 (1.00) |
0.475 (1.00) |
1 (1.00) |
1 (1.00) |
| 10p loss | 3 (2%) | 120 |
1 (1.00) |
0.0488 (1.00) |
1 (1.00) |
0.0952 (1.00) |
| 12p loss | 5 (4%) | 118 |
1 (1.00) |
0.987 (1.00) |
1 (1.00) |
1 (1.00) |
| 13q loss | 9 (7%) | 114 |
1 (1.00) |
0.853 (1.00) |
1 (1.00) |
0.265 (1.00) |
| 16q loss | 14 (11%) | 109 |
1 (1.00) |
0.085 (1.00) |
1 (1.00) |
0.0635 (1.00) |
| 17p loss | 14 (11%) | 109 |
1 (1.00) |
0.542 (1.00) |
1 (1.00) |
1 (1.00) |
| 18p loss | 10 (8%) | 113 |
1 (1.00) |
0.928 (1.00) |
1 (1.00) |
0.291 (1.00) |
| 18q loss | 15 (12%) | 108 |
1 (1.00) |
0.714 (1.00) |
1 (1.00) |
0.41 (1.00) |
| 20p loss | 4 (3%) | 119 |
1 (1.00) |
0.676 (1.00) |
0.155 (1.00) |
1 (1.00) |
| 22q loss | 5 (4%) | 118 |
1 (1.00) |
0.406 (1.00) |
0.19 (1.00) |
1 (1.00) |
P value = 0.000303 (t-test), Q value = 0.024
Table S1. Gene #4: '7p gain mutation analysis' versus Clinical Feature #2: 'AGE'
| nPatients | Mean (Std.Dev) | |
|---|---|---|
| ALL | 123 | 61.1 (6.6) |
| 7P GAIN MUTATED | 14 | 64.9 (3.0) |
| 7P GAIN WILD-TYPE | 109 | 60.7 (6.8) |
Figure S1. Get High-res Image Gene #4: '7p gain mutation analysis' versus Clinical Feature #2: 'AGE'
P value = 0.00208 (t-test), Q value = 0.16
Table S2. Gene #5: '7q gain mutation analysis' versus Clinical Feature #2: 'AGE'
| nPatients | Mean (Std.Dev) | |
|---|---|---|
| ALL | 123 | 61.1 (6.6) |
| 7Q GAIN MUTATED | 11 | 64.7 (3.1) |
| 7Q GAIN WILD-TYPE | 112 | 60.8 (6.8) |
Figure S2. Get High-res Image Gene #5: '7q gain mutation analysis' versus Clinical Feature #2: 'AGE'
-
Mutation data file = broad_values_by_arm.mutsig.cluster.txt
-
Clinical data file = PRAD.clin.merged.picked.txt
-
Number of patients = 123
-
Number of significantly arm-level cnvs = 20
-
Number of selected clinical features = 4
-
Exclude genes that fewer than K tumors have mutations, K = 3
For survival clinical features, the Kaplan-Meier survival curves of tumors with and without gene mutations were plotted and the statistical significance P values were estimated by logrank test (Bland and Altman 2004) using the 'survdiff' function in R
For continuous numerical clinical features, two-tailed Student's t test with unequal variance (Lehmann and Romano 2005) was applied to compare the clinical values between tumors with and without gene mutations using 't.test' function in R
For binary or multi-class clinical features (nominal or ordinal), two-tailed Fisher's exact tests (Fisher 1922) were used to estimate the P values using the 'fisher.test' function in R
For multiple hypothesis correction, Q value is the False Discovery Rate (FDR) analogue of the P value (Benjamini and Hochberg 1995), defined as the minimum FDR at which the test may be called significant. We used the 'Benjamini and Hochberg' method of 'p.adjust' function in R to convert P values into Q values.
This is an experimental feature. The full results of the analysis summarized in this report can be downloaded from the TCGA Data Coordination Center.