This pipeline uses various statistical tests to identify mRNAs whose expression levels correlated to selected clinical features.
Testing the association between 18155 genes and 3 clinical features across 53 samples, statistically thresholded by Q value < 0.05, 3 clinical features related to at least one genes.
-
1 gene correlated to 'AGE'.
-
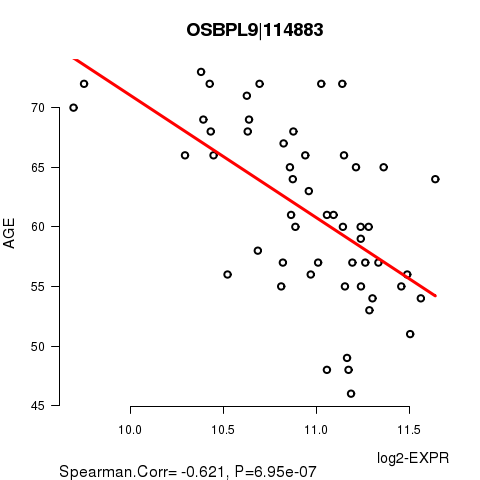
OSBPL9|114883
-
10 genes correlated to 'RADIATIONS.RADIATION.REGIMENINDICATION'.
-
SCN11A|11280 , TSPAN19|144448 , ZNF596|169270 , SFRS2|6427 , VN1R1|57191 , ...
-
77 genes correlated to 'NEOADJUVANT.THERAPY'.
-
KIAA1644|85352 , SPOCK3|50859 , PDPN|10630 , HSPB8|26353 , DCBLD2|131566 , ...
Complete statistical result table is provided in Supplement Table 1
Table 1. Get Full Table This table shows the clinical features, statistical methods used, and the number of genes that are significantly associated with each clinical feature at Q value < 0.05.
| Clinical feature | Statistical test | Significant genes | Associated with | Associated with | ||
|---|---|---|---|---|---|---|
| AGE | Spearman correlation test | N=1 | older | N=0 | younger | N=1 |
| RADIATIONS RADIATION REGIMENINDICATION | t test | N=10 | yes | N=3 | no | N=7 |
| NEOADJUVANT THERAPY | t test | N=77 | yes | N=59 | no | N=18 |
Table S1. Basic characteristics of clinical feature: 'AGE'
| AGE | Mean (SD) | 61.3 (7.2) |
| Significant markers | N = 1 | |
| pos. correlated | 0 | |
| neg. correlated | 1 |
Table S2. Get Full Table List of one gene significantly correlated to 'AGE' by Spearman correlation test
| SpearmanCorr | corrP | Q | |
|---|---|---|---|
| OSBPL9|114883 | -0.6211 | 6.951e-07 | 0.0126 |
Figure S1. Get High-res Image As an example, this figure shows the association of OSBPL9|114883 to 'AGE'. P value = 6.95e-07 with Spearman correlation analysis. The straight line presents the best linear regression.
10 genes related to 'RADIATIONS.RADIATION.REGIMENINDICATION'.
Table S3. Basic characteristics of clinical feature: 'RADIATIONS.RADIATION.REGIMENINDICATION'
| RADIATIONS.RADIATION.REGIMENINDICATION | Labels | N |
| NO | 4 | |
| YES | 49 | |
| Significant markers | N = 10 | |
| Higher in YES | 3 | |
| Higher in NO | 7 |
Table S4. Get Full Table List of 10 genes differentially expressed by 'RADIATIONS.RADIATION.REGIMENINDICATION'
| T(pos if higher in 'YES') | ttestP | Q | AUC | |
|---|---|---|---|---|
| SCN11A|11280 | -8.92 | 7.261e-08 | 0.00125 | 0.9583 |
| TSPAN19|144448 | 7.97 | 1.119e-07 | 0.00192 | 0.907 |
| ZNF596|169270 | -7.67 | 2.379e-07 | 0.00408 | 0.9235 |
| SFRS2|6427 | -6.38 | 3.135e-07 | 0.00538 | 0.8367 |
| VN1R1|57191 | -6.13 | 3.556e-07 | 0.0061 | 0.8724 |
| UBTF|7343 | -6.6 | 4.129e-07 | 0.00709 | 0.8724 |
| FGFR3|2261 | -5.46 | 1.407e-06 | 0.0241 | 0.7806 |
| C15ORF57|90416 | 5.56 | 1.485e-06 | 0.0255 | 0.7908 |
| ELP3|55140 | -5.36 | 2.3e-06 | 0.0395 | 0.7347 |
| ABHD11|83451 | 5.76 | 2.676e-06 | 0.0459 | 0.852 |
Figure S2. Get High-res Image As an example, this figure shows the association of SCN11A|11280 to 'RADIATIONS.RADIATION.REGIMENINDICATION'. P value = 7.26e-08 with T-test analysis.
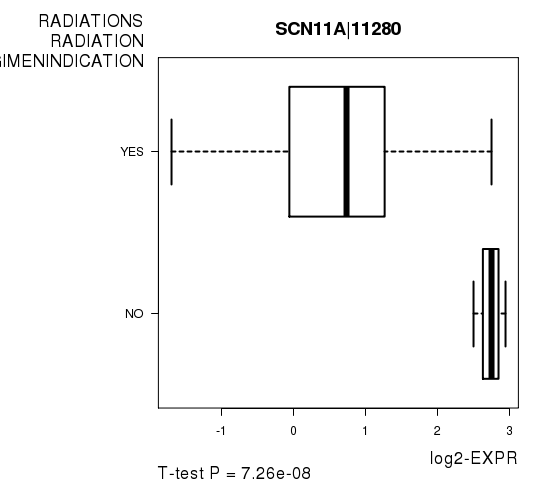
Table S5. Basic characteristics of clinical feature: 'NEOADJUVANT.THERAPY'
| NEOADJUVANT.THERAPY | Labels | N |
| NO | 3 | |
| YES | 50 | |
| Significant markers | N = 77 | |
| Higher in YES | 59 | |
| Higher in NO | 18 |
Table S6. Get Full Table List of top 10 genes differentially expressed by 'NEOADJUVANT.THERAPY'
| T(pos if higher in 'YES') | ttestP | Q | AUC | |
|---|---|---|---|---|
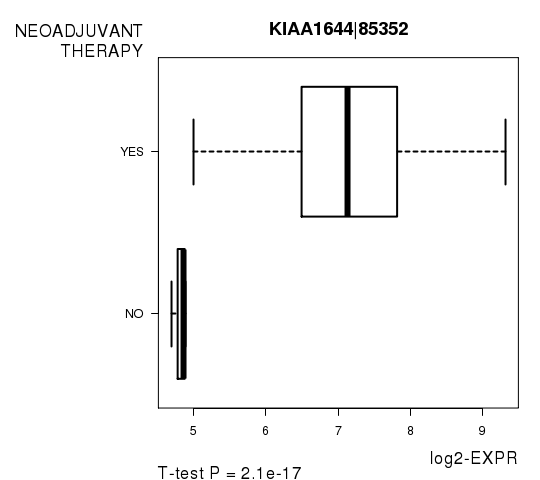
| KIAA1644|85352 | 15.32 | 2.098e-17 | 3.38e-13 | 1 |
| SPOCK3|50859 | 14.03 | 2.622e-17 | 4.22e-13 | 0.9867 |
| PDPN|10630 | 13.08 | 1.503e-16 | 2.42e-12 | 0.9467 |
| HSPB8|26353 | 16.25 | 1.626e-16 | 2.62e-12 | 1 |
| DCBLD2|131566 | 11.25 | 2.2e-15 | 3.54e-11 | 0.94 |
| PTPN9|5780 | 11.21 | 3.201e-15 | 5.15e-11 | 0.9467 |
| TGFB1I1|7041 | 13.78 | 1.156e-13 | 1.86e-09 | 0.98 |
| FGFR1|2260 | 9.95 | 2.136e-13 | 3.44e-09 | 0.92 |
| ACSL6|23305 | -9.85 | 2.709e-13 | 4.36e-09 | 0.9867 |
| FAM13C|220965 | 11.14 | 7.037e-13 | 1.13e-08 | 0.96 |
Figure S3. Get High-res Image As an example, this figure shows the association of KIAA1644|85352 to 'NEOADJUVANT.THERAPY'. P value = 2.1e-17 with T-test analysis.
-
Expresson data file = PRAD.uncv2.mRNAseq_RSEM_normalized_log2.txt
-
Clinical data file = PRAD.clin.merged.picked.txt
-
Number of patients = 53
-
Number of genes = 18155
-
Number of clinical features = 3
For continuous numerical clinical features, Spearman's rank correlation coefficients (Spearman 1904) and two-tailed P values were estimated using 'cor.test' function in R
For two-class clinical features, two-tailed Student's t test with unequal variance (Lehmann and Romano 2005) was applied to compare the log2-expression levels between the two clinical classes using 't.test' function in R
For multiple hypothesis correction, Q value is the False Discovery Rate (FDR) analogue of the P value (Benjamini and Hochberg 1995), defined as the minimum FDR at which the test may be called significant. We used the 'Benjamini and Hochberg' method of 'p.adjust' function in R to convert P values into Q values.
This is an experimental feature. The full results of the analysis summarized in this report can be downloaded from the TCGA Data Coordination Center.