This pipeline uses various statistical tests to identify genes whose promoter methylation levels correlated to selected clinical features.
Testing the association between 17263 genes and 3 clinical features across 50 samples, statistically thresholded by Q value < 0.05, 2 clinical features related to at least one genes.
-
9 genes correlated to 'RADIATIONS.RADIATION.REGIMENINDICATION'.
-
SCD , ZNF473 , PFDN5 , RNMTL1 , ZNF506 , ...
-
163 genes correlated to 'NEOADJUVANT.THERAPY'.
-
LOC100130581 , GNG7 , CLDN23 , HOTAIR , TMEM38A , ...
-
No genes correlated to 'AGE'
Complete statistical result table is provided in Supplement Table 1
Table 1. Get Full Table This table shows the clinical features, statistical methods used, and the number of genes that are significantly associated with each clinical feature at Q value < 0.05.
| Clinical feature | Statistical test | Significant genes | Associated with | Associated with | ||
|---|---|---|---|---|---|---|
| AGE | Spearman correlation test | N=0 | ||||
| RADIATIONS RADIATION REGIMENINDICATION | t test | N=9 | yes | N=6 | no | N=3 |
| NEOADJUVANT THERAPY | t test | N=163 | yes | N=100 | no | N=63 |
Table S1. Basic characteristics of clinical feature: 'AGE'
| AGE | Mean (SD) | 60.78 (7) |
| Significant markers | N = 0 |
9 genes related to 'RADIATIONS.RADIATION.REGIMENINDICATION'.
Table S2. Basic characteristics of clinical feature: 'RADIATIONS.RADIATION.REGIMENINDICATION'
| RADIATIONS.RADIATION.REGIMENINDICATION | Labels | N |
| NO | 4 | |
| YES | 46 | |
| Significant markers | N = 9 | |
| Higher in YES | 6 | |
| Higher in NO | 3 |
Table S3. Get Full Table List of 9 genes differentially expressed by 'RADIATIONS.RADIATION.REGIMENINDICATION'
| T(pos if higher in 'YES') | ttestP | Q | AUC | |
|---|---|---|---|---|
| SCD | -7.29 | 3.335e-09 | 5.76e-05 | 0.8859 |
| ZNF473 | 6.26 | 2.126e-07 | 0.00367 | 0.8315 |
| PFDN5 | 5.72 | 7.899e-07 | 0.0136 | 0.8696 |
| RNMTL1 | -5.84 | 8.66e-07 | 0.0149 | 0.8098 |
| ZNF506 | 5.79 | 1.572e-06 | 0.0271 | 0.8152 |
| POLD3 | 6.11 | 1.84e-06 | 0.0317 | 0.8478 |
| C8ORF42 | 5.98 | 2.142e-06 | 0.037 | 0.9022 |
| TC2N | -5.38 | 2.226e-06 | 0.0384 | 0.8207 |
| WIBG | 5.49 | 2.808e-06 | 0.0485 | 0.7717 |
Figure S1. Get High-res Image As an example, this figure shows the association of SCD to 'RADIATIONS.RADIATION.REGIMENINDICATION'. P value = 3.34e-09 with T-test analysis.
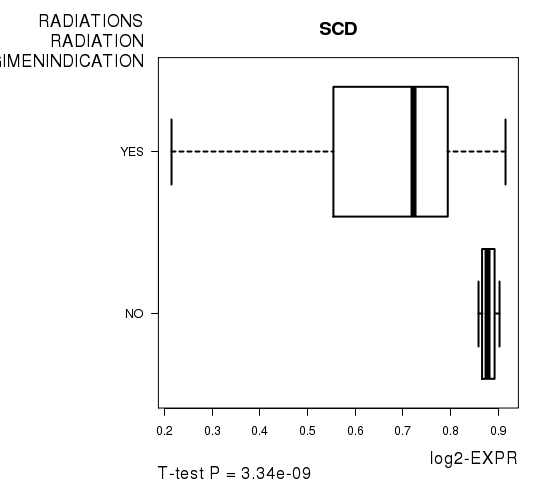
Table S4. Basic characteristics of clinical feature: 'NEOADJUVANT.THERAPY'
| NEOADJUVANT.THERAPY | Labels | N |
| NO | 3 | |
| YES | 47 | |
| Significant markers | N = 163 | |
| Higher in YES | 100 | |
| Higher in NO | 63 |
Table S5. Get Full Table List of top 10 genes differentially expressed by 'NEOADJUVANT.THERAPY'
| T(pos if higher in 'YES') | ttestP | Q | AUC | |
|---|---|---|---|---|
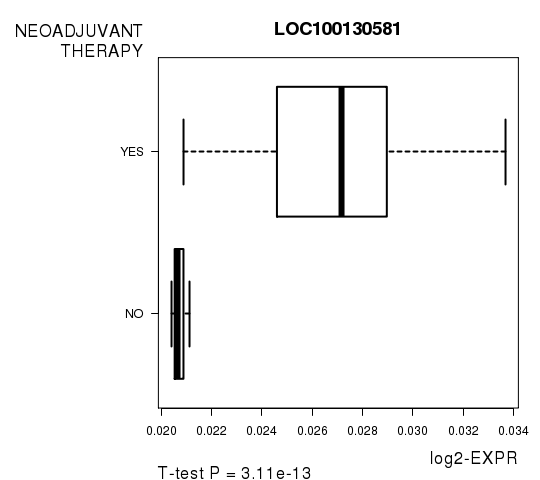
| LOC100130581 | 10.17 | 3.106e-13 | 5.36e-09 | 0.9858 |
| GNG7 | -12.87 | 3.239e-13 | 5.59e-09 | 0.9574 |
| CLDN23 | 9.74 | 7.017e-13 | 1.21e-08 | 0.9787 |
| HOTAIR | 9.73 | 8.4e-13 | 1.45e-08 | 0.9574 |
| TMEM38A | 9.53 | 1.265e-12 | 2.18e-08 | 0.9362 |
| SLC44A2 | -9.43 | 1.775e-12 | 3.06e-08 | 0.8865 |
| CYP17A1 | 9.42 | 3.936e-12 | 6.79e-08 | 0.9787 |
| ANGPTL2 | -9.15 | 4.922e-12 | 8.49e-08 | 0.9291 |
| C21ORF56 | 9.2 | 5.13e-12 | 8.85e-08 | 0.8723 |
| ALOX5 | -10.86 | 6.036e-12 | 1.04e-07 | 0.9787 |
Figure S2. Get High-res Image As an example, this figure shows the association of LOC100130581 to 'NEOADJUVANT.THERAPY'. P value = 3.11e-13 with T-test analysis.
-
Expresson data file = PRAD.meth.for_correlation.filtered_data.txt
-
Clinical data file = PRAD.clin.merged.picked.txt
-
Number of patients = 50
-
Number of genes = 17263
-
Number of clinical features = 3
For continuous numerical clinical features, Spearman's rank correlation coefficients (Spearman 1904) and two-tailed P values were estimated using 'cor.test' function in R
For two-class clinical features, two-tailed Student's t test with unequal variance (Lehmann and Romano 2005) was applied to compare the log2-expression levels between the two clinical classes using 't.test' function in R
For multiple hypothesis correction, Q value is the False Discovery Rate (FDR) analogue of the P value (Benjamini and Hochberg 1995), defined as the minimum FDR at which the test may be called significant. We used the 'Benjamini and Hochberg' method of 'p.adjust' function in R to convert P values into Q values.
This is an experimental feature. The full results of the analysis summarized in this report can be downloaded from the TCGA Data Coordination Center.