This pipeline uses various statistical tests to identify miRs whose expression levels correlated to selected clinical features.
Testing the association between 474 genes and 3 clinical features across 81 samples, statistically thresholded by Q value < 0.05, 2 clinical features related to at least one genes.
-
1 gene correlated to 'RADIATIONS.RADIATION.REGIMENINDICATION'.
-
HSA-MIR-30C-2
-
5 genes correlated to 'NEOADJUVANT.THERAPY'.
-
HSA-MIR-200B , HSA-MIR-200C , HSA-MIR-3615 , HSA-MIR-29B-2 , HSA-MIR-3605
-
No genes correlated to 'AGE'
Complete statistical result table is provided in Supplement Table 1
Table 1. Get Full Table This table shows the clinical features, statistical methods used, and the number of genes that are significantly associated with each clinical feature at Q value < 0.05.
| Clinical feature | Statistical test | Significant genes | Associated with | Associated with | ||
|---|---|---|---|---|---|---|
| AGE | Spearman correlation test | N=0 | ||||
| RADIATIONS RADIATION REGIMENINDICATION | t test | N=1 | yes | N=0 | no | N=1 |
| NEOADJUVANT THERAPY | t test | N=5 | yes | N=1 | no | N=4 |
Table S1. Basic characteristics of clinical feature: 'AGE'
| AGE | Mean (SD) | 61.11 (6.7) |
| Significant markers | N = 0 |
One gene related to 'RADIATIONS.RADIATION.REGIMENINDICATION'.
Table S2. Basic characteristics of clinical feature: 'RADIATIONS.RADIATION.REGIMENINDICATION'
| RADIATIONS.RADIATION.REGIMENINDICATION | Labels | N |
| NO | 5 | |
| YES | 76 | |
| Significant markers | N = 1 | |
| Higher in YES | 0 | |
| Higher in NO | 1 |
Table S3. Get Full Table List of one gene differentially expressed by 'RADIATIONS.RADIATION.REGIMENINDICATION'
| T(pos if higher in 'YES') | ttestP | Q | AUC | |
|---|---|---|---|---|
| HSA-MIR-30C-2 | -5.51 | 4.417e-05 | 0.0194 | 0.8289 |
Figure S1. Get High-res Image As an example, this figure shows the association of HSA-MIR-30C-2 to 'RADIATIONS.RADIATION.REGIMENINDICATION'. P value = 4.42e-05 with T-test analysis.
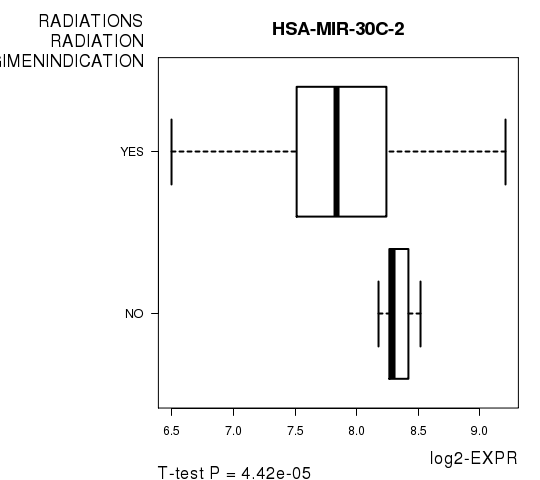
Table S4. Basic characteristics of clinical feature: 'NEOADJUVANT.THERAPY'
| NEOADJUVANT.THERAPY | Labels | N |
| NO | 3 | |
| YES | 78 | |
| Significant markers | N = 5 | |
| Higher in YES | 1 | |
| Higher in NO | 4 |
Table S5. Get Full Table List of 5 genes differentially expressed by 'NEOADJUVANT.THERAPY'
| T(pos if higher in 'YES') | ttestP | Q | AUC | |
|---|---|---|---|---|
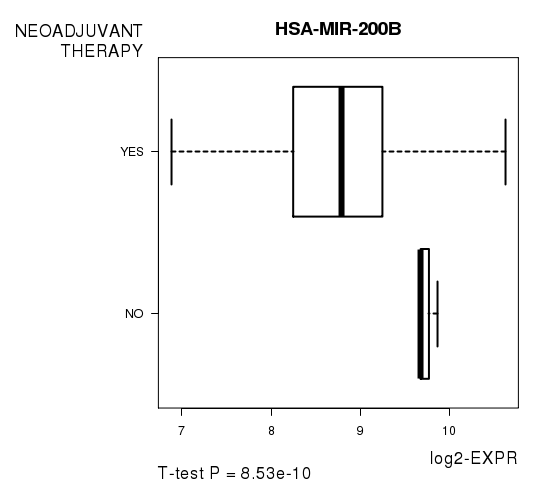
| HSA-MIR-200B | -7.63 | 8.53e-10 | 2.87e-07 | 0.9145 |
| HSA-MIR-200C | -9.14 | 1.405e-09 | 4.72e-07 | 0.8846 |
| HSA-MIR-3615 | -6.5 | 2.763e-06 | 0.000926 | 0.7911 |
| HSA-MIR-29B-2 | -9.32 | 5.163e-05 | 0.0172 | 0.9444 |
| HSA-MIR-3605 | 7.53 | 0.000125 | 0.0416 | 0.8846 |
Figure S2. Get High-res Image As an example, this figure shows the association of HSA-MIR-200B to 'NEOADJUVANT.THERAPY'. P value = 8.53e-10 with T-test analysis.
-
Expresson data file = PRAD.miRseq_RPKM_log2.txt
-
Clinical data file = PRAD.clin.merged.picked.txt
-
Number of patients = 81
-
Number of genes = 474
-
Number of clinical features = 3
For continuous numerical clinical features, Spearman's rank correlation coefficients (Spearman 1904) and two-tailed P values were estimated using 'cor.test' function in R
For two-class clinical features, two-tailed Student's t test with unequal variance (Lehmann and Romano 2005) was applied to compare the log2-expression levels between the two clinical classes using 't.test' function in R
For multiple hypothesis correction, Q value is the False Discovery Rate (FDR) analogue of the P value (Benjamini and Hochberg 1995), defined as the minimum FDR at which the test may be called significant. We used the 'Benjamini and Hochberg' method of 'p.adjust' function in R to convert P values into Q values.
This is an experimental feature. The full results of the analysis summarized in this report can be downloaded from the TCGA Data Coordination Center.