This pipeline uses various statistical tests to identify mRNAs whose expression levels correlated to selected clinical features.
Testing the association between 18305 genes and 8 clinical features across 72 samples, statistically thresholded by Q value < 0.05, 4 clinical features related to at least one genes.
-
14 genes correlated to 'GENDER'.
-
XIST|7503 , RPS4Y1|6192 , DDX3Y|8653 , UTY|7404 , NLGN4Y|22829 , ...
-
48 genes correlated to 'HISTOLOGICAL.TYPE'.
-
EFNA5|1946 , PIPOX|51268 , AGR3|155465 , FNTB|2342 , SERPINA1|5265 , ...
-
1 gene correlated to 'PATHOLOGY.N'.
-
CLNK|116449
-
5 genes correlated to 'PATHOLOGICSPREAD(M)'.
-
TMEM84|283673 , ODZ1|10178 , CTNNA2|1496 , LOC100189589|100189589 , C1ORF114|57821
-
No genes correlated to 'Time to Death', 'AGE', 'PATHOLOGY.T', and 'TUMOR.STAGE'.
Complete statistical result table is provided in Supplement Table 1
Table 1. Get Full Table This table shows the clinical features, statistical methods used, and the number of genes that are significantly associated with each clinical feature at Q value < 0.05.
| Clinical feature | Statistical test | Significant genes | Associated with | Associated with | ||
|---|---|---|---|---|---|---|
| Time to Death | Cox regression test | N=0 | ||||
| AGE | Spearman correlation test | N=0 | ||||
| GENDER | t test | N=14 | male | N=11 | female | N=3 |
| HISTOLOGICAL TYPE | t test | N=48 | rectal mucinous adenocarcinoma | N=39 | rectal adenocarcinoma | N=9 |
| PATHOLOGY T | Spearman correlation test | N=0 | ||||
| PATHOLOGY N | Spearman correlation test | N=1 | higher pN | N=0 | lower pN | N=1 |
| PATHOLOGICSPREAD(M) | t test | N=5 | m1 | N=0 | m0 | N=5 |
| TUMOR STAGE | Spearman correlation test | N=0 |
Table S1. Basic characteristics of clinical feature: 'Time to Death'
| Time to Death | Duration (Months) | 0.9-72.1 (median=10.6) |
| censored | N = 39 | |
| death | N = 4 | |
| Significant markers | N = 0 |
Table S2. Basic characteristics of clinical feature: 'AGE'
| AGE | Mean (SD) | 66.75 (10) |
| Significant markers | N = 0 |
Table S3. Basic characteristics of clinical feature: 'GENDER'
| GENDER | Labels | N |
| FEMALE | 33 | |
| MALE | 39 | |
| Significant markers | N = 14 | |
| Higher in MALE | 11 | |
| Higher in FEMALE | 3 |
Table S4. Get Full Table List of top 10 genes differentially expressed by 'GENDER'
| T(pos if higher in 'MALE') | ttestP | Q | AUC | |
|---|---|---|---|---|
| XIST|7503 | -19.86 | 5.762e-27 | 1.05e-22 | 0.999 |
| RPS4Y1|6192 | 15.48 | 2.795e-21 | 5.12e-17 | 0.9938 |
| DDX3Y|8653 | 16.43 | 8.023e-20 | 1.47e-15 | 0.9979 |
| UTY|7404 | 14.04 | 1.665e-19 | 3.05e-15 | 0.9918 |
| NLGN4Y|22829 | 13.94 | 1.46e-18 | 2.67e-14 | 0.9931 |
| ZFY|7544 | 10.35 | 9.875e-16 | 1.81e-11 | 0.9635 |
| TSIX|9383 | -9.82 | 3.694e-14 | 6.76e-10 | 0.9293 |
| EIF1AY|9086 | 11.72 | 2.638e-13 | 4.83e-09 | 0.9894 |
| TTTY15|64595 | 10.08 | 7.814e-13 | 1.43e-08 | 0.9737 |
| KDM5D|8284 | 12.46 | 5.451e-12 | 9.97e-08 | 0.994 |
Figure S1. Get High-res Image As an example, this figure shows the association of XIST|7503 to 'GENDER'. P value = 5.76e-27 with T-test analysis.
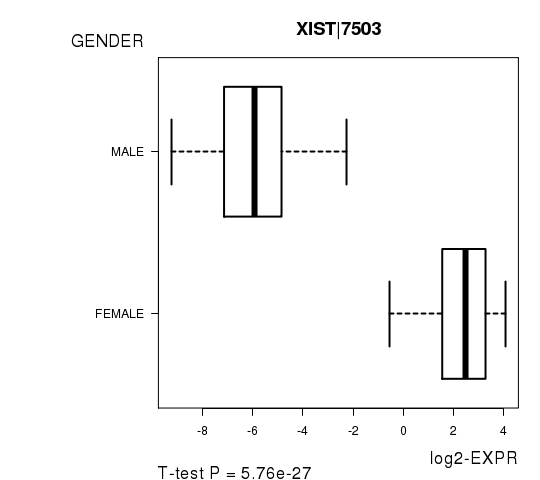
Table S5. Basic characteristics of clinical feature: 'HISTOLOGICAL.TYPE'
| HISTOLOGICAL.TYPE | Labels | N |
| RECTAL ADENOCARCINOMA | 60 | |
| RECTAL MUCINOUS ADENOCARCINOMA | 8 | |
| Significant markers | N = 48 | |
| Higher in RECTAL MUCINOUS ADENOCARCINOMA | 39 | |
| Higher in RECTAL ADENOCARCINOMA | 9 |
Table S6. Get Full Table List of top 10 genes differentially expressed by 'HISTOLOGICAL.TYPE'
| T(pos if higher in 'RECTAL MUCINOUS ADENOCARCINOMA') | ttestP | Q | AUC | |
|---|---|---|---|---|
| EFNA5|1946 | 9.48 | 1.235e-11 | 2.24e-07 | 0.8917 |
| PIPOX|51268 | -7.64 | 4.444e-10 | 8.05e-06 | 0.8312 |
| AGR3|155465 | 7.82 | 3.525e-09 | 6.39e-05 | 0.8938 |
| FNTB|2342 | 6.98 | 9.547e-09 | 0.000173 | 0.8479 |
| SERPINA1|5265 | 8.83 | 3.275e-08 | 0.000593 | 0.9312 |
| FHL2|2274 | 7.39 | 3.816e-08 | 0.000692 | 0.8958 |
| B3GNT6|192134 | 9.67 | 3.818e-08 | 0.000692 | 0.9562 |
| EIF2S1|1965 | 6.47 | 4.994e-08 | 0.000905 | 0.8479 |
| GNPNAT1|64841 | 7.27 | 5.152e-08 | 0.000933 | 0.9229 |
| SNX20|124460 | 6.83 | 5.511e-08 | 0.000998 | 0.8354 |
Figure S2. Get High-res Image As an example, this figure shows the association of EFNA5|1946 to 'HISTOLOGICAL.TYPE'. P value = 1.24e-11 with T-test analysis.
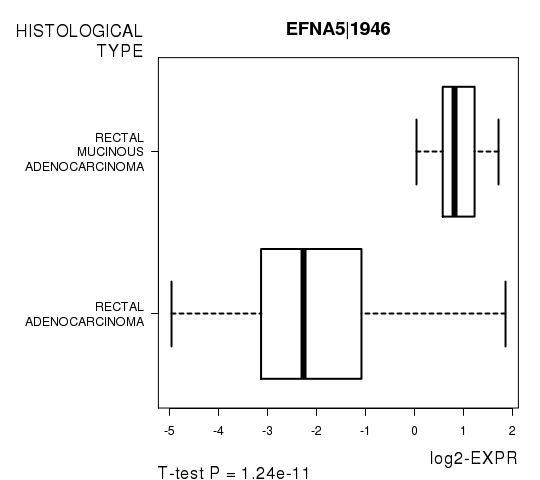
Table S7. Basic characteristics of clinical feature: 'PATHOLOGY.T'
| PATHOLOGY.T | Mean (SD) | 2.71 (0.68) |
| N | ||
| T1 | 5 | |
| T2 | 15 | |
| T3 | 48 | |
| T4 | 4 | |
| Significant markers | N = 0 |
Table S8. Basic characteristics of clinical feature: 'PATHOLOGY.N'
| PATHOLOGY.N | Mean (SD) | 0.56 (0.77) |
| N | ||
| N0 | 44 | |
| N1 | 16 | |
| N2 | 12 | |
| Significant markers | N = 1 | |
| pos. correlated | 0 | |
| neg. correlated | 1 |
Table S9. Get Full Table List of one gene significantly correlated to 'PATHOLOGY.N' by Spearman correlation test
| SpearmanCorr | corrP | Q | |
|---|---|---|---|
| CLNK|116449 | -0.5354 | 2.552e-06 | 0.0467 |
Figure S3. Get High-res Image As an example, this figure shows the association of CLNK|116449 to 'PATHOLOGY.N'. P value = 2.55e-06 with Spearman correlation analysis.
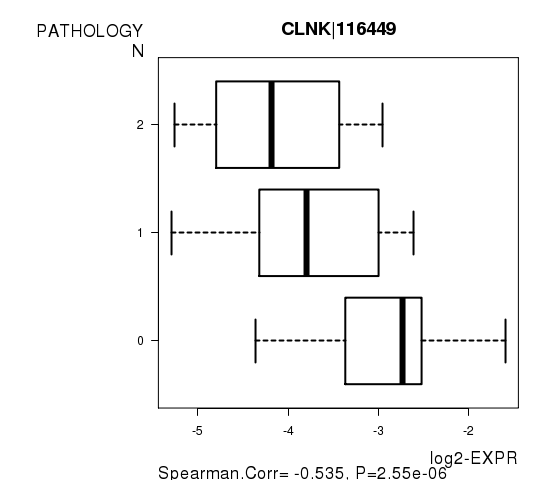
Table S10. Basic characteristics of clinical feature: 'PATHOLOGICSPREAD(M)'
| PATHOLOGICSPREAD(M) | Labels | N |
| M0 | 61 | |
| M1 | 11 | |
| Significant markers | N = 5 | |
| Higher in M1 | 0 | |
| Higher in M0 | 5 |
Table S11. Get Full Table List of 5 genes differentially expressed by 'PATHOLOGICSPREAD(M)'
| T(pos if higher in 'M1') | ttestP | Q | AUC | |
|---|---|---|---|---|
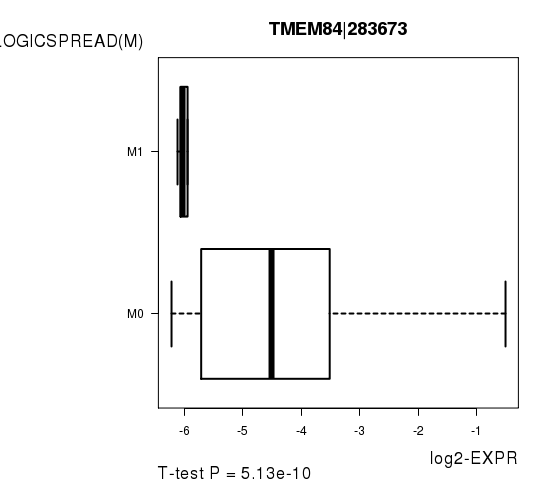
| TMEM84|283673 | -7.71 | 5.132e-10 | 9.34e-06 | 0.8804 |
| ODZ1|10178 | -6.43 | 4.492e-07 | 0.00818 | 0.8889 |
| CTNNA2|1496 | -5.9 | 6.226e-07 | 0.0113 | 0.8661 |
| LOC100189589|100189589 | -5.78 | 2.571e-06 | 0.0468 | 0.8283 |
| C1ORF114|57821 | -5.69 | 2.716e-06 | 0.0494 | 0.8849 |
Figure S4. Get High-res Image As an example, this figure shows the association of TMEM84|283673 to 'PATHOLOGICSPREAD(M)'. P value = 5.13e-10 with T-test analysis.
-
Expresson data file = READ.mRNAseq_RPKM_log2.txt
-
Clinical data file = READ.clin.merged.picked.txt
-
Number of patients = 72
-
Number of genes = 18305
-
Number of clinical features = 8
For survival clinical features, Wald's test in univariate Cox regression analysis with proportional hazards model (Andersen and Gill 1982) was used to estimate the P values using the 'coxph' function in R. Kaplan-Meier survival curves were plot using the four quartile subgroups of patients based on expression levels
For continuous numerical clinical features, Spearman's rank correlation coefficients (Spearman 1904) and two-tailed P values were estimated using 'cor.test' function in R
For two-class clinical features, two-tailed Student's t test with unequal variance (Lehmann and Romano 2005) was applied to compare the log2-expression levels between the two clinical classes using 't.test' function in R
For multiple hypothesis correction, Q value is the False Discovery Rate (FDR) analogue of the P value (Benjamini and Hochberg 1995), defined as the minimum FDR at which the test may be called significant. We used the 'Benjamini and Hochberg' method of 'p.adjust' function in R to convert P values into Q values.
This is an experimental feature. The full results of the analysis summarized in this report can be downloaded from the TCGA Data Coordination Center.