This pipeline uses various statistical tests to identify RPPAs whose expression levels correlated to selected clinical features.
Testing the association between 175 genes and 5 clinical features across 152 samples, statistically thresholded by Q value < 0.05, 4 clinical features related to at least one genes.
-
18 genes correlated to 'AGE'.
-
SNAI2|SNAIL-M-C , EEF2|EEF2-R-V , AKT1 AKT2 AKT3|AKT_PS473-R-V , PIK3R1|PI3K-P85-R-V , EGFR|EGFR_PY1068-R-V , ...
-
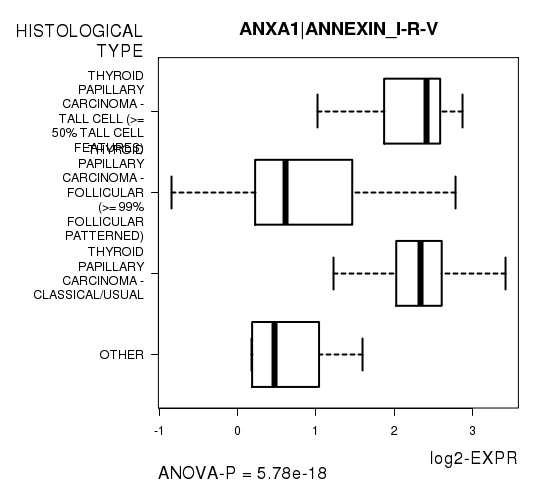
45 genes correlated to 'HISTOLOGICAL.TYPE'.
-
ANXA1|ANNEXIN_I-R-V , FN1|FIBRONECTIN-R-C , IRS1|IRS1-R-V , C12ORF5|TIGAR-R-V , CHEK2|CHK2-M-C , ...
-
8 genes correlated to 'RADIATIONS.RADIATION.REGIMENINDICATION'.
-
ERBB2|HER2_PY1248-R-V , WWTR1|TAZ_PS89-R-C , ARID1A|ARID1A-M-V , CDKN1B|P27_PT157-R-C , DVL3|DVL3-R-V , ...
-
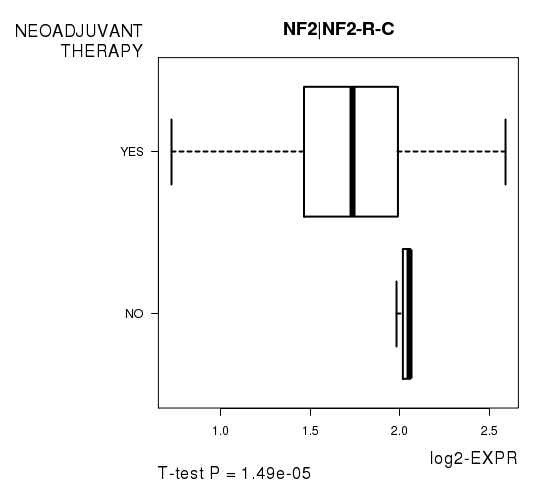
2 genes correlated to 'NEOADJUVANT.THERAPY'.
-
NF2|NF2-R-C , EIF4E|EIF4E-R-V
-
No genes correlated to 'GENDER'
Complete statistical result table is provided in Supplement Table 1
Table 1. Get Full Table This table shows the clinical features, statistical methods used, and the number of genes that are significantly associated with each clinical feature at Q value < 0.05.
| Clinical feature | Statistical test | Significant genes | Associated with | Associated with | ||
|---|---|---|---|---|---|---|
| AGE | Spearman correlation test | N=18 | older | N=9 | younger | N=9 |
| GENDER | t test | N=0 | ||||
| HISTOLOGICAL TYPE | ANOVA test | N=45 | ||||
| RADIATIONS RADIATION REGIMENINDICATION | t test | N=8 | yes | N=6 | no | N=2 |
| NEOADJUVANT THERAPY | t test | N=2 | yes | N=0 | no | N=2 |
Table S1. Basic characteristics of clinical feature: 'AGE'
| AGE | Mean (SD) | 46.7 (16) |
| Significant markers | N = 18 | |
| pos. correlated | 9 | |
| neg. correlated | 9 |
Table S2. Get Full Table List of top 10 genes significantly correlated to 'AGE' by Spearman correlation test
| SpearmanCorr | corrP | Q | |
|---|---|---|---|
| SNAI2|SNAIL-M-C | 0.3811 | 1.278e-06 | 0.000224 |
| EEF2|EEF2-R-V | -0.3684 | 3.024e-06 | 0.000526 |
| AKT1 AKT2 AKT3|AKT_PS473-R-V | 0.3676 | 3.171e-06 | 0.000549 |
| PIK3R1|PI3K-P85-R-V | -0.344 | 1.427e-05 | 0.00246 |
| EGFR|EGFR_PY1068-R-V | 0.344 | 1.433e-05 | 0.00246 |
| YAP1|YAP_PS127-R-C | -0.3343 | 2.559e-05 | 0.00435 |
| ATM|ATM-R-C | -0.3342 | 2.575e-05 | 0.00435 |
| BID|BID-R-C | -0.3335 | 2.69e-05 | 0.00452 |
| MAPK8|JNK_PT183_PT185-R-V | 0.3305 | 3.196e-05 | 0.00534 |
| AKT1 AKT2 AKT3|AKT_PT308-R-V | 0.327 | 3.914e-05 | 0.0065 |
Figure S1. Get High-res Image As an example, this figure shows the association of SNAI2|SNAIL-M-C to 'AGE'. P value = 1.28e-06 with Spearman correlation analysis. The straight line presents the best linear regression.
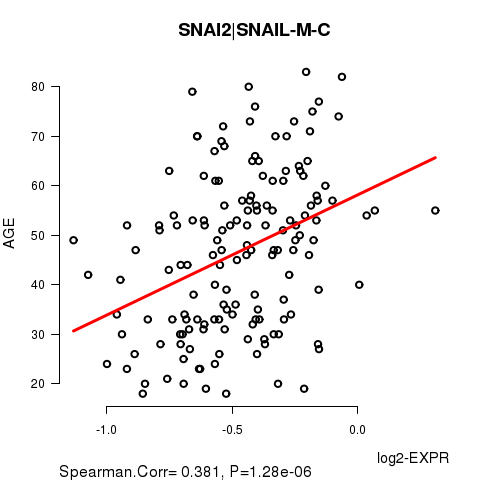
Table S3. Basic characteristics of clinical feature: 'GENDER'
| GENDER | Labels | N |
| FEMALE | 104 | |
| MALE | 48 | |
| Significant markers | N = 0 |
Table S4. Basic characteristics of clinical feature: 'HISTOLOGICAL.TYPE'
| HISTOLOGICAL.TYPE | Labels | N |
| OTHER | 7 | |
| THYROID PAPILLARY CARCINOMA - CLASSICAL/USUAL | 81 | |
| THYROID PAPILLARY CARCINOMA - FOLLICULAR (>= 99% FOLLICULAR PATTERNED) | 51 | |
| THYROID PAPILLARY CARCINOMA - TALL CELL (>= 50% TALL CELL FEATURES) | 13 | |
| Significant markers | N = 45 |
Table S5. Get Full Table List of top 10 genes differentially expressed by 'HISTOLOGICAL.TYPE'
| ANOVA_P | Q | |
|---|---|---|
| ANXA1|ANNEXIN_I-R-V | 5.78e-18 | 1.01e-15 |
| FN1|FIBRONECTIN-R-C | 1.109e-12 | 1.93e-10 |
| IRS1|IRS1-R-V | 4.114e-11 | 7.12e-09 |
| C12ORF5|TIGAR-R-V | 5.639e-11 | 9.7e-09 |
| CHEK2|CHK2-M-C | 1.845e-10 | 3.16e-08 |
| CDKN1B|P27_PT157-R-C | 3.229e-10 | 5.49e-08 |
| PIK3R1|PI3K-P85-R-V | 6.082e-10 | 1.03e-07 |
| RAF1|C-RAF_PS338-R-C | 1.075e-09 | 1.81e-07 |
| MET|C-MET-M-C | 1.758e-09 | 2.94e-07 |
| ERCC1|ERCC1-M-C | 2.291e-09 | 3.8e-07 |
Figure S2. Get High-res Image As an example, this figure shows the association of ANXA1|ANNEXIN_I-R-V to 'HISTOLOGICAL.TYPE'. P value = 5.78e-18 with ANOVA analysis.
8 genes related to 'RADIATIONS.RADIATION.REGIMENINDICATION'.
Table S6. Basic characteristics of clinical feature: 'RADIATIONS.RADIATION.REGIMENINDICATION'
| RADIATIONS.RADIATION.REGIMENINDICATION | Labels | N |
| NO | 13 | |
| YES | 139 | |
| Significant markers | N = 8 | |
| Higher in YES | 6 | |
| Higher in NO | 2 |
Table S7. Get Full Table List of 8 genes differentially expressed by 'RADIATIONS.RADIATION.REGIMENINDICATION'
| T(pos if higher in 'YES') | ttestP | Q | AUC | |
|---|---|---|---|---|
| ERBB2|HER2_PY1248-R-V | 4.75 | 4.018e-05 | 0.00703 | 0.7178 |
| WWTR1|TAZ_PS89-R-C | 4.93 | 0.0001062 | 0.0185 | 0.8024 |
| ARID1A|ARID1A-M-V | 4.34 | 0.000155 | 0.0268 | 0.6995 |
| CDKN1B|P27_PT157-R-C | 4.57 | 0.0001807 | 0.0311 | 0.7515 |
| DVL3|DVL3-R-V | -4.63 | 0.0001816 | 0.0311 | 0.7833 |
| BCL2L1|BCL-XL-R-V | -4.82 | 0.0002121 | 0.0361 | 0.8268 |
| IRS1|IRS1-R-V | 4.38 | 0.0002122 | 0.0361 | 0.7122 |
| MET|C-MET-M-C | 4.22 | 0.0002125 | 0.0361 | 0.679 |
Figure S3. Get High-res Image As an example, this figure shows the association of ERBB2|HER2_PY1248-R-V to 'RADIATIONS.RADIATION.REGIMENINDICATION'. P value = 4.02e-05 with T-test analysis.
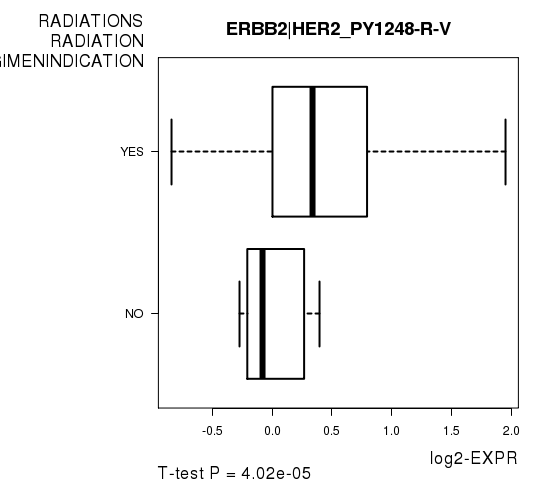
Table S8. Basic characteristics of clinical feature: 'NEOADJUVANT.THERAPY'
| NEOADJUVANT.THERAPY | Labels | N |
| NO | 3 | |
| YES | 149 | |
| Significant markers | N = 2 | |
| Higher in YES | 0 | |
| Higher in NO | 2 |
Table S9. Get Full Table List of 2 genes differentially expressed by 'NEOADJUVANT.THERAPY'
| T(pos if higher in 'YES') | ttestP | Q | AUC | |
|---|---|---|---|---|
| NF2|NF2-R-C | -7.12 | 1.487e-05 | 0.0026 | 0.7897 |
| EIF4E|EIF4E-R-V | -9.66 | 2.063e-05 | 0.00359 | 0.8837 |
Figure S4. Get High-res Image As an example, this figure shows the association of NF2|NF2-R-C to 'NEOADJUVANT.THERAPY'. P value = 1.49e-05 with T-test analysis.
-
Expresson data file = THCA.rppa.txt
-
Clinical data file = THCA.clin.merged.picked.txt
-
Number of patients = 152
-
Number of genes = 175
-
Number of clinical features = 5
For continuous numerical clinical features, Spearman's rank correlation coefficients (Spearman 1904) and two-tailed P values were estimated using 'cor.test' function in R
For two-class clinical features, two-tailed Student's t test with unequal variance (Lehmann and Romano 2005) was applied to compare the log2-expression levels between the two clinical classes using 't.test' function in R
For multi-class clinical features (ordinal or nominal), one-way analysis of variance (Howell 2002) was applied to compare the log2-expression levels between different clinical classes using 'anova' function in R
For multiple hypothesis correction, Q value is the False Discovery Rate (FDR) analogue of the P value (Benjamini and Hochberg 1995), defined as the minimum FDR at which the test may be called significant. We used the 'Benjamini and Hochberg' method of 'p.adjust' function in R to convert P values into Q values.
This is an experimental feature. The full results of the analysis summarized in this report can be downloaded from the TCGA Data Coordination Center.