This pipeline uses various statistical tests to identify genes whose promoter methylation levels correlated to selected clinical features.
Testing the association between 17057 genes and 5 clinical features across 114 samples, statistically thresholded by Q value < 0.05, 5 clinical features related to at least one genes.
-
23 genes correlated to 'AGE'.
-
INA , GPR37 , ANKRD43 , ABCC6P2 , GNPNAT1 , ...
-
4 genes correlated to 'GENDER'.
-
KIF4B , ACSM1 , WBP11P1 , METTL1
-
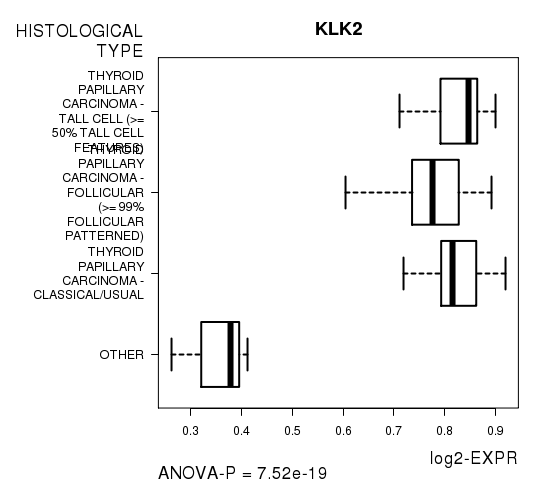
642 genes correlated to 'HISTOLOGICAL.TYPE'.
-
KLK2 , KCNJ1 , FITM1 , PON2 , KIAA1217 , ...
-
13 genes correlated to 'RADIATIONS.RADIATION.REGIMENINDICATION'.
-
MAP3K3 , STX17 , KIF15 , TAF4B , PLEKHF2 , ...
-
307 genes correlated to 'NEOADJUVANT.THERAPY'.
-
PTGS2 , MAGEL2 , PLSCR1 , MTMR15 , CYP17A1 , ...
Complete statistical result table is provided in Supplement Table 1
Table 1. Get Full Table This table shows the clinical features, statistical methods used, and the number of genes that are significantly associated with each clinical feature at Q value < 0.05.
| Clinical feature | Statistical test | Significant genes | Associated with | Associated with | ||
|---|---|---|---|---|---|---|
| AGE | Spearman correlation test | N=23 | older | N=23 | younger | N=0 |
| GENDER | t test | N=4 | male | N=2 | female | N=2 |
| HISTOLOGICAL TYPE | ANOVA test | N=642 | ||||
| RADIATIONS RADIATION REGIMENINDICATION | t test | N=13 | yes | N=8 | no | N=5 |
| NEOADJUVANT THERAPY | t test | N=307 | yes | N=166 | no | N=141 |
Table S1. Basic characteristics of clinical feature: 'AGE'
| AGE | Mean (SD) | 47.58 (16) |
| Significant markers | N = 23 | |
| pos. correlated | 23 | |
| neg. correlated | 0 |
Table S2. Get Full Table List of top 10 genes significantly correlated to 'AGE' by Spearman correlation test
| SpearmanCorr | corrP | Q | |
|---|---|---|---|
| INA | 0.528 | 1.574e-09 | 2.69e-05 |
| GPR37 | 0.5099 | 6.831e-09 | 0.000117 |
| ANKRD43 | 0.4879 | 3.675e-08 | 0.000627 |
| ABCC6P2 | 0.4871 | 3.883e-08 | 0.000662 |
| GNPNAT1 | 0.4765 | 8.39e-08 | 0.00143 |
| GPC5 | 0.4696 | 1.357e-07 | 0.00231 |
| SYNGR3 | 0.4655 | 1.798e-07 | 0.00307 |
| CBLN1 | 0.4635 | 2.064e-07 | 0.00352 |
| CDC5L | 0.4628 | 2.162e-07 | 0.00369 |
| ZNF518B | 0.458 | 2.996e-07 | 0.00511 |
Figure S1. Get High-res Image As an example, this figure shows the association of INA to 'AGE'. P value = 1.57e-09 with Spearman correlation analysis. The straight line presents the best linear regression.
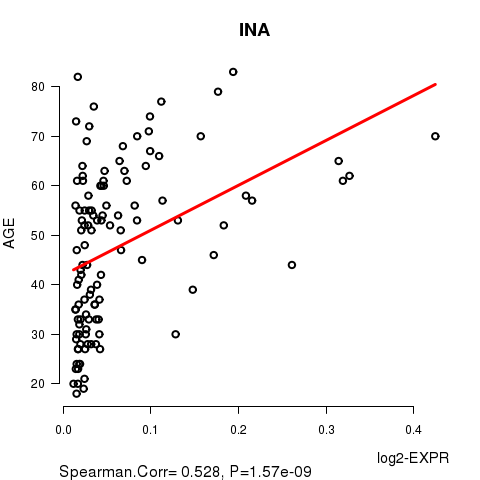
Table S3. Basic characteristics of clinical feature: 'GENDER'
| GENDER | Labels | N |
| FEMALE | 82 | |
| MALE | 32 | |
| Significant markers | N = 4 | |
| Higher in MALE | 2 | |
| Higher in FEMALE | 2 |
Table S4. Get Full Table List of 4 genes differentially expressed by 'GENDER'
| T(pos if higher in 'MALE') | ttestP | Q | AUC | |
|---|---|---|---|---|
| KIF4B | -8.53 | 7.774e-12 | 1.33e-07 | 0.9131 |
| ACSM1 | -6.87 | 5.441e-09 | 9.28e-05 | 0.8483 |
| WBP11P1 | 5.71 | 5.446e-07 | 0.00929 | 0.846 |
| METTL1 | 5.45 | 1.984e-06 | 0.0338 | 0.8422 |
Figure S2. Get High-res Image As an example, this figure shows the association of KIF4B to 'GENDER'. P value = 7.77e-12 with T-test analysis.
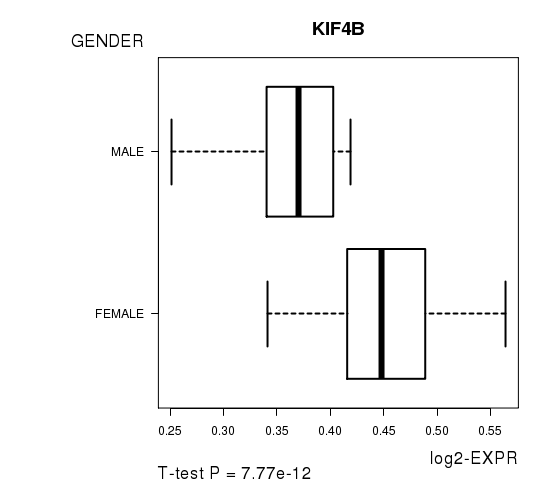
Table S5. Basic characteristics of clinical feature: 'HISTOLOGICAL.TYPE'
| HISTOLOGICAL.TYPE | Labels | N |
| OTHER | 3 | |
| THYROID PAPILLARY CARCINOMA - CLASSICAL/USUAL | 65 | |
| THYROID PAPILLARY CARCINOMA - FOLLICULAR (>= 99% FOLLICULAR PATTERNED) | 30 | |
| THYROID PAPILLARY CARCINOMA - TALL CELL (>= 50% TALL CELL FEATURES) | 16 | |
| Significant markers | N = 642 |
Table S6. Get Full Table List of top 10 genes differentially expressed by 'HISTOLOGICAL.TYPE'
| ANOVA_P | Q | |
|---|---|---|
| KLK2 | 7.521e-19 | 1.28e-14 |
| KCNJ1 | 2.391e-18 | 4.08e-14 |
| FITM1 | 4.817e-16 | 8.22e-12 |
| PON2 | 1.25e-15 | 2.13e-11 |
| KIAA1217 | 1.282e-15 | 2.19e-11 |
| EMP1 | 1.001e-14 | 1.71e-10 |
| LEPROT | 1.314e-14 | 2.24e-10 |
| RHOA | 1.365e-14 | 2.33e-10 |
| RELL1 | 2.409e-14 | 4.11e-10 |
| C5ORF62 | 5.428e-14 | 9.25e-10 |
Figure S3. Get High-res Image As an example, this figure shows the association of KLK2 to 'HISTOLOGICAL.TYPE'. P value = 7.52e-19 with ANOVA analysis.
13 genes related to 'RADIATIONS.RADIATION.REGIMENINDICATION'.
Table S7. Basic characteristics of clinical feature: 'RADIATIONS.RADIATION.REGIMENINDICATION'
| RADIATIONS.RADIATION.REGIMENINDICATION | Labels | N |
| NO | 11 | |
| YES | 103 | |
| Significant markers | N = 13 | |
| Higher in YES | 8 | |
| Higher in NO | 5 |
Table S8. Get Full Table List of top 10 genes differentially expressed by 'RADIATIONS.RADIATION.REGIMENINDICATION'
| T(pos if higher in 'YES') | ttestP | Q | AUC | |
|---|---|---|---|---|
| MAP3K3 | -8.07 | 5.979e-11 | 1.02e-06 | 0.835 |
| STX17 | 6.29 | 6.476e-09 | 0.00011 | 0.6858 |
| KIF15 | 6.16 | 1.171e-08 | 2e-04 | 0.7643 |
| TAF4B | 6.13 | 4.489e-08 | 0.000766 | 0.7732 |
| PLEKHF2 | -6.22 | 7.922e-08 | 0.00135 | 0.7899 |
| STEAP1 | 5.42 | 3.812e-07 | 0.0065 | 0.7432 |
| FAT4 | 5.52 | 4.328e-07 | 0.00738 | 0.7043 |
| AARS2 | 5.32 | 5.77e-07 | 0.00984 | 0.7361 |
| CDC42 | -5.57 | 6.629e-07 | 0.0113 | 0.7546 |
| BMP8B | 5.24 | 7.564e-07 | 0.0129 | 0.7061 |
Figure S4. Get High-res Image As an example, this figure shows the association of MAP3K3 to 'RADIATIONS.RADIATION.REGIMENINDICATION'. P value = 5.98e-11 with T-test analysis.
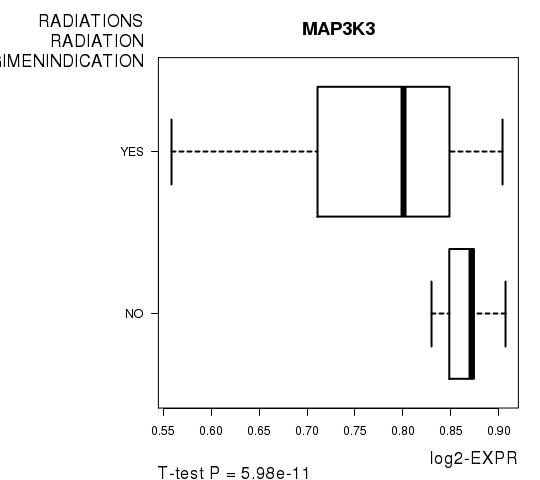
Table S9. Basic characteristics of clinical feature: 'NEOADJUVANT.THERAPY'
| NEOADJUVANT.THERAPY | Labels | N |
| NO | 3 | |
| YES | 111 | |
| Significant markers | N = 307 | |
| Higher in YES | 166 | |
| Higher in NO | 141 |
Table S10. Get Full Table List of top 10 genes differentially expressed by 'NEOADJUVANT.THERAPY'
| T(pos if higher in 'YES') | ttestP | Q | AUC | |
|---|---|---|---|---|
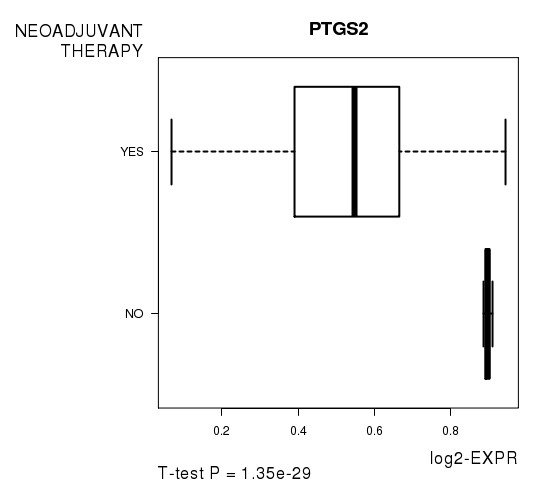
| PTGS2 | -16.49 | 1.352e-29 | 2.31e-25 | 0.961 |
| MAGEL2 | 17.09 | 6.205e-28 | 1.06e-23 | 0.982 |
| PLSCR1 | -13.74 | 1.027e-25 | 1.75e-21 | 0.997 |
| MTMR15 | 12.78 | 1.34e-23 | 2.29e-19 | 0.9309 |
| CYP17A1 | 12.33 | 5.144e-21 | 8.77e-17 | 0.973 |
| ZNF605 | 11.48 | 1.238e-20 | 2.11e-16 | 0.976 |
| ABAT | 11.57 | 2.001e-20 | 3.41e-16 | 0.955 |
| CCDC86 | -11.07 | 1.321e-19 | 2.25e-15 | 0.8709 |
| CCDC159 | 11.21 | 2.098e-19 | 3.58e-15 | 0.9279 |
| MLX | 11.45 | 2.319e-19 | 3.95e-15 | 0.9249 |
Figure S5. Get High-res Image As an example, this figure shows the association of PTGS2 to 'NEOADJUVANT.THERAPY'. P value = 1.35e-29 with T-test analysis.
-
Expresson data file = THCA.meth.for_correlation.filtered_data.txt
-
Clinical data file = THCA.clin.merged.picked.txt
-
Number of patients = 114
-
Number of genes = 17057
-
Number of clinical features = 5
For continuous numerical clinical features, Spearman's rank correlation coefficients (Spearman 1904) and two-tailed P values were estimated using 'cor.test' function in R
For two-class clinical features, two-tailed Student's t test with unequal variance (Lehmann and Romano 2005) was applied to compare the log2-expression levels between the two clinical classes using 't.test' function in R
For multi-class clinical features (ordinal or nominal), one-way analysis of variance (Howell 2002) was applied to compare the log2-expression levels between different clinical classes using 'anova' function in R
For multiple hypothesis correction, Q value is the False Discovery Rate (FDR) analogue of the P value (Benjamini and Hochberg 1995), defined as the minimum FDR at which the test may be called significant. We used the 'Benjamini and Hochberg' method of 'p.adjust' function in R to convert P values into Q values.
This is an experimental feature. The full results of the analysis summarized in this report can be downloaded from the TCGA Data Coordination Center.