This pipeline uses various statistical tests to identify miRs whose expression levels correlated to selected clinical features.
Testing the association between 531 genes and 5 clinical features across 195 samples, statistically thresholded by Q value < 0.05, 4 clinical features related to at least one genes.
-
3 genes correlated to 'AGE'.
-
HSA-MIR-874 , HSA-MIR-500A , HSA-MIR-616
-
103 genes correlated to 'HISTOLOGICAL.TYPE'.
-
HSA-MIR-21 , HSA-MIR-146B , HSA-MIR-7-2 , HSA-MIR-31 , HSA-MIR-3926-1 , ...
-
11 genes correlated to 'RADIATIONS.RADIATION.REGIMENINDICATION'.
-
HSA-MIR-1269 , HSA-MIR-888 , HSA-MIR-3130-1 , HSA-MIR-374A , HSA-MIR-2276 , ...
-
3 genes correlated to 'NEOADJUVANT.THERAPY'.
-
HSA-MIR-9-1 , HSA-MIR-424 , HSA-MIR-129-1
-
No genes correlated to 'GENDER'
Complete statistical result table is provided in Supplement Table 1
Table 1. Get Full Table This table shows the clinical features, statistical methods used, and the number of genes that are significantly associated with each clinical feature at Q value < 0.05.
| Clinical feature | Statistical test | Significant genes | Associated with | Associated with | ||
|---|---|---|---|---|---|---|
| AGE | Spearman correlation test | N=3 | older | N=3 | younger | N=0 |
| GENDER | t test | N=0 | ||||
| HISTOLOGICAL TYPE | ANOVA test | N=103 | ||||
| RADIATIONS RADIATION REGIMENINDICATION | t test | N=11 | yes | N=9 | no | N=2 |
| NEOADJUVANT THERAPY | t test | N=3 | yes | N=2 | no | N=1 |
Table S1. Basic characteristics of clinical feature: 'AGE'
| AGE | Mean (SD) | 46.36 (16) |
| Significant markers | N = 3 | |
| pos. correlated | 3 | |
| neg. correlated | 0 |
Table S2. Get Full Table List of 3 genes significantly correlated to 'AGE' by Spearman correlation test
| SpearmanCorr | corrP | Q | |
|---|---|---|---|
| HSA-MIR-874 | 0.3275 | 2.952e-06 | 0.00157 |
| HSA-MIR-500A | 0.2913 | 3.605e-05 | 0.0191 |
| HSA-MIR-616 | 0.2778 | 8.773e-05 | 0.0464 |
Figure S1. Get High-res Image As an example, this figure shows the association of HSA-MIR-874 to 'AGE'. P value = 2.95e-06 with Spearman correlation analysis. The straight line presents the best linear regression.
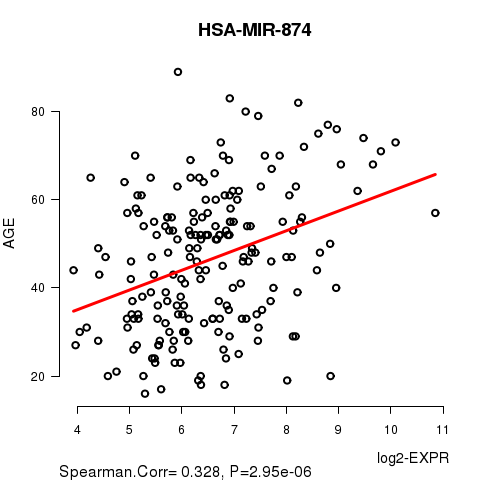
Table S3. Basic characteristics of clinical feature: 'GENDER'
| GENDER | Labels | N |
| FEMALE | 141 | |
| MALE | 54 | |
| Significant markers | N = 0 |
Table S4. Basic characteristics of clinical feature: 'HISTOLOGICAL.TYPE'
| HISTOLOGICAL.TYPE | Labels | N |
| OTHER | 8 | |
| THYROID PAPILLARY CARCINOMA - CLASSICAL/USUAL | 106 | |
| THYROID PAPILLARY CARCINOMA - FOLLICULAR (>= 99% FOLLICULAR PATTERNED) | 60 | |
| THYROID PAPILLARY CARCINOMA - TALL CELL (>= 50% TALL CELL FEATURES) | 21 | |
| Significant markers | N = 103 |
Table S5. Get Full Table List of top 10 genes differentially expressed by 'HISTOLOGICAL.TYPE'
| ANOVA_P | Q | |
|---|---|---|
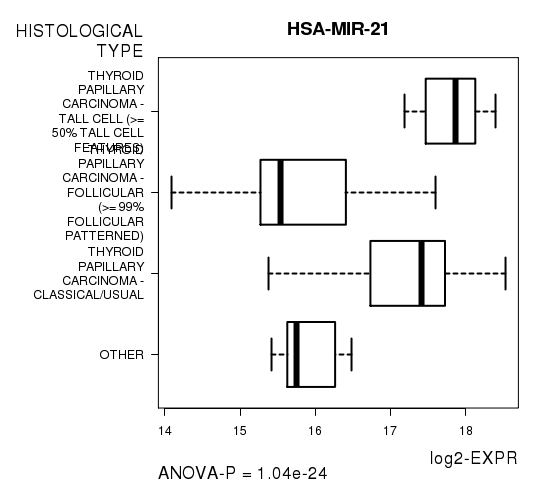
| HSA-MIR-21 | 1.043e-24 | 5.54e-22 |
| HSA-MIR-146B | 2.604e-15 | 1.38e-12 |
| HSA-MIR-7-2 | 3.043e-15 | 1.61e-12 |
| HSA-MIR-31 | 1.275e-13 | 6.73e-11 |
| HSA-MIR-3926-1 | 1.174e-12 | 6.19e-10 |
| HSA-MIR-152 | 3.335e-12 | 1.75e-09 |
| HSA-MIR-511-1 | 9.362e-12 | 4.91e-09 |
| HSA-MIR-30C-2 | 1.341e-11 | 7.03e-09 |
| HSA-MIR-1179 | 2.394e-11 | 1.25e-08 |
| HSA-MIR-204 | 3.095e-11 | 1.62e-08 |
Figure S2. Get High-res Image As an example, this figure shows the association of HSA-MIR-21 to 'HISTOLOGICAL.TYPE'. P value = 1.04e-24 with ANOVA analysis.
11 genes related to 'RADIATIONS.RADIATION.REGIMENINDICATION'.
Table S6. Basic characteristics of clinical feature: 'RADIATIONS.RADIATION.REGIMENINDICATION'
| RADIATIONS.RADIATION.REGIMENINDICATION | Labels | N |
| NO | 14 | |
| YES | 181 | |
| Significant markers | N = 11 | |
| Higher in YES | 9 | |
| Higher in NO | 2 |
Table S7. Get Full Table List of top 10 genes differentially expressed by 'RADIATIONS.RADIATION.REGIMENINDICATION'
| T(pos if higher in 'YES') | ttestP | Q | AUC | |
|---|---|---|---|---|
| HSA-MIR-1269 | 6.82 | 1.46e-08 | 7.65e-06 | 0.8713 |
| HSA-MIR-888 | 6.4 | 5.937e-08 | 3.11e-05 | 0.8444 |
| HSA-MIR-3130-1 | -6.33 | 8.646e-07 | 0.000451 | 0.7974 |
| HSA-MIR-374A | -6.9 | 8.686e-07 | 0.000453 | 0.8414 |
| HSA-MIR-2276 | 6.42 | 1.097e-06 | 0.000571 | 0.7978 |
| HSA-MIR-324 | 6.17 | 3.479e-06 | 0.00181 | 0.7987 |
| HSA-MIR-1976 | 5.62 | 1.852e-05 | 0.00959 | 0.8106 |
| HSA-MIR-660 | 5.19 | 5.349e-05 | 0.0277 | 0.8031 |
| HSA-MIR-20B | 5.06 | 6.165e-05 | 0.0318 | 0.7782 |
| HSA-LET-7G | 4.46 | 8.143e-05 | 0.0419 | 0.6772 |
Figure S3. Get High-res Image As an example, this figure shows the association of HSA-MIR-1269 to 'RADIATIONS.RADIATION.REGIMENINDICATION'. P value = 1.46e-08 with T-test analysis.
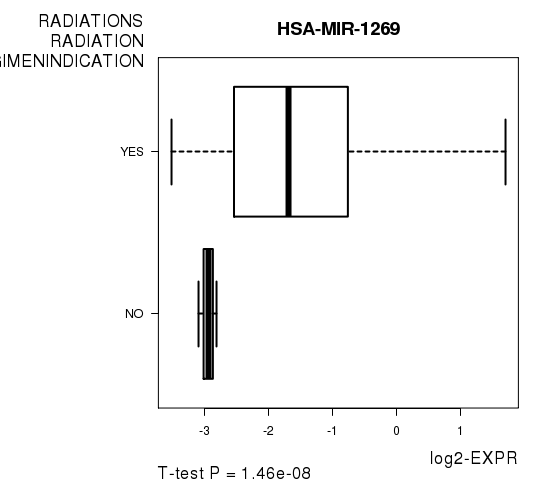
Table S8. Basic characteristics of clinical feature: 'NEOADJUVANT.THERAPY'
| NEOADJUVANT.THERAPY | Labels | N |
| NO | 3 | |
| YES | 192 | |
| Significant markers | N = 3 | |
| Higher in YES | 2 | |
| Higher in NO | 1 |
Table S9. Get Full Table List of 3 genes differentially expressed by 'NEOADJUVANT.THERAPY'
| T(pos if higher in 'YES') | ttestP | Q | AUC | |
|---|---|---|---|---|
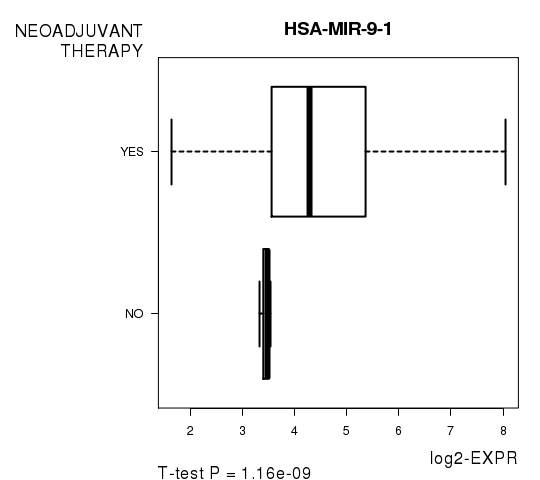
| HSA-MIR-9-1 | 9 | 1.165e-09 | 4.41e-07 | 0.7865 |
| HSA-MIR-424 | -9.68 | 1.36e-07 | 5.14e-05 | 0.8368 |
| HSA-MIR-129-1 | 13.4 | 1.077e-06 | 0.000406 | 0.9058 |
Figure S4. Get High-res Image As an example, this figure shows the association of HSA-MIR-9-1 to 'NEOADJUVANT.THERAPY'. P value = 1.16e-09 with T-test analysis.
-
Expresson data file = THCA.miRseq_RPKM_log2.txt
-
Clinical data file = THCA.clin.merged.picked.txt
-
Number of patients = 195
-
Number of genes = 531
-
Number of clinical features = 5
For continuous numerical clinical features, Spearman's rank correlation coefficients (Spearman 1904) and two-tailed P values were estimated using 'cor.test' function in R
For two-class clinical features, two-tailed Student's t test with unequal variance (Lehmann and Romano 2005) was applied to compare the log2-expression levels between the two clinical classes using 't.test' function in R
For multi-class clinical features (ordinal or nominal), one-way analysis of variance (Howell 2002) was applied to compare the log2-expression levels between different clinical classes using 'anova' function in R
For multiple hypothesis correction, Q value is the False Discovery Rate (FDR) analogue of the P value (Benjamini and Hochberg 1995), defined as the minimum FDR at which the test may be called significant. We used the 'Benjamini and Hochberg' method of 'p.adjust' function in R to convert P values into Q values.
This is an experimental feature. The full results of the analysis summarized in this report can be downloaded from the TCGA Data Coordination Center.