This pipeline uses various statistical tests to identify mRNAs whose expression levels correlated to selected clinical features.
Testing the association between 18744 genes and 5 clinical features across 266 samples, statistically thresholded by Q value < 0.05, 4 clinical features related to at least one genes.
-
1 gene correlated to 'Time to Death'.
-
KCNK10|54207
-
135 genes correlated to 'AGE'.
-
DIO2|1734 , DACT1|51339 , TNFAIP2|7127 , S100A1|6271 , CYGB|114757 , ...
-
1392 genes correlated to 'HISTOLOGICAL.TYPE'.
-
KIAA1324|57535 , L1CAM|3897 , SPDEF|25803 , HIF3A|64344 , CLDN6|9074 , ...
-
11 genes correlated to 'NEOADJUVANT.THERAPY'.
-
RANGRF|29098 , WFDC1|58189 , ANAPC4|29945 , NPDC1|56654 , IHH|3549 , ...
-
No genes correlated to 'RADIATIONS.RADIATION.REGIMENINDICATION'
Complete statistical result table is provided in Supplement Table 1
Table 1. Get Full Table This table shows the clinical features, statistical methods used, and the number of genes that are significantly associated with each clinical feature at Q value < 0.05.
| Clinical feature | Statistical test | Significant genes | Associated with | Associated with | ||
|---|---|---|---|---|---|---|
| Time to Death | Cox regression test | N=1 | shorter survival | N=1 | longer survival | N=0 |
| AGE | Spearman correlation test | N=135 | older | N=51 | younger | N=84 |
| HISTOLOGICAL TYPE | ANOVA test | N=1392 | ||||
| RADIATIONS RADIATION REGIMENINDICATION | t test | N=0 | ||||
| NEOADJUVANT THERAPY | t test | N=11 | yes | N=10 | no | N=1 |
Table S1. Basic characteristics of clinical feature: 'Time to Death'
| Time to Death | Duration (Months) | 0-173.6 (median=20.2) |
| censored | N = 246 | |
| death | N = 20 | |
| Significant markers | N = 1 | |
| associated with shorter survival | 1 | |
| associated with longer survival | 0 |
Table S2. Get Full Table List of one gene significantly associated with 'Time to Death' by Cox regression test
| HazardRatio | Wald_P | Q | C_index | |
|---|---|---|---|---|
| KCNK10|54207 | 2.4 | 1.168e-07 | 0.0022 | 0.763 |
Figure S1. Get High-res Image As an example, this figure shows the association of KCNK10|54207 to 'Time to Death'. four curves present the cumulative survival rates of 4 quartile subsets of patients. P value = 1.17e-07 with univariate Cox regression analysis using continuous log-2 expression values.
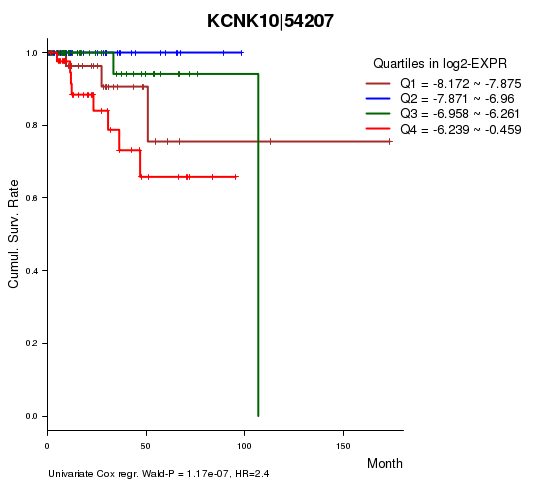
Table S3. Basic characteristics of clinical feature: 'AGE'
| AGE | Mean (SD) | 63.13 (11) |
| Significant markers | N = 135 | |
| pos. correlated | 51 | |
| neg. correlated | 84 |
Table S4. Get Full Table List of top 10 genes significantly correlated to 'AGE' by Spearman correlation test
| SpearmanCorr | corrP | Q | |
|---|---|---|---|
| DIO2|1734 | -0.4108 | 2.977e-12 | 5.58e-08 |
| DACT1|51339 | -0.3832 | 9.863e-11 | 1.85e-06 |
| TNFAIP2|7127 | 0.3737 | 3.044e-10 | 5.7e-06 |
| S100A1|6271 | 0.372 | 3.737e-10 | 7e-06 |
| CYGB|114757 | -0.362 | 1.172e-09 | 2.2e-05 |
| PTCH1|5727 | -0.3515 | 3.729e-09 | 6.99e-05 |
| DLC1|10395 | -0.3505 | 4.169e-09 | 7.81e-05 |
| KIAA1199|57214 | -0.3491 | 4.877e-09 | 9.14e-05 |
| PDGFRB|5159 | -0.3486 | 5.103e-09 | 9.56e-05 |
| PHLDA1|22822 | -0.3471 | 6.024e-09 | 0.000113 |
Figure S2. Get High-res Image As an example, this figure shows the association of DIO2|1734 to 'AGE'. P value = 2.98e-12 with Spearman correlation analysis. The straight line presents the best linear regression.
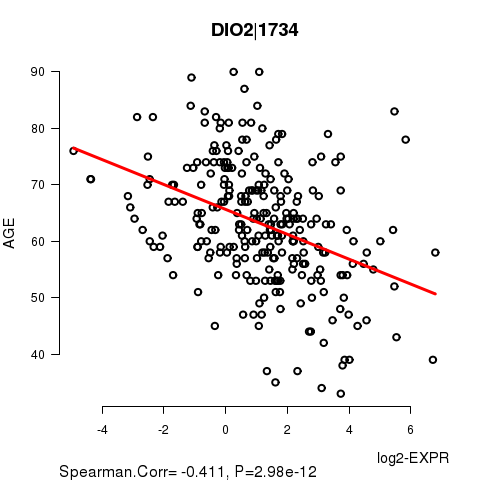
Table S5. Basic characteristics of clinical feature: 'HISTOLOGICAL.TYPE'
| HISTOLOGICAL.TYPE | Labels | N |
| ENDOMETRIOID ENDOMETRIAL ADENOCARCINOMA | 205 | |
| ENDOMETRIOID ENDOMETRIAL ADENOCARCINOMA (GRADE 1 OR 2) | 3 | |
| ENDOMETRIOID ENDOMETRIAL ADENOCARCINOMA (GRADE 1) | 4 | |
| ENDOMETRIOID ENDOMETRIAL ADENOCARCINOMA (GRADE 2) | 1 | |
| ENDOMETRIOID ENDOMETRIAL ADENOCARCINOMA (GRADE 3) | 5 | |
| MIXED SEROUS AND ENDOMETRIOID | 7 | |
| SEROUS ENDOMETRIAL ADENOCARCINOMA | 41 | |
| Significant markers | N = 1392 |
Table S6. Get Full Table List of top 10 genes differentially expressed by 'HISTOLOGICAL.TYPE'
| ANOVA_P | Q | |
|---|---|---|
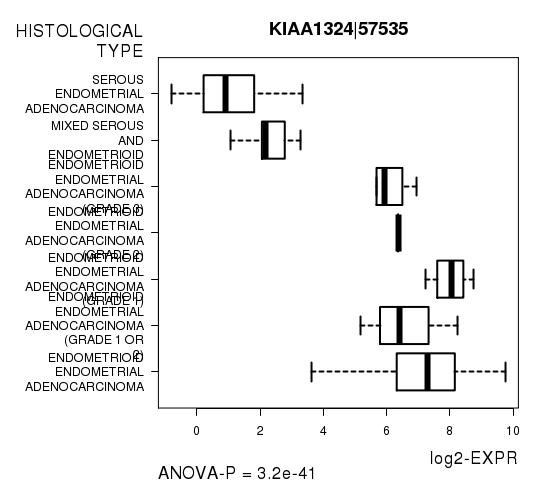
| KIAA1324|57535 | 3.201e-41 | 6e-37 |
| L1CAM|3897 | 6.779e-35 | 1.27e-30 |
| SPDEF|25803 | 8.597e-33 | 1.61e-28 |
| HIF3A|64344 | 9.313e-30 | 1.75e-25 |
| CLDN6|9074 | 1.3e-27 | 2.44e-23 |
| TFF3|7033 | 2.257e-27 | 4.23e-23 |
| SLC6A12|6539 | 5.885e-27 | 1.1e-22 |
| FOXA2|3170 | 2.98e-26 | 5.58e-22 |
| FIGNL2|401720 | 3.16e-26 | 5.92e-22 |
| IL20RA|53832 | 1.441e-25 | 2.7e-21 |
Figure S3. Get High-res Image As an example, this figure shows the association of KIAA1324|57535 to 'HISTOLOGICAL.TYPE'. P value = 3.2e-41 with ANOVA analysis.
No gene related to 'RADIATIONS.RADIATION.REGIMENINDICATION'.
Table S7. Basic characteristics of clinical feature: 'RADIATIONS.RADIATION.REGIMENINDICATION'
| RADIATIONS.RADIATION.REGIMENINDICATION | Labels | N |
| NO | 99 | |
| YES | 167 | |
| Significant markers | N = 0 |
Table S8. Basic characteristics of clinical feature: 'NEOADJUVANT.THERAPY'
| NEOADJUVANT.THERAPY | Labels | N |
| NO | 83 | |
| YES | 183 | |
| Significant markers | N = 11 | |
| Higher in YES | 10 | |
| Higher in NO | 1 |
Table S9. Get Full Table List of top 10 genes differentially expressed by 'NEOADJUVANT.THERAPY'
| T(pos if higher in 'YES') | ttestP | Q | AUC | |
|---|---|---|---|---|
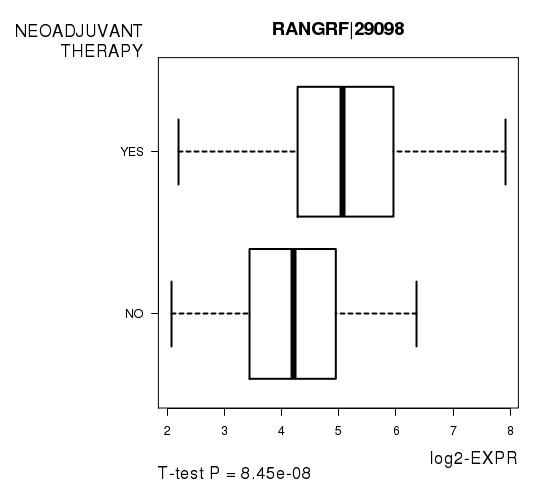
| RANGRF|29098 | 5.61 | 8.45e-08 | 0.00158 | 0.6981 |
| WFDC1|58189 | 5.14 | 8.394e-07 | 0.0157 | 0.6877 |
| ANAPC4|29945 | 5.03 | 1.239e-06 | 0.0232 | 0.6803 |
| NPDC1|56654 | 5.07 | 1.24e-06 | 0.0232 | 0.7089 |
| IHH|3549 | 5.03 | 1.431e-06 | 0.0268 | 0.6894 |
| NEIL1|79661 | 5.03 | 1.466e-06 | 0.0275 | 0.6854 |
| CEBPB|1051 | -4.99 | 1.764e-06 | 0.0331 | 0.6904 |
| KIAA1324|57535 | 4.99 | 1.838e-06 | 0.0344 | 0.6773 |
| C19ORF45|374877 | 4.95 | 2.005e-06 | 0.0376 | 0.6815 |
| HSF4|3299 | 4.91 | 2.337e-06 | 0.0438 | 0.6865 |
Figure S4. Get High-res Image As an example, this figure shows the association of RANGRF|29098 to 'NEOADJUVANT.THERAPY'. P value = 8.45e-08 with T-test analysis.
-
Expresson data file = UCEC.mRNAseq_RPKM_log2.txt
-
Clinical data file = UCEC.clin.merged.picked.txt
-
Number of patients = 266
-
Number of genes = 18744
-
Number of clinical features = 5
For survival clinical features, Wald's test in univariate Cox regression analysis with proportional hazards model (Andersen and Gill 1982) was used to estimate the P values using the 'coxph' function in R. Kaplan-Meier survival curves were plot using the four quartile subgroups of patients based on expression levels
For continuous numerical clinical features, Spearman's rank correlation coefficients (Spearman 1904) and two-tailed P values were estimated using 'cor.test' function in R
For multi-class clinical features (ordinal or nominal), one-way analysis of variance (Howell 2002) was applied to compare the log2-expression levels between different clinical classes using 'anova' function in R
For two-class clinical features, two-tailed Student's t test with unequal variance (Lehmann and Romano 2005) was applied to compare the log2-expression levels between the two clinical classes using 't.test' function in R
For multiple hypothesis correction, Q value is the False Discovery Rate (FDR) analogue of the P value (Benjamini and Hochberg 1995), defined as the minimum FDR at which the test may be called significant. We used the 'Benjamini and Hochberg' method of 'p.adjust' function in R to convert P values into Q values.
This is an experimental feature. The full results of the analysis summarized in this report can be downloaded from the TCGA Data Coordination Center.