This pipeline uses various statistical tests to identify genes whose promoter methylation levels correlated to selected clinical features.
Testing the association between 17782 genes and 5 clinical features across 152 samples, statistically thresholded by Q value < 0.05, 4 clinical features related to at least one genes.
-
24 genes correlated to 'AGE'.
-
ALS2CL , SLFN14 , PIK3C2B , GPRC5C , NDOR1 , ...
-
971 genes correlated to 'HISTOLOGICAL.TYPE'.
-
WDTC1 , EXD1 , C7ORF70 , TMEM61 , CHP , ...
-
1 gene correlated to 'RADIATIONS.RADIATION.REGIMENINDICATION'.
-
TMEM125
-
1 gene correlated to 'NEOADJUVANT.THERAPY'.
-
ZFHX3
-
No genes correlated to 'Time to Death'
Complete statistical result table is provided in Supplement Table 1
Table 1. Get Full Table This table shows the clinical features, statistical methods used, and the number of genes that are significantly associated with each clinical feature at Q value < 0.05.
| Clinical feature | Statistical test | Significant genes | Associated with | Associated with | ||
|---|---|---|---|---|---|---|
| Time to Death | Cox regression test | N=0 | ||||
| AGE | Spearman correlation test | N=24 | older | N=4 | younger | N=20 |
| HISTOLOGICAL TYPE | ANOVA test | N=971 | ||||
| RADIATIONS RADIATION REGIMENINDICATION | t test | N=1 | yes | N=1 | no | N=0 |
| NEOADJUVANT THERAPY | t test | N=1 | yes | N=0 | no | N=1 |
Table S1. Basic characteristics of clinical feature: 'Time to Death'
| Time to Death | Duration (Months) | 0-173.6 (median=12.6) |
| censored | N = 143 | |
| death | N = 9 | |
| Significant markers | N = 0 |
Table S2. Basic characteristics of clinical feature: 'AGE'
| AGE | Mean (SD) | 63.38 (11) |
| Significant markers | N = 24 | |
| pos. correlated | 4 | |
| neg. correlated | 20 |
Table S3. Get Full Table List of top 10 genes significantly correlated to 'AGE' by Spearman correlation test
| SpearmanCorr | corrP | Q | |
|---|---|---|---|
| ALS2CL | -0.4666 | 1.366e-09 | 2.43e-05 |
| SLFN14 | 0.4424 | 1.149e-08 | 0.000204 |
| PIK3C2B | -0.4163 | 9.564e-08 | 0.0017 |
| GPRC5C | -0.4152 | 1.046e-07 | 0.00186 |
| NDOR1 | -0.403 | 2.642e-07 | 0.0047 |
| ACAA2 | -0.3969 | 4.139e-07 | 0.00736 |
| SCARNA17 | -0.3969 | 4.139e-07 | 0.00736 |
| PLA2G15 | -0.3956 | 4.552e-07 | 0.00809 |
| NCRNA00203 | -0.3944 | 4.963e-07 | 0.00882 |
| TAC3 | 0.392 | 5.907e-07 | 0.0105 |
Figure S1. Get High-res Image As an example, this figure shows the association of ALS2CL to 'AGE'. P value = 1.37e-09 with Spearman correlation analysis. The straight line presents the best linear regression.
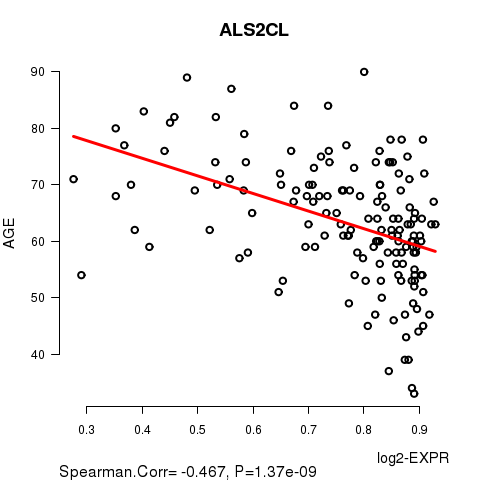
Table S4. Basic characteristics of clinical feature: 'HISTOLOGICAL.TYPE'
| HISTOLOGICAL.TYPE | Labels | N |
| ENDOMETRIOID ENDOMETRIAL ADENOCARCINOMA | 120 | |
| ENDOMETRIOID ENDOMETRIAL ADENOCARCINOMA (GRADE 1) | 1 | |
| ENDOMETRIOID ENDOMETRIAL ADENOCARCINOMA (GRADE 3) | 1 | |
| MIXED SEROUS AND ENDOMETRIOID | 6 | |
| SEROUS ENDOMETRIAL ADENOCARCINOMA | 24 | |
| Significant markers | N = 971 |
Table S5. Get Full Table List of top 10 genes differentially expressed by 'HISTOLOGICAL.TYPE'
| ANOVA_P | Q | |
|---|---|---|
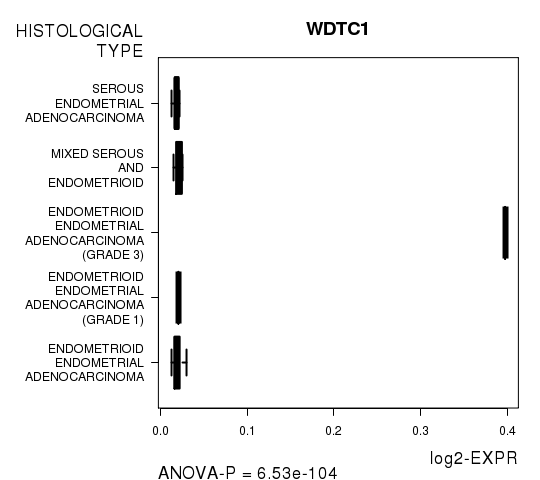
| WDTC1 | 6.534e-104 | 1.16e-99 |
| EXD1 | 4.98e-83 | 8.86e-79 |
| C7ORF70 | 6.68e-70 | 1.19e-65 |
| TMEM61 | 5.283e-65 | 9.39e-61 |
| CHP | 8.728e-56 | 1.55e-51 |
| PNPO | 2.764e-50 | 4.91e-46 |
| C9ORF80 | 4.563e-48 | 8.11e-44 |
| ASCC3 | 9.97e-48 | 1.77e-43 |
| LOC221442 | 1.327e-47 | 2.36e-43 |
| GBP2 | 4.827e-42 | 8.58e-38 |
Figure S2. Get High-res Image As an example, this figure shows the association of WDTC1 to 'HISTOLOGICAL.TYPE'. P value = 6.53e-104 with ANOVA analysis.
One gene related to 'RADIATIONS.RADIATION.REGIMENINDICATION'.
Table S6. Basic characteristics of clinical feature: 'RADIATIONS.RADIATION.REGIMENINDICATION'
| RADIATIONS.RADIATION.REGIMENINDICATION | Labels | N |
| NO | 46 | |
| YES | 106 | |
| Significant markers | N = 1 | |
| Higher in YES | 1 | |
| Higher in NO | 0 |
Table S7. Get Full Table List of one gene differentially expressed by 'RADIATIONS.RADIATION.REGIMENINDICATION'
| T(pos if higher in 'YES') | ttestP | Q | AUC | |
|---|---|---|---|---|
| TMEM125 | 5.11 | 9.798e-07 | 0.0174 | 0.7334 |
Figure S3. Get High-res Image As an example, this figure shows the association of TMEM125 to 'RADIATIONS.RADIATION.REGIMENINDICATION'. P value = 9.8e-07 with T-test analysis.
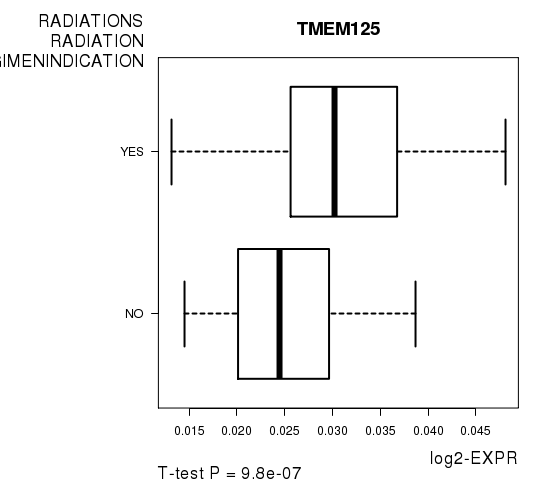
Table S8. Basic characteristics of clinical feature: 'NEOADJUVANT.THERAPY'
| NEOADJUVANT.THERAPY | Labels | N |
| NO | 48 | |
| YES | 104 | |
| Significant markers | N = 1 | |
| Higher in YES | 0 | |
| Higher in NO | 1 |
Table S9. Get Full Table List of one gene differentially expressed by 'NEOADJUVANT.THERAPY'
| T(pos if higher in 'YES') | ttestP | Q | AUC | |
|---|---|---|---|---|
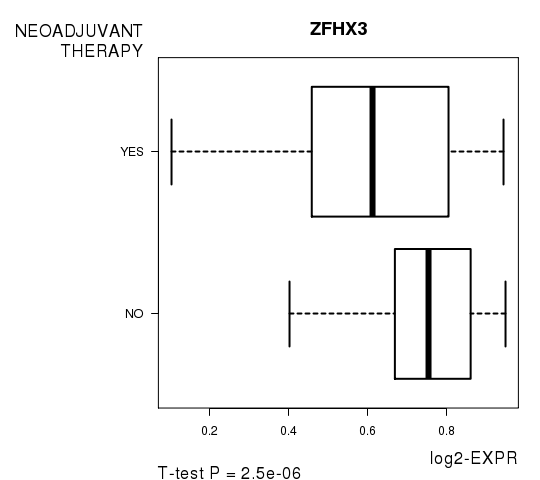
| ZFHX3 | -4.92 | 2.504e-06 | 0.0445 | 0.6983 |
Figure S4. Get High-res Image As an example, this figure shows the association of ZFHX3 to 'NEOADJUVANT.THERAPY'. P value = 2.5e-06 with T-test analysis.
-
Expresson data file = UCEC.meth.for_correlation.filtered_data.txt
-
Clinical data file = UCEC.clin.merged.picked.txt
-
Number of patients = 152
-
Number of genes = 17782
-
Number of clinical features = 5
For survival clinical features, Wald's test in univariate Cox regression analysis with proportional hazards model (Andersen and Gill 1982) was used to estimate the P values using the 'coxph' function in R. Kaplan-Meier survival curves were plot using the four quartile subgroups of patients based on expression levels
For continuous numerical clinical features, Spearman's rank correlation coefficients (Spearman 1904) and two-tailed P values were estimated using 'cor.test' function in R
For multi-class clinical features (ordinal or nominal), one-way analysis of variance (Howell 2002) was applied to compare the log2-expression levels between different clinical classes using 'anova' function in R
For two-class clinical features, two-tailed Student's t test with unequal variance (Lehmann and Romano 2005) was applied to compare the log2-expression levels between the two clinical classes using 't.test' function in R
For multiple hypothesis correction, Q value is the False Discovery Rate (FDR) analogue of the P value (Benjamini and Hochberg 1995), defined as the minimum FDR at which the test may be called significant. We used the 'Benjamini and Hochberg' method of 'p.adjust' function in R to convert P values into Q values.
This is an experimental feature. The full results of the analysis summarized in this report can be downloaded from the TCGA Data Coordination Center.