This pipeline uses various statistical tests to identify RPPAs whose expression levels correlated to selected clinical features.
Testing the association between 165 genes and 5 clinical features across 408 samples, statistically thresholded by Q value < 0.05, 2 clinical features related to at least one genes.
-
19 genes correlated to 'AGE'.
-
ESR1|ER-ALPHA-R-V , NOTCH3|NOTCH3-R-C , SETD2|SETD2-R-NA , STMN1|STATHMIN-R-V , MET|C-MET_PY1235-R-C , ...
-
1 gene correlated to 'NEOADJUVANT.THERAPY'.
-
RPS6KB1|P70S6K_PT389-R-V
-
No genes correlated to 'Time to Death', 'GENDER', and 'RADIATIONS.RADIATION.REGIMENINDICATION'.
Complete statistical result table is provided in Supplement Table 1
Table 1. Get Full Table This table shows the clinical features, statistical methods used, and the number of genes that are significantly associated with each clinical feature at Q value < 0.05.
| Clinical feature | Statistical test | Significant genes | Associated with | Associated with | ||
|---|---|---|---|---|---|---|
| Time to Death | Cox regression test | N=0 | ||||
| AGE | Spearman correlation test | N=19 | older | N=6 | younger | N=13 |
| GENDER | t test | N=0 | ||||
| RADIATIONS RADIATION REGIMENINDICATION | t test | N=0 | ||||
| NEOADJUVANT THERAPY | t test | N=1 | yes | N=1 | no | N=0 |
Table S1. Basic characteristics of clinical feature: 'Time to Death'
| Time to Death | Duration (Months) | 0.1-189 (median=24.5) |
| censored | N = 336 | |
| death | N = 44 | |
| Significant markers | N = 0 |
Table S2. Basic characteristics of clinical feature: 'AGE'
| AGE | Mean (SD) | 57.85 (13) |
| Significant markers | N = 19 | |
| pos. correlated | 6 | |
| neg. correlated | 13 |
Table S3. Get Full Table List of top 10 genes significantly correlated to 'AGE' by Spearman correlation test
| SpearmanCorr | corrP | Q | |
|---|---|---|---|
| ESR1|ER-ALPHA-R-V | 0.384 | 8.695e-16 | 1.43e-13 |
| NOTCH3|NOTCH3-R-C | -0.276 | 1.442e-08 | 2.36e-06 |
| SETD2|SETD2-R-NA | -0.2441 | 6.005e-07 | 9.79e-05 |
| STMN1|STATHMIN-R-V | -0.2352 | 1.552e-06 | 0.000251 |
| MET|C-MET_PY1235-R-C | -0.2158 | 1.09e-05 | 0.00175 |
| KIT|C-KIT-R-V | -0.2144 | 1.249e-05 | 0.002 |
| CDC2|CDK1-R-V | -0.2094 | 2.016e-05 | 0.0032 |
| AR|AR-R-V | 0.2091 | 2.055e-05 | 0.00325 |
| CDH3|P-CADHERIN-R-C | -0.2017 | 4.058e-05 | 0.00637 |
| PDK1|PDK1_PS241-R-V | 0.1972 | 6.056e-05 | 0.00945 |
Figure S1. Get High-res Image As an example, this figure shows the association of ESR1|ER-ALPHA-R-V to 'AGE'. P value = 8.7e-16 with Spearman correlation analysis. The straight line presents the best linear regression.
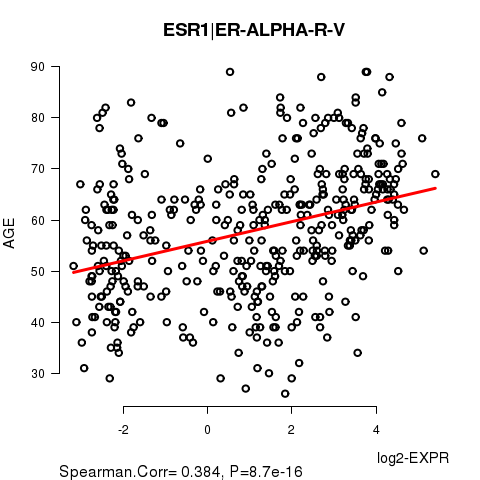
Table S4. Basic characteristics of clinical feature: 'GENDER'
| GENDER | Labels | N |
| FEMALE | 403 | |
| MALE | 5 | |
| Significant markers | N = 0 |
No gene related to 'RADIATIONS.RADIATION.REGIMENINDICATION'.
Table S5. Basic characteristics of clinical feature: 'RADIATIONS.RADIATION.REGIMENINDICATION'
| RADIATIONS.RADIATION.REGIMENINDICATION | Labels | N |
| NO | 124 | |
| YES | 284 | |
| Significant markers | N = 0 |
Table S6. Basic characteristics of clinical feature: 'NEOADJUVANT.THERAPY'
| NEOADJUVANT.THERAPY | Labels | N |
| NO | 188 | |
| YES | 220 | |
| Significant markers | N = 1 | |
| Higher in YES | 1 | |
| Higher in NO | 0 |
Table S7. Get Full Table List of one gene differentially expressed by 'NEOADJUVANT.THERAPY'
| T(pos if higher in 'YES') | ttestP | Q | AUC | |
|---|---|---|---|---|
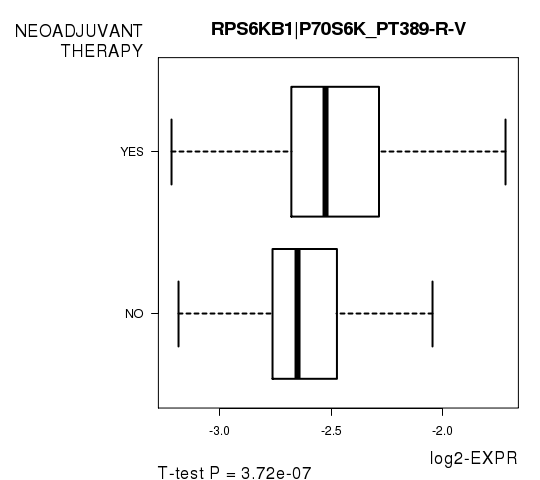
| RPS6KB1|P70S6K_PT389-R-V | 5.17 | 3.718e-07 | 6.14e-05 | 0.6415 |
Figure S2. Get High-res Image As an example, this figure shows the association of RPS6KB1|P70S6K_PT389-R-V to 'NEOADJUVANT.THERAPY'. P value = 3.72e-07 with T-test analysis.
-
Expresson data file = BRCA.rppa.txt
-
Clinical data file = BRCA.clin.merged.picked.txt
-
Number of patients = 408
-
Number of genes = 165
-
Number of clinical features = 5
For survival clinical features, Wald's test in univariate Cox regression analysis with proportional hazards model (Andersen and Gill 1982) was used to estimate the P values using the 'coxph' function in R. Kaplan-Meier survival curves were plot using the four quartile subgroups of patients based on expression levels
For continuous numerical clinical features, Spearman's rank correlation coefficients (Spearman 1904) and two-tailed P values were estimated using 'cor.test' function in R
For two-class clinical features, two-tailed Student's t test with unequal variance (Lehmann and Romano 2005) was applied to compare the log2-expression levels between the two clinical classes using 't.test' function in R
For multiple hypothesis correction, Q value is the False Discovery Rate (FDR) analogue of the P value (Benjamini and Hochberg 1995), defined as the minimum FDR at which the test may be called significant. We used the 'Benjamini and Hochberg' method of 'p.adjust' function in R to convert P values into Q values.
This is an experimental feature. The full results of the analysis summarized in this report can be downloaded from the TCGA Data Coordination Center.